PatternTransitionTablesPatternTransitionTables Library
🌸 Part of GoemonYae Trading System (GYTS) 🌸
🌸 --------- 1. INTRODUCTION --------- 🌸
💮 Overview
This library provides precomputed state transition tables to enable ultra-efficient, O(1) computation of Ordinal Patterns. It is designed specifically to support high-performance indicators calculating Permutation Entropy and related complexity measures.
💮 The Problem & Solution
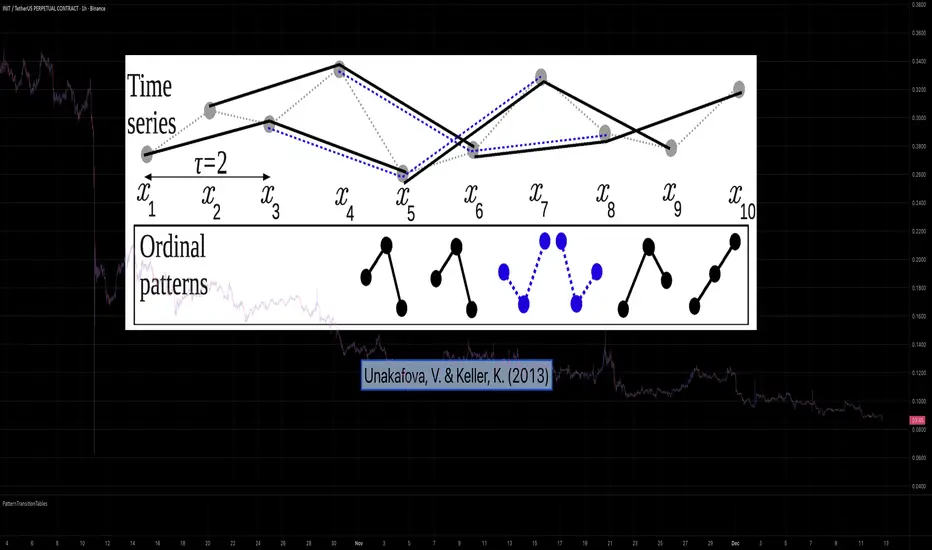
Calculating Permutation Entropy, as introduced by Bandt and Pompe (2002), typically requires computing ordinal patterns within a sliding window at every time step. The standard successive-pattern method (Equations 2+3 in the paper) requires ≤ 4d-1 operations per update.
Unakafova and Keller (2013) demonstrated that successive ordinal patterns "overlap" significantly. By knowing the current pattern index and the relative rank (position l) of just the single new data point, the next pattern index can be determined via a precomputed look-up table. Computing l still requires d comparisons, but the table lookup itself is O(1), eliminating the need for d multiplications and d additions. This reduces total operations from ≤ 4d-1 to ≤ 2d per update (Table 4). This library contains these precomputed tables for orders d = 2 through d = 5.
🌸 --------- 2. THEORETICAL BACKGROUND --------- 🌸
💮 Permutation Entropy
Bandt, C., & Pompe, B. (2002). Permutation entropy: A natural complexity measure for time series.
doi.org
This concept quantifies the complexity of a system by comparing the order of neighbouring values rather than their magnitudes. It is robust against noise and non-linear distortions, making it ideal for financial time series analysis.
💮 Efficient Computation
Unakafova, V. A., & Keller, K. (2013). Efficiently Measuring Complexity on the Basis of Real-World Data.
doi.org
This library implements the transition function φ_d(n, l) described in Equation 5 of the paper. It maps a current pattern index (n) and the position of the new value (l) to the successor pattern, reducing the complexity of updates to constant time O(1).
🌸 --------- 3. LIBRARY FUNCTIONALITY --------- 🌸
💮 Data Structure
The library stores transition matrices as flattened 1D integer arrays. These tables are mathematically rigorous representations of the factorial number system used to enumerate permutations.
💮 Core Function: get_successor()
This is the primary interface for the library for direct pattern updates.
• Input: The current pattern index and the rank position of the incoming price data.
• Process: Routes the request to the specific transition table for the chosen order (d=2 to d=5).
• Output: The integer index of the next ordinal pattern.
💮 Table Access: get_table()
This function returns the entire flattened transition table for a specified dimension. This enables local caching of the table (e.g. in an indicator's init() method), avoiding the overhead of repeated library calls during the calculation loop.
💮 Supported Orders & Terminology
The parameter d is the order of ordinal patterns (following Bandt & Pompe 2002). Each pattern of order d contains (d+1) data points, yielding (d+1)! unique patterns:
• d=2: 3 points → 6 unique patterns, 3 successor positions
• d=3: 4 points → 24 unique patterns, 4 successor positions
• d=4: 5 points → 120 unique patterns, 5 successor positions
• d=5: 6 points → 720 unique patterns, 6 successor positions
Note: d=6 is not implemented. The resulting code size (approx. 191k tokens) exceeds the Pine Script limit of 100k tokens (as of 2025-12).
Penunjuk dan strategi
SharelineUI_LibraryLibrary "SharelineUI_Library"
get_text_size(opt)
Parameters:
opt (string)
status_color(val)
Parameters:
val (float)
trend_color(trend_cat)
Parameters:
trend_cat (string)
momentum_color(score, bullTh, bearTh)
Parameters:
score (float)
bullTh (float)
bearTh (float)
create_standard_hud(pos, cols, rows)
Parameters:
pos (string)
cols (int)
rows (int)

SharelineCore_LibraryLibrary "SharelineCore_Library"
funding_premium(premiumSym, funding_period, plot_type, interest_rate, fundScale)
Parameters:
premiumSym (string)
funding_period (string)
plot_type (string)
interest_rate (float)
fundScale (float)
cvd_vwap_delta(spotSym, perpSym, normLen, resetCVD)
Parameters:
spotSym (string)
perpSym (string)
normLen (int)
resetCVD (bool)
cvd_trend_norm(spotSymbol, perpSymbol, normLen, resetOnSession)
Parameters:
spotSymbol (string)
perpSymbol (string)
normLen (int)
resetOnSession (bool)
trend_strength_engine(cvdSpot, cvdPerp)
Parameters:
cvdSpot (float)
cvdPerp (float)
bias_engine(plot_value, spotTrendVal, perpTrendVal, spotStrength, perpStrength)
Parameters:
plot_value (float)
spotTrendVal (float)
perpTrendVal (float)
spotStrength (float)
perpStrength (float)
smc_engine(h, l, c, v, ms_len, bos_len, vol_filter, scale_factor, smooth_len, signal_len)
Parameters:
h (float)
l (float)
c (float)
v (float)
ms_len (int)
bos_len (int)
vol_filter (bool)
scale_factor (float)
smooth_len (simple int)
signal_len (simple int)
momentum_engine(o, c, v, fast, slow, signal, rsiLen, normLen, smaShort, smaLong, wMacd, wRsi, wCvd, wVpi)
Parameters:
o (float)
c (float)
v (float)
fast (simple int)
slow (simple int)
signal (simple int)
rsiLen (simple int)
normLen (int)
smaShort (int)
smaLong (int)
wMacd (float)
wRsi (float)
wCvd (float)
wVpi (float)
oi_engine(quotecur, useBinance, useBinance2, useBinance3, useBitmex, useBitmex2, useKraken, d_mult, strength1_mult, strength2_mult)
Parameters:
quotecur (string)
useBinance (bool)
useBinance2 (bool)
useBinance3 (bool)
useBitmex (bool)
useBitmex2 (bool)
useKraken (bool)
d_mult (float)
strength1_mult (float)
strength2_mult (float)

TRZigZagLibLibrary "TRZigZagLib"
method directionName(this)
Gets pivot direction as string
Namespace types: Pivot
Parameters:
this (Pivot) : Pivot instance
Returns: "HIGH" or "LOW"
method isHigh(this)
Checks if pivot is a high
Namespace types: Pivot
Parameters:
this (Pivot) : Pivot instance
Returns: true if pivot is a high
method isLow(this)
Checks if pivot is a low
Namespace types: Pivot
Parameters:
this (Pivot) : Pivot instance
Returns: true if pivot is a low
method newSettings(minLength, minBarSize, maxBarSize)
Creates default ZigZag settings
Namespace types: series int, simple int, input int, const int
Parameters:
minLength (int) : Minimum pivot length (default: 10)
minBarSize (int) : Minimum bars between pivots (default: 5)
maxBarSize (int) : Maximum bars to lookback (default: 300)
Returns: New ZigZagSettings instance
method setLineStyle(this, lineColor, lineWidth, lineStyle)
Sets line appearance
Namespace types: ZigZagSettings
Parameters:
this (ZigZagSettings) : Settings instance
lineColor (color)
lineWidth (int)
lineStyle (string)
Returns: Modified settings instance
method newZigZag(settings, depth)
Creates a new ZigZag instance
Namespace types: ZigZagSettings
Parameters:
settings (ZigZagSettings) : ZigZag settings
depth (int) : Depth value for this ZigZag
Returns: New ZigZag instance
method calculate(this)
Calculates ZigZag using LuxAlgo-style pivot detection
Namespace types: ZigZag
Parameters:
this (ZigZag) : ZigZag instance
method getLastPivots(this, count)
Gets the last N pivots
Namespace types: ZigZag
Parameters:
this (ZigZag) : ZigZag instance
count (int) : Number of pivots to get (default: 5)
Returns: Array of pivots
method getPivot(this, index)
Gets pivot at index
Namespace types: ZigZag
Parameters:
this (ZigZag) : ZigZag instance
index (int) : Index (0 = most recent)
Returns: Pivot or na
method truncate(this, maxBars)
Truncates old pivots beyond lookback window
Namespace types: ZigZag
Parameters:
this (ZigZag) : ZigZag instance
maxBars (int) : Maximum bars to keep
method newMultiZigZag(settings, minDepth, maxDepth, count)
Creates a new MultiZigZag manager
Namespace types: ZigZagSettings
Parameters:
settings (ZigZagSettings) : Base settings for all ZigZags
minDepth (int) : Minimum depth value
maxDepth (int) : Maximum depth value
count (int) : Number of ZigZag instances (max 11)
Returns: New MultiZigZag instance
method calculateAll(this)
Updates all ZigZag instances
Namespace types: MultiZigZag
Parameters:
this (MultiZigZag) : MultiZigZag instance
method getZigZag(this, index)
Gets ZigZag at index
Namespace types: MultiZigZag
Parameters:
this (MultiZigZag) : MultiZigZag instance
index (int) : Index (0 to count-1)
Returns: ZigZag instance or na
method getDepth(this, index)
Gets depth value at index
Namespace types: MultiZigZag
Parameters:
this (MultiZigZag) : MultiZigZag instance
index (int) : Index (0 to count-1)
Returns: Depth value
method size(this)
Gets total number of ZigZag instances
Namespace types: MultiZigZag
Parameters:
this (MultiZigZag) : MultiZigZag instance
Returns: Count of ZigZag instances
method truncateAll(this, maxBars)
Truncates all ZigZag instances
Namespace types: MultiZigZag
Parameters:
this (MultiZigZag) : MultiZigZag instance
maxBars (int) : Maximum bars to keep
method distance(p1, p2)
Calculates distance between two pivots
Namespace types: Pivot
Parameters:
p1 (Pivot) : First pivot
p2 (Pivot) : Second pivot
Returns: Price distance (absolute)
method barSpan(p1, p2)
Calculates bar span between two pivots
Namespace types: Pivot
Parameters:
p1 (Pivot) : First pivot
p2 (Pivot) : Second pivot
Returns: Bar span (absolute)
method isAlternating(pivots)
Checks if pivots are alternating (high-low-high or low-high-low)
Namespace types: array
Parameters:
pivots (array) : Array of pivots
Returns: true if alternating pattern exists
Pivot
Pivot point in the chart
Fields:
d (series int) : Direction: 1=high, -1=low
x (series int) : Bar index
y (series float) : Price
confirmed (series bool) : Pivot confirmation flag
ZigZagSettings
ZigZag configuration settings
Fields:
minLength (series int) : Minimum pivot detection length
minBarSize (series int) : Minimum bars between pivots
maxBarSize (series int) : Maximum bars to lookback
lineColor (series color) : ZigZag line color
lineWidth (series int) : ZigZag line width
lineStyle (series string) : ZigZag line style
ZigZag
Single ZigZag instance
Fields:
settings (ZigZagSettings) : Configuration settings
pivots (array) : Array of pivot points (max 25 for patterns)
lastUpdateBar (series int) : Last bar index when updated
depth (series int) : Current depth value
MultiZigZag
Multi-depth ZigZag manager
Fields:
zigzags (array) : Array of ZigZag instances (max 11)
depthValues (array) : Array of depth values being used
currentBar (series int) : Current bar index being processed

LuxyEnergyIndexThe Luxy Energy Index (LEI) library provides functions to measure price movement exhaustion by analyzing three dimensions: Extension (distance from fair value), Velocity (speed of movement), and Volume (confirmation level).
LEI answers a different question than traditional momentum indicators: instead of "how far has price gone?" (like RSI), LEI asks "how tired is this move?"
This library allows Pine Script developers to integrate LEI calculations into their own indicators and strategies.
How to Import
//@version=6
indicator("My Indicator")
import OrenLuxy/LuxyEnergyIndex/1 as LEI
Main Functions
`lei(src)` → float
Returns the LEI value on a 0-100 scale.
src (optional): Price source, default is `close`
Returns : LEI value (0-100) or `na` if insufficient data (first 50 bars)
leiValue = LEI.lei()
leiValue = LEI.lei(hlc3) // custom source
`leiDetailed(src)` → tuple
Returns LEI with all component values for detailed analysis.
= LEI.leiDetailed()
Returns:
`lei` - Final LEI value (0-100)
`extension` - Distance from VWAP in ATR units
`velocity` - 5-bar price change in ATR units
`volumeZ` - Volume Z-Score
`volumeModifier` - Applied modifier (1.0 = neutral)
`vwap` - VWAP value used
Component Functions
| Function | Description | Returns |
|-----------------------------------|---------------------------------|---------------|
| `calcExtension(src, vwap)` | Distance from VWAP / ATR | float |
| `calcVelocity(src)` | 5-bar price change / ATR | float |
| `calcVolumeZ()` | Volume Z-Score | float |
| `calcVolumeModifier(volZ)` | Volume modifier | float (≥1.0) |
| `getVWAP()` | Auto-detects asset type | float |
Signal Functions
| Function | Description | Returns |
|---------------------------------------------|----------------------------------|-----------|
| `isExhausted(lei, threshold)` | LEI ≥ threshold (default 70) | bool |
| `isSafe(lei, threshold)` | LEI ≤ threshold (default 30) | bool |
| `crossedExhaustion(lei, threshold)` | Crossed into exhaustion | bool |
| `crossedSafe(lei, threshold)` | Crossed into safe zone | bool |
Utility Functions
| Function | Description | Returns |
|----------------------------|-------------------------|-----------|
| `getZone(lei)` | Zone name | string |
| `getColor(lei)` | Recommended color | color |
| `hasEnoughHistory()` | Data check | bool |
| `minBarsRequired()` | Required bars | int (50) |
| `version()` | Library version | string |
Interpretation Guide
| LEI Range | Zone | Meaning |
|-------------|--------------|--------------------------------------------------|
| 0-30 | Safe | Low exhaustion, move may continue |
| 30-50 | Caution | Moderate exhaustion |
| 50-70 | Warning | Elevated exhaustion |
| 70-100 | Exhaustion | High exhaustion, increased reversal risk |
Example: Basic Usage
//@version=6
indicator("LEI Example", overlay=false)
import OrenLuxy/LuxyEnergyIndex/1 as LEI
// Get LEI value
leiValue = LEI.lei()
// Plot with dynamic color
plot(leiValue, "LEI", LEI.getColor(leiValue), 2)
// Reference lines
hline(70, "High", color.red)
hline(30, "Low", color.green)
// Alert on exhaustion
if LEI.crossedExhaustion(leiValue) and barstate.isconfirmed
alert("LEI crossed into exhaustion zone")
Technical Details
Fixed Parameters (by design):
Velocity Period: 5 bars
Volume Period: 20 bars
Z-Score Period: 50 bars
ATR Period: 14
Extension/Velocity Weights: 50/50
Asset Support:
Stocks/Forex: Uses Session VWAP (daily reset)
Crypto: Uses Rolling VWAP (50-bar window) - auto-detected
Edge Cases:
Returns `na` until 50 bars of history
Zero volume: Volume modifier defaults to 1.0 (neutral)
Credits and Acknowledgments
This library builds upon established technical analysis concepts:
VWAP - Industry standard volume-weighted price measure
ATR by J. Welles Wilder Jr. (1978) - Volatility normalization
Z-Score - Statistical normalization method
Volume analysis principles from Volume Spread Analysis (VSA) methodology
Disclaimer
This library is provided for **educational and informational purposes only**. It does not constitute financial advice. Past performance does not guarantee future results. The exhaustion readings are probabilistic indicators, not guarantees of price reversal. Always conduct your own research and use proper risk management when trading.

Mirpapa_Lib_StructLibrary "Mirpapa_Lib_Struct"
ICT 구조 변화 감지 라이브러리 (BOS, CHoCH, MSS, Sweep)
initStructState()
StructState 초기화
checkBOS(_trend, _currentClose, _lastHHPrice, _lastLLPrice)
BOS 체크 (추세 지속) - 종가 기준
Parameters:
_trend (string) : 현재 추세
_currentClose (float) : 현재 종가
_lastHHPrice (float) : 마지막 HH 가격
_lastLLPrice (float) : 마지막 LL 가격
Returns:
checkCHoCH(_trend, _currentClose, _lastHHPrice, _lastLLPrice)
CHoCH 체크 (추세 전환) - 종가 기준
Parameters:
_trend (string) : 현재 추세
_currentClose (float) : 현재 종가
_lastHHPrice (float) : 마지막 HH 가격
_lastLLPrice (float) : 마지막 LL 가격
Returns:
checkSweep(_currentHigh, _currentLow, _currentClose, _lastHHPrice, _lastLLPrice)
Sweep 체크 (유동성 수집) 설명
Parameters:
_currentHigh (float) : 현재 고가
_currentLow (float) : 현재 저가
_currentClose (float) : 현재 종가
_lastHHPrice (float) : 마지막 HH 가격
_lastLLPrice (float) : 마지막 LL 가격
Returns:
checkMSS(_hadCHoCH, _chochDir, _currentHigh, _currentLow, _chochPrice)
MSS 체크 (CHoCH + 리테스트 확인)
Parameters:
_hadCHoCH (bool) : CHoCH 발생 여부
_chochDir (string) : CHoCH 방향
_currentHigh (float) : 현재 고가
_currentLow (float) : 현재 저가
_chochPrice (float) : CHoCH 발생 가격
Returns:
drawStructLabel(_price, _time, _type, _dir, _lblColor)
구조 변화 라벨 그리기
Parameters:
_price (float) : 가격
_time (int) : 시간
_type (string) : 구조 타입
_dir (string) : 방향
_lblColor (color) : 라벨 색상
drawStructLine(_price, _startTime, _endTime, _lineColor, _lineWidth)
구조 변화 라인 그리기
Parameters:
_price (float) : 가격
_startTime (int) : 시작 시간
_endTime (int) : 끝 시간
_lineColor (color) : 라인 색상
_lineWidth (int) : 라인 두께
StructType
구조 타입 상수
Fields:
BOS (series string)
CHOCH (series string)
MSS (series string)
SWEEP (series string)
TrendDir
추세 방향 상수
Fields:
UP (series string)
DOWN (series string)
NONE (series string)
StructState
구조 변화 상태
Fields:
_trend (series string) : 현재 추세 방향
_lastHHPrice (series float) : 마지막 HH 가격
_lastHHTime (series int) : 마지막 HH 시간
_lastLLPrice (series float) : 마지막 LL 가격
_lastLLTime (series int) : 마지막 LL 시간
_peakHHPrice (series float) : 최고 HH 가격 (BOS 레벨용)
_peakHHTime (series int) : 최고 HH 시간
_peakLLPrice (series float) : 최저 LL 가격 (BOS 레벨용)
_peakLLTime (series int) : 최저 LL 시간
_bosLevelHH (series float) : BOS 체크용 HH 레벨 (확정된 최고 HH)
_bosLevelHHTime (series int) : BOS 체크용 HH 시간
_bosLevelLL (series float) : BOS 체크용 LL 레벨 (확정된 최저 LL)
_bosLevelLLTime (series int) : BOS 체크용 LL 시간

KernelFunctionsLibrary "KernelFunctions"
This library provides non-repainting kernel functions for Nadaraya-Watson estimator implementations. This allows for easy substition/comparison of different kernel functions for one another in indicators. Furthermore, kernels can easily be combined with other kernels to create newer, more customized kernels.
rationalQuadratic(_src, _lookback, _relativeWeight, startAtBar)
Rational Quadratic Kernel - An infinite sum of Gaussian Kernels of different length scales.
Parameters:
_src (float) : The source series.
_lookback (simple int) : The number of bars used for the estimation. This is a sliding value that represents the most recent historical bars.
_relativeWeight (simple float) : Relative weighting of time frames. Smaller values resut in a more stretched out curve and larger values will result in a more wiggly curve. As this value approaches zero, the longer time frames will exert more influence on the estimation. As this value approaches infinity, the behavior of the Rational Quadratic Kernel will become identical to the Gaussian kernel.
startAtBar (simple int)
Returns: yhat The estimated values according to the Rational Quadratic Kernel.
gaussian(_src, _lookback, startAtBar)
Gaussian Kernel - A weighted average of the source series. The weights are determined by the Radial Basis Function (RBF).
Parameters:
_src (float) : The source series.
_lookback (simple int) : The number of bars used for the estimation. This is a sliding value that represents the most recent historical bars.
startAtBar (simple int)
Returns: yhat The estimated values according to the Gaussian Kernel.
periodic(_src, _lookback, _period, startAtBar)
Periodic Kernel - The periodic kernel (derived by David Mackay) allows one to model functions which repeat themselves exactly.
Parameters:
_src (float) : The source series.
_lookback (simple int) : The number of bars used for the estimation. This is a sliding value that represents the most recent historical bars.
_period (simple int) : The distance between repititions of the function.
startAtBar (simple int)
Returns: yhat The estimated values according to the Periodic Kernel.
locallyPeriodic(_src, _lookback, _period, startAtBar)
Locally Periodic Kernel - The locally periodic kernel is a periodic function that slowly varies with time. It is the product of the Periodic Kernel and the Gaussian Kernel.
Parameters:
_src (float) : The source series.
_lookback (simple int) : The number of bars used for the estimation. This is a sliding value that represents the most recent historical bars.
_period (simple int) : The distance between repititions of the function.
startAtBar (simple int)
Returns: yhat The estimated values according to the Locally Periodic Kernel.

MLExtensionsLibrary "MLExtensions"
A set of extension methods for a novel implementation of a Approximate Nearest Neighbors (ANN) algorithm in Lorentzian space.
normalizeDeriv(src, quadraticMeanLength)
Returns the smoothed hyperbolic tangent of the input series.
Parameters:
src (float) : The input series (i.e., the first-order derivative for price).
quadraticMeanLength (int) : The length of the quadratic mean (RMS).
Returns: nDeriv The normalized derivative of the input series.
normalize(src, min, max)
Rescales a source value with an unbounded range to a target range.
Parameters:
src (float) : The input series
min (float) : The minimum value of the unbounded range
max (float) : The maximum value of the unbounded range
Returns: The normalized series
rescale(src, oldMin, oldMax, newMin, newMax)
Rescales a source value with a bounded range to anther bounded range
Parameters:
src (float) : The input series
oldMin (float) : The minimum value of the range to rescale from
oldMax (float) : The maximum value of the range to rescale from
newMin (float) : The minimum value of the range to rescale to
newMax (float) : The maximum value of the range to rescale to
Returns: The rescaled series
getColorShades(color)
Creates an array of colors with varying shades of the input color
Parameters:
color (color) : The color to create shades of
Returns: An array of colors with varying shades of the input color
getPredictionColor(prediction, neighborsCount, shadesArr)
Determines the color shade based on prediction percentile
Parameters:
prediction (float) : Value of the prediction
neighborsCount (int) : The number of neighbors used in a nearest neighbors classification
shadesArr (array) : An array of colors with varying shades of the input color
Returns: shade Color shade based on prediction percentile
color_green(prediction)
Assigns varying shades of the color green based on the KNN classification
Parameters:
prediction (float) : Value (int|float) of the prediction
Returns: color
color_red(prediction)
Assigns varying shades of the color red based on the KNN classification
Parameters:
prediction (float) : Value of the prediction
Returns: color
tanh(src)
Returns the the hyperbolic tangent of the input series. The sigmoid-like hyperbolic tangent function is used to compress the input to a value between -1 and 1.
Parameters:
src (float) : The input series (i.e., the normalized derivative).
Returns: tanh The hyperbolic tangent of the input series.
dualPoleFilter(src, lookback)
Returns the smoothed hyperbolic tangent of the input series.
Parameters:
src (float) : The input series (i.e., the hyperbolic tangent).
lookback (int) : The lookback window for the smoothing.
Returns: filter The smoothed hyperbolic tangent of the input series.
tanhTransform(src, smoothingFrequency, quadraticMeanLength)
Returns the tanh transform of the input series.
Parameters:
src (float) : The input series (i.e., the result of the tanh calculation).
smoothingFrequency (int)
quadraticMeanLength (int)
Returns: signal The smoothed hyperbolic tangent transform of the input series.
n_rsi(src, n1, n2)
Returns the normalized RSI ideal for use in ML algorithms.
Parameters:
src (float) : The input series (i.e., the result of the RSI calculation).
n1 (simple int) : The length of the RSI.
n2 (simple int) : The smoothing length of the RSI.
Returns: signal The normalized RSI.
n_cci(src, n1, n2)
Returns the normalized CCI ideal for use in ML algorithms.
Parameters:
src (float) : The input series (i.e., the result of the CCI calculation).
n1 (simple int) : The length of the CCI.
n2 (simple int) : The smoothing length of the CCI.
Returns: signal The normalized CCI.
n_wt(src, n1, n2)
Returns the normalized WaveTrend Classic series ideal for use in ML algorithms.
Parameters:
src (float) : The input series (i.e., the result of the WaveTrend Classic calculation).
n1 (simple int)
n2 (simple int)
Returns: signal The normalized WaveTrend Classic series.
n_adx(highSrc, lowSrc, closeSrc, n1)
Returns the normalized ADX ideal for use in ML algorithms.
Parameters:
highSrc (float) : The input series for the high price.
lowSrc (float) : The input series for the low price.
closeSrc (float) : The input series for the close price.
n1 (simple int) : The length of the ADX.
regime_filter(src, threshold, useRegimeFilter)
Parameters:
src (float)
threshold (float)
useRegimeFilter (bool)
filter_adx(src, length, adxThreshold, useAdxFilter)
filter_adx
Parameters:
src (float) : The source series.
length (simple int) : The length of the ADX.
adxThreshold (int) : The ADX threshold.
useAdxFilter (bool) : Whether to use the ADX filter.
Returns: The ADX.
filter_volatility(minLength, maxLength, useVolatilityFilter)
filter_volatility
Parameters:
minLength (simple int) : The minimum length of the ATR.
maxLength (simple int) : The maximum length of the ATR.
useVolatilityFilter (bool) : Whether to use the volatility filter.
Returns: Boolean indicating whether or not to let the signal pass through the filter.
backtest(high, low, open, startLongTrade, endLongTrade, startShortTrade, endShortTrade, isEarlySignalFlip, maxBarsBackIndex, thisBarIndex, src, useWorstCase)
Performs a basic backtest using the specified parameters and conditions.
Parameters:
high (float) : The input series for the high price.
low (float) : The input series for the low price.
open (float) : The input series for the open price.
startLongTrade (bool) : The series of conditions that indicate the start of a long trade.
endLongTrade (bool) : The series of conditions that indicate the end of a long trade.
startShortTrade (bool) : The series of conditions that indicate the start of a short trade.
endShortTrade (bool) : The series of conditions that indicate the end of a short trade.
isEarlySignalFlip (bool) : Whether or not the signal flip is early.
maxBarsBackIndex (int) : The maximum number of bars to go back in the backtest.
thisBarIndex (int) : The current bar index.
src (float) : The source series.
useWorstCase (bool) : Whether to use the worst case scenario for the backtest.
Returns: A tuple containing backtest values
init_table()
init_table()
Returns: tbl The backtest results.
update_table(tbl, tradeStatsHeader, totalTrades, totalWins, totalLosses, winLossRatio, winrate, earlySignalFlips)
update_table(tbl, tradeStats)
Parameters:
tbl (table) : The backtest results table.
tradeStatsHeader (string) : The trade stats header.
totalTrades (float) : The total number of trades.
totalWins (float) : The total number of wins.
totalLosses (float) : The total number of losses.
winLossRatio (float) : The win loss ratio.
winrate (float) : The winrate.
earlySignalFlips (float) : The total number of early signal flips.
Returns: Updated backtest results table.

Mirpapa_Lib_UnicornLibrary "Mirpapa_Lib_Unicorn"
유니콘 패턴 라이브러리 (Unicorn Pattern Library)
유니콘 모델 전략 로직, 데이터 구조체 및 상태 관리를 구현합니다.
initUnicornData(_isBull, _createTime, _createBar, _timeframe)
UnicornData 초기화
@description 새로운 UnicornData 객체를 생성하고 초기화합니다.
Parameters:
_isBull (bool) : 방향 (True: 상승, False: 하락)
_createTime (int) : 생성 시간
_createBar (int) : 생성 Bar Index
_timeframe (string) : 시간대
calculateOverlap(_obTop, _obBot, _fvgTop, _fvgBot)
중첩 영역(Overlap Zone) 계산
@description OB와 FVG 사이의 겹치는 영역을 계산합니다.
Parameters:
_obTop (float) : OB 상단
_obBot (float) : OB 하단
_fvgTop (float) : FVG 상단
_fvgBot (float) : FVG 하단
Returns: 겹침 영역 상단, 하단, 겹침 여부
updateUnicornStatus(_data, _currentHigh, _currentLow, _time)
유니콘 상태 업데이트
@description 가격 움직임에 따라 유니콘 패턴의 상태를 업데이트합니다.
active: 진입 대기 (리테스트 대기) -> triggered: 진입 (TP/SL 대기) -> win/loss: 결과 확정
Parameters:
_data (UnicornData) : UnicornData 객체
_currentHigh (float) : 현재 고가
_currentLow (float) : 현재 저가
_time (int) : 현재 시간
Returns: UnicornData 업데이트된 객체
activateUnicorn(_data)
유니콘 활성화 (Active 전환)
@description Pending 상태인 유니콘 데이터를 Active 상태로 전환합니다. (보통 CHoCH 발생 시 호출)
Parameters:
_data (UnicornData) : UnicornData 객체
setTradeLevels(_data, _entry, _stop, _target)
트레이딩 레벨 설정
@description 진입가, 목표가, 손절가를 설정합니다.
Parameters:
_data (UnicornData) : UnicornData 객체
_entry (float) : 진입가
_stop (float) : 손절가
_target (float) : 목표가
UnicornData
유니콘 데이터 (UnicornData)
Fields:
_isBull (series bool) : // 상승/하락 방향 (True: Long, False: Short)
_status (series string) : // "pending", "active", "triggered", "win", "loss", "cancelled"
_createTime (series int) : // 생성 시간
_createBar (series int) : // 생성 bar_index
_obTop (series float) : // OB 상단
_obBot (series float) : // OB 하단
_obTime (series int) : // OB 캔들 시간
_obBox (series box) : // OB 박스 객체
_fvgTop (series float) : // FVG 상단
_fvgBot (series float) : // FVG 하단
_fvgTime (series int) : // FVG 시간
_fvgBox (series box) : // FVG 박스 객체
_zoneTop (series float) : // 겹침 영역 상단 (Unicorn Zone)
_zoneBot (series float) : // 겹침 영역 하단 (Unicorn Zone)
_zoneBox (series box) : // Unicorn Zone 박스 객체
_chochConfirmed (series bool) : // CHoCH 확정 여부
_chochTime (series int) : // CHoCH 발생 시간
_chochPrice (series float) : // CHoCH 돌파 가격
_entryPrice (series float) : // 진입가
_targetPrice (series float) : // 목표가 (다음 유동성 레벨)
_stopPrice (series float) : // 손절가 (Zone 반대편)
_result (series string) : // "none", "win", "loss"
_resultTime (series int) : // 결과 확정 시간
_resultPrice (series float) : // 결과 확정 가격
_profitPips (series float) : // 수익 pips (양수)
_lossPips (series float) : // 손실 pips (음수)
_profitPercent (series float) : // 수익 %
_lossPercent (series float) : // 손실 %
_rrRatio (series float) : // Risk:Reward 비율
_timeframe (series string) : // 시간대 (HTF/MTF/CTF)
_triggerTime (series int) : // 진입 트리거 시간 (리테스트)
_triggerPrice (series float) : // 진입 트리거 가격
_isRetested (series bool) : // 리테스트 여부
_retestCount (series int) : // 리테스트 횟수
_maxDrawdown (series float) : // 최대 손실폭 (진입 후)
_maxProfit (series float) : // 최대 수익폭 (진입 후)

machine_learningLibrary "machine_learning"
euclidean(a, b)
Parameters:
a (array)
b (array)
manhattan(a, b)
Parameters:
a (array)
b (array)
cosine_similarity(a, b)
Parameters:
a (array)
b (array)
cosine_distance(a, b)
Parameters:
a (array)
b (array)
chebyshev(a, b)
Parameters:
a (array)
b (array)
minkowski(a, b, p)
Parameters:
a (array)
b (array)
p (float)
dot_product(a, b)
Parameters:
a (array)
b (array)
vector_norm(arr, p)
Parameters:
arr (array)
p (float)
sigmoid(x)
Parameters:
x (float)
sigmoid_derivative(x)
Parameters:
x (float)
tanh_derivative(x)
Parameters:
x (float)
relu(x)
Parameters:
x (float)
relu_derivative(x)
Parameters:
x (float)
leaky_relu(x, alpha)
Parameters:
x (float)
alpha (float)
leaky_relu_derivative(x, alpha)
Parameters:
x (float)
alpha (float)
elu(x, alpha)
Parameters:
x (float)
alpha (float)
gelu(x)
Parameters:
x (float)
swish(x, beta)
Parameters:
x (float)
beta (float)
softmax(arr)
Parameters:
arr (array)
apply_activation(arr, activation_type, alpha)
Parameters:
arr (array)
activation_type (string)
alpha (float)
normalize_minmax(arr, min_val, max_val)
Parameters:
arr (array)
min_val (float)
max_val (float)
normalize_zscore(arr, mean_val, std_val)
Parameters:
arr (array)
mean_val (float)
std_val (float)
normalize_matrix_cols(m)
Parameters:
m (matrix)
scaler_fit(arr, method)
Parameters:
arr (array)
method (string)
scaler_fit_matrix(m, method)
Parameters:
m (matrix)
method (string)
scaler_transform(scaler, arr)
Parameters:
scaler (ml_scaler)
arr (array)
scaler_transform_matrix(scaler, m)
Parameters:
scaler (ml_scaler)
m (matrix)
clip(x, lo, hi)
Parameters:
x (float)
lo (float)
hi (float)
clip_array(arr, lo, hi)
Parameters:
arr (array)
lo (float)
hi (float)
loss_mse(predicted, actual)
Parameters:
predicted (array)
actual (array)
loss_rmse(predicted, actual)
Parameters:
predicted (array)
actual (array)
loss_mae(predicted, actual)
Parameters:
predicted (array)
actual (array)
loss_binary_crossentropy(predicted, actual)
Parameters:
predicted (array)
actual (array)
loss_huber(predicted, actual, delta)
Parameters:
predicted (array)
actual (array)
delta (float)
gradient_step(weights, gradients, lr)
Parameters:
weights (array)
gradients (array)
lr (float)
adam_step(weights, gradients, m, v, lr, beta1, beta2, t, epsilon)
Parameters:
weights (array)
gradients (array)
m (array)
v (array)
lr (float)
beta1 (float)
beta2 (float)
t (int)
epsilon (float)
clip_gradients(gradients, max_norm)
Parameters:
gradients (array)
max_norm (float)
lr_decay(initial_lr, decay_rate, step)
Parameters:
initial_lr (float)
decay_rate (float)
step (int)
lr_cosine_annealing(initial_lr, min_lr, step, total_steps)
Parameters:
initial_lr (float)
min_lr (float)
step (int)
total_steps (int)
knn_create(k, distance_type)
Parameters:
k (int)
distance_type (string)
knn_fit(model, X, y)
Parameters:
model (ml_knn)
X (matrix)
y (array)
knn_predict(model, x)
Parameters:
model (ml_knn)
x (array)
knn_predict_proba(model, x)
Parameters:
model (ml_knn)
x (array)
knn_batch_predict(model, X)
Parameters:
model (ml_knn)
X (matrix)
linreg_fit(X, y)
Parameters:
X (matrix)
y (array)
ridge_fit(X, y, lambda)
Parameters:
X (matrix)
y (array)
lambda (float)
linreg_predict(model, x)
Parameters:
model (ml_linreg)
x (array)
linreg_predict_batch(model, X)
Parameters:
model (ml_linreg)
X (matrix)
linreg_score(model, X, y)
Parameters:
model (ml_linreg)
X (matrix)
y (array)
logreg_create(n_features, learning_rate, iterations)
Parameters:
n_features (int)
learning_rate (float)
iterations (int)
logreg_fit(model, X, y)
Parameters:
model (ml_logreg)
X (matrix)
y (array)
logreg_predict_proba(model, x)
Parameters:
model (ml_logreg)
x (array)
logreg_predict(model, x, threshold)
Parameters:
model (ml_logreg)
x (array)
threshold (float)
logreg_batch_predict(model, X, threshold)
Parameters:
model (ml_logreg)
X (matrix)
threshold (float)
nb_create(n_classes)
Parameters:
n_classes (int)
nb_fit(model, X, y)
Parameters:
model (ml_nb)
X (matrix)
y (array)
nb_predict_proba(model, x)
Parameters:
model (ml_nb)
x (array)
nb_predict(model, x)
Parameters:
model (ml_nb)
x (array)
nn_create(layers, activation)
Parameters:
layers (array)
activation (string)
nn_forward(model, x)
Parameters:
model (ml_nn)
x (array)
nn_predict_class(model, x)
Parameters:
model (ml_nn)
x (array)
accuracy(y_true, y_pred)
Parameters:
y_true (array)
y_pred (array)
precision(y_true, y_pred, positive_class)
Parameters:
y_true (array)
y_pred (array)
positive_class (int)
recall(y_true, y_pred, positive_class)
Parameters:
y_true (array)
y_pred (array)
positive_class (int)
f1_score(y_true, y_pred, positive_class)
Parameters:
y_true (array)
y_pred (array)
positive_class (int)
r_squared(y_true, y_pred)
Parameters:
y_true (array)
y_pred (array)
mse(y_true, y_pred)
Parameters:
y_true (array)
y_pred (array)
rmse(y_true, y_pred)
Parameters:
y_true (array)
y_pred (array)
mae(y_true, y_pred)
Parameters:
y_true (array)
y_pred (array)
confusion_matrix(y_true, y_pred, n_classes)
Parameters:
y_true (array)
y_pred (array)
n_classes (int)
sliding_window(data, window_size)
Parameters:
data (array)
window_size (int)
train_test_split(X, y, test_ratio)
Parameters:
X (matrix)
y (array)
test_ratio (float)
create_binary_labels(data, threshold)
Parameters:
data (array)
threshold (float)
lag_matrix(data, n_lags)
Parameters:
data (array)
n_lags (int)
signal_to_position(prediction, threshold_long, threshold_short)
Parameters:
prediction (float)
threshold_long (float)
threshold_short (float)
confidence_sizing(probability, max_size, min_confidence)
Parameters:
probability (float)
max_size (float)
min_confidence (float)
kelly_sizing(win_rate, avg_win, avg_loss, max_fraction)
Parameters:
win_rate (float)
avg_win (float)
avg_loss (float)
max_fraction (float)
sharpe_ratio(returns, risk_free_rate)
Parameters:
returns (array)
risk_free_rate (float)
sortino_ratio(returns, risk_free_rate)
Parameters:
returns (array)
risk_free_rate (float)
max_drawdown(equity)
Parameters:
equity (array)
atr_stop_loss(entry_price, atr, multiplier, is_long)
Parameters:
entry_price (float)
atr (float)
multiplier (float)
is_long (bool)
risk_reward_take_profit(entry_price, stop_loss, ratio)
Parameters:
entry_price (float)
stop_loss (float)
ratio (float)
ensemble_vote(predictions)
Parameters:
predictions (array)
ensemble_weighted_average(predictions, weights)
Parameters:
predictions (array)
weights (array)
smooth_prediction(current, previous, alpha)
Parameters:
current (float)
previous (float)
alpha (float)
regime_classifier(volatility, trend_strength, vol_threshold, trend_threshold)
Parameters:
volatility (float)
trend_strength (float)
vol_threshold (float)
trend_threshold (float)
ml_knn
Fields:
k (series int)
distance_type (series string)
X_train (matrix)
y_train (array)
ml_linreg
Fields:
coefficients (array)
intercept (series float)
lambda (series float)
ml_logreg
Fields:
weights (array)
bias (series float)
learning_rate (series float)
iterations (series int)
ml_nn
Fields:
layers (array)
weights (matrix)
biases (array)
weight_offsets (array)
bias_offsets (array)
activation (series string)
ml_nb
Fields:
class_priors (array)
means (matrix)
variances (matrix)
n_classes (series int)
ml_scaler
Fields:
min_vals (array)
max_vals (array)
means (array)
stds (array)
method (series string)
ml_train_result
Fields:
loss_history (array)
final_loss (series float)
converged (series bool)
iterations_run (series int)
ml_prediction
Fields:
class_label (series int)
probability (series float)
probabilities (array)
value (series float)

Mirpapa_Lib_StructsLibrary "Mirpapa_Lib_Structs"
ICT 구조 변화 감지 라이브러리 (BOS, CHoCH, MSS, Sweep)
initStructState()
StructState 초기화
checkBOS(_trend, _currentClose, _lastHHPrice, _lastLLPrice)
BOS 체크 (추세 지속) - 종가 기준
Parameters:
_trend (string) : 현재 추세
_currentClose (float) : 현재 종가
_lastHHPrice (float) : 마지막 HH 가격
_lastLLPrice (float) : 마지막 LL 가격
Returns:
checkCHoCH(_trend, _currentClose, _lastHHPrice, _lastLLPrice)
CHoCH 체크 (추세 전환) - 종가 기준
Parameters:
_trend (string) : 현재 추세
_currentClose (float) : 현재 종가
_lastHHPrice (float) : 마지막 HH 가격
_lastLLPrice (float) : 마지막 LL 가격
Returns:
checkSweep(_currentHigh, _currentLow, _currentClose, _lastHHPrice, _lastLLPrice)
Sweep 체크 (유동성 수집)
Parameters:
_currentHigh (float) : 현재 고가
_currentLow (float) : 현재 저가
_currentClose (float) : 현재 종가
_lastHHPrice (float) : 마지막 HH 가격
_lastLLPrice (float) : 마지막 LL 가격
Returns:
checkMSS(_hadCHoCH, _chochDir, _currentHigh, _currentLow, _chochPrice)
MSS 체크 (CHoCH + 리테스트 확인)
Parameters:
_hadCHoCH (bool) : CHoCH 발생 여부
_chochDir (string) : CHoCH 방향
_currentHigh (float) : 현재 고가
_currentLow (float) : 현재 저가
_chochPrice (float) : CHoCH 발생 가격
Returns:
drawStructLabel(_price, _time, _type, _dir, _lblColor)
구조 변화 라벨 그리기
Parameters:
_price (float) : 가격
_time (int) : 시간
_type (string) : 구조 타입
_dir (string) : 방향
_lblColor (color) : 라벨 색상
drawStructLine(_price, _startTime, _endTime, _lineColor, _lineWidth)
구조 변화 라인 그리기
Parameters:
_price (float) : 가격
_startTime (int) : 시작 시간
_endTime (int) : 끝 시간
_lineColor (color) : 라인 색상
_lineWidth (int) : 라인 두께
StructType
구조 타입 상수
Fields:
BOS (series string)
CHOCH (series string)
MSS (series string)
SWEEP (series string)
TrendDir
추세 방향 상수
Fields:
UP (series string)
DOWN (series string)
NONE (series string)
StructState
구조 변화 상태
Fields:
_trend (series string) : 현재 추세 방향
_lastHHPrice (series float) : 마지막 HH 가격
_lastHHTime (series int) : 마지막 HH 시간
_lastLLPrice (series float) : 마지막 LL 가격
_lastLLTime (series int) : 마지막 LL 시간

CEDEARDataLibrary "CEDEARData"
getUnderlying(cedearTicker)
Parameters:
cedearTicker (simple string)
getRatio(cedearTicker)
Parameters:
cedearTicker (simple string)
getCurrency(cedearTicker)
Parameters:
cedearTicker (simple string)
isValidCedear(cedearTicker)
Parameters:
cedearTicker (simple string)

ZigZagCoreZigZagCore
ZigZagCore is a generic ZigZag engine that works with any user-defined threshold (ATR-based, volatility-based, fixed ticks, etc.).
API
import ReflexSignals/ZigZagCore/ as zz
var zz.ZzState state = zz.zz_new()
float thr = ... // your threshold in price units
state := zz.zz_update(state, thr)
zz_update(state, thr)
Parameters:
state (ZzState)
thr (float)
ZzState
Fields:
dir (series int)
highSinceLow (series float)
lowSinceHigh (series float)
lastHighLevel (series float)
lastLowLevel (series float)
lastHighIndex (series int)
lastLowIndex (series int)
highSinceLowIndex (series int)
lowSinceHighIndex (series int)
isNewHigh (series bool)
isNewLow (series bool)
Directional State
dir = 1 → market is in an upswing
dir = -1 → market is in a downswing
dir = na → initial undecided state
Live Swing Tracking (Unconfirmed Leg)
Continuously updated swing extremes:
highSinceLow — highest price since the last confirmed low
lowSinceHigh — lowest price since the last confirmed high
Their corresponding bar indices
These fields describe the current active swing leg, which updates every bar until a pivot is confirmed.
Pivot Detection
A pivot confirms only when price moves beyond the prior swing extreme by more than threshold. When this occurs, the library sets:
isNewHigh = true (on the detection bar only) and updates lastHighLevel, lastHighIndex
isNewLow = true and updates lastLowLevel, lastLowIndex

Mirpapa_Lib_LineLibrary "Mirpapa_Lib_Line"
CreateLine(_breachMode, _isBull, _leftTime, _rightTime, _price, _lineColor, _lineWidth, _lineStyle, _text)
CreateLine
@description 라인 생성 (값 전달 방식 - 모든 좌표 직접 지정).\
호출자가 모든 좌표와 시간을 계산하여 전달.\
breachMode: "price"(고가/저가 돌파) 또는 "close"(종가 돌파).\
Parameters:
_breachMode (string) : 돌파 처리 방식: "price" 또는 "close"
_isBull (bool) : 상승(true) 또는 하락(false)
_leftTime (int) : 라인 시작 시간
_rightTime (int) : 라인 종료 시간
_price (float) : 라인 가격
_lineColor (color) : 라인 색상
_lineWidth (int) : 라인 두께
_lineStyle (string) : 라인 스타일 (line.style_solid, line.style_dashed 등)
_text (string) : 라인 텍스트
Returns: 성공 여부와 라인 데이터
ProcessLineDatas(_openLines, _closedLines, _closeCount, _colorClose, _currentBarIndex, _currentLow, _currentHigh, _currentTime)
ProcessLineDatas
@description 라인 확장 및 돌파 처리.\
열린 라인들을 현재 bar까지 확장하고, 돌파 조건 체크.\
_closeCount: 돌파 횟수 (이 횟수만큼 돌파 시 라인 종료).\
breachMode에 따라 돌파 체크 방식 다름 (price/close).\
종료된 라인은 _closedLines로 이동하고 _colorClose 색상 적용.\
barstate.islast와 barstate.isconfirmed에서 호출 권장.
Parameters:
_openLines (array) : 열린 라인 배열
_closedLines (array) : 닫힌 라인 배열
_closeCount (int) : 돌파 카운트 (이 횟수만큼 돌파 시 종료)
_colorClose (color) : 종료된 라인 색상
_currentBarIndex (int) : 현재 bar_index
_currentLow (float) : 현재 low
_currentHigh (float) : 현재 high
_currentTime (int) : 현재 time
Returns: bool 항상 true
BreachMode
BreachMode
Fields:
PRICE (series string)
CLOSE (series string)
LineData
LineData
Fields:
_breachMode (series string) : 돌파 처리 방식
_isBull (series bool) : 상승(true) 또는 하락(false) 방향
_line (series line) : 라인 객체
_price (series float) : 라인 가격
_text (series string) : 라인 텍스트
_breached (series bool) : 돌파 여부
_breakCount (series int) : 돌파 카운트

M20M60_win10_libLibrary "M20M60_win10_lib"
f_m20m60_win10_features(srcOpen, srcHigh, srcLow, srcClose, bandCenter, bandWidth)
Parameters:
srcOpen (float)
srcHigh (float)
srcLow (float)
srcClose (float)
bandCenter (float)
bandWidth (float)
f_m20m60_win10_is_cluster5(bodyMean, rangeMean, cBandDiff, insideRatio, maxAbove)
Parameters:
bodyMean (float)
rangeMean (float)
cBandDiff (float)
insideRatio (float)
maxAbove (float)
f_m20m60_win10_is_cluster1(bodyMean, rangeMean, cBandDiff, insideRatio, maxAbove)
Parameters:
bodyMean (float)
rangeMean (float)
cBandDiff (float)
insideRatio (float)
maxAbove (float)
LibBarLibBar is a lightweight and practical Pine Script library designed to simplify candlestick analysis.
It provides a set of helper functions for identifying candle type, measuring body and wick sizes, and evaluating candle structure.
Perfect for building indicators, pattern detectors, or any script that relies on detailed bar-level analysis.
Available Functions
isBull(index) - Returns true if the bar is bullish.
isBear(index) - Returns true if the bar is bearish.
getBody(index) - Returns the candle’s body size.
getUpperWick(index) - Returns the size of the upper wick.
getLowerWick(index) - Returns the size of the lower wick.
getSize(index) - Returns the total candle size (high − low).
getBodyPercentage(index) - Returns the body size as a percentage of total candle size.
getUpperWickPercentage(index) - Returns the upper wick size as a percentage of the candle.
getLowerWickPercentage(index) - Returns the lower wick size as a percentage of the candle.

Mirpapa_Lib_HTFLibrary "Mirpapa_Lib_HTF"
High Time Frame Handler Library:
Provides utilities for working with High Time Frame (HTF) and chart (LTF) conversions and data retrieval.
IsChartTFcomparisonHTF(_chartTf, _htfTf)
IsChartTFcomparisonHTF
@description
Determine whether the given High Time Frame (HTF) is greater than or equal to the current chart timeframe.
Parameters:
_chartTf (string) : The current chart’s timeframe string (examples: "5", "15", "1D").
_htfTf (string) : The High Time Frame string to compare (examples: "60", "1D").
@return
Returns true if HTF minutes ≥ chart minutes, false otherwise or na if conversion fails.
GetHTFrevised(_tf)
GetHTFrevised
@description
Retrieve a specific bar value from a Higher Time Frame (HTF) series.
Supports current and historical OHLC values, based on a case identifier.
Parameters:
_tf (string) : The target HTF string (examples: "60", "1D").
GetHTFrevised(_tf, _case)
Parameters:
_tf (string)
_case (string)
GetHTFfromLabel(_label)
GetHTFfromLabel
@description
Convert a Korean HTF label into a Pine Script-recognizable timeframe string.
Examples:
"5분" → "5"
"1시간" → "60"
"일봉" → "1D"
"주봉" → "1W"
"월봉" → "1M"
"연봉" → "12M"
Parameters:
_label (string) : The Korean HTF label string (examples: "5분", "1시간", "일봉").
@return
Returns the Pine Script timeframe string corresponding to the label, or "1W" if no match is found.
GetHTFoffsetToLTFoffset(_offset, _chartTf, _htfTf)
GetHTFoffsetToLTFoffset
@description
Adjust an HTF bar index and offset so that it aligns with the current chart’s bar index.
Useful for retrieving historical HTF data on an LTF chart.
Parameters:
_offset (int) : The HTF bar offset (0 means current HTF bar, 1 means one bar ago, etc.).
_chartTf (string) : The current chart’s timeframe string (examples: "5", "15", "1D").
_htfTf (string) : The High Time Frame string to align (examples: "60", "1D").
@return
Returns the corresponding LTF bar index after applying HTF offset. If result is negative, returns 0.
UpdateHTFCache(_cache, _tf)
UpdateHTFCache
@description HTF 데이터 캐싱 (성능 최적화).\
HTF의 OHLC 데이터를 캐싱하여 매 틱마다 request.security 호출 방지.\
_cache: 기존 캐시 (없으면 na, 첫 호출 시).\
_tf: 캐싱할 시간대 (예: "60", "1D").\
새 bar 또는 bar_index 변경 시에만 업데이트, 그 외에는 기존 캐시 반환.\
Parameters:
_cache (HTFCache) : 기존 캐시 데이터 (없으면 na)
_tf (string) : 시간대
Returns: HTFCache 업데이트된 캐시 데이터
GetTimeframeSettings(_currentTF, _midTF1m, _highTF1m, _midTF5m, _highTF5m, _midTF15m, _highTF15m, _midTF30m, _highTF30m, _midTF60m, _highTF60m, _midTF240m, _highTF240m, _midTF1D, _highTF1D, _midTF1W, _highTF1W, _midTF1M, _highTF1M)
GetTimeframeSettings
@description 현재 차트 시간대에 맞는 중위/상위 시간대 자동 선택.\
_currentTF: 현재 차트 시간대 (timeframe.period).\
1분~1월 차트별로 적절한 중위/상위 시간대 매핑.\
예: 5분 차트 → 중위 15분, 상위 60분.\
반환: .\
Parameters:
_currentTF (string) : 현재 차트 시간대
_midTF1m (string)
_highTF1m (string)
_midTF5m (string)
_highTF5m (string)
_midTF15m (string)
_highTF15m (string)
_midTF30m (string)
_highTF30m (string)
_midTF60m (string)
_highTF60m (string)
_midTF240m (string)
_highTF240m (string)
_midTF1D (string)
_highTF1D (string)
_midTF1W (string)
_highTF1W (string)
_midTF1M (string)
_highTF1M (string)
Returns:
HTFCache
Fields:
_timeframe (series string)
_lastBarIndex (series int)
_isNewBar (series bool)
_barIndex (series int)
_open (series float)
_high (series float)
_low (series float)
_close (series float)
_open1 (series float)
_close1 (series float)
_high1 (series float)
_low1 (series float)
_open2 (series float)
_close2 (series float)
_high2 (series float)
_low2 (series float)
_high3 (series float)
_low3 (series float)
_time1 (series int)
_time2 (series int)

MirPapa_Lib_BoxLibrary "MirPapa_Lib_Box"
GetHTFrevised(_tf, _case)
GetHTFrevised
@description Retrieve a specific bar value from a Higher Time Frame (HTF) series.
Parameters:
_tf (string) : string The target HTF string (examples: "60", "1D").
_case (string) : string Case string determining which OHLC value to request.
@return float Returns the requested HTF value or na if _case does not match.
GetHTFrevised(_tf)
Parameters:
_tf (string)
GetHTFoffsetToLTFoffset(_offset, _chartTf, _htfTf)
GetHTFoffsetToLTFoffset
@description Adjust an HTF offset to an LTF offset by calculating the ratio of timeframes.
Parameters:
_offset (int) : int The HTF bar offset (0 means current HTF bar).
_chartTf (string) : string The current chart's timeframe (e.g., "5", "15", "1D").
_htfTf (string) : string The High Time Frame string (e.g., "60", "1D").
@return int The corresponding LTF bar index. Returns 0 if the result is negative.
GetHtfFromLabel(_label)
GetHtfFromLabel
@description Convert a Korean HTF label into a Pine Script timeframe string.
Parameters:
_label (string) : string The Korean label (e.g., "5분", "1시간").
@return string Returns the corresponding Pine Script timeframe (e.g., "5", "60").
IsChartTFcomparisonHTF(_chartTf, _htfTf)
IsChartTFcomparisonHTF
@description Determine whether a given HTF is greater than or equal to the current chart timeframe.
Parameters:
_chartTf (string) : string Current chart timeframe (e.g., "5", "15", "1D").
_htfTf (string) : string HTF timeframe (e.g., "60", "1D").
@return bool True if HTF ≥ chartTF, false otherwise.
IsCondition(_boxType, _isBull, _pricePrev, _priceNow)
IsCondition
@description FOB, FVG 조건 체크.\
_boxType: "fob"(Fair Order Block) 또는 "fvg"(Fair Value Gap).\
_isBull: true(상승 패턴), false(하락 패턴).\
상승 시 현재 가격이 이전 가격보다 높으면 true, 하락 시 이전 가격이 현재 가격보다 높으면 true 반환.
Parameters:
_boxType (string) : 박스 타입 ("fob", "fvg")
_isBull (bool) : 상승(true) 또는 하락(false)
_pricePrev (float) : 이전 가격
_priceNow (float) : 현재 가격
Returns: bool 조건 만족 여부
IsCondition(_boxType, _high2, _high1, _high0, _low2, _low1, _low0)
IsCondition
@description Sweep 조건 체크 (Swing High/Low 동시 발생).\
_boxType: "sweep" 또는 "breachBoth".\
조건: high2 < high1 > high0 (Swing High) AND low2 > low1 < low0 (Swing Low).\
중간 캔들이 양쪽보다 높고 낮은 지점을 동시에 형성할 때 true 반환.
Parameters:
_boxType (string) : 박스 타입 ("sweep", "breachBoth")
_high2 (float)
_high1 (float)
_high0 (float)
_low2 (float)
_low1 (float)
_low0 (float)
Returns: bool 조건 만족 여부
IsCondition(_boxType, _isBull, _open1, _close1, _high1, _low1, _open0, _close0, _low2, _low3, _high2, _high3)
IsCondition
@description RB (Rejection Block) 조건 체크.\
_boxType: "rb" (Rejection Block).\
상승 RB: candle1=음봉, candle0=양봉, low3>low1 AND low2>low1, close1*1.001>open0, open1close0.\
이전 캔들의 거부 후 현재 캔들이 반대 방향으로 전환될 때 true 반환.
Parameters:
_boxType (string) : 박스 타입 ("rb")
_isBull (bool) : 상승(true) 또는 하락(false)
_open1 (float)
_close1 (float)
_high1 (float)
_low1 (float)
_open0 (float)
_close0 (float)
_low2 (float)
_low3 (float)
_high2 (float)
_high3 (float)
Returns: bool 조건 만족 여부
IsCondition(_boxType, _isBull, _open2, _close1, _open1, _close0)
IsCondition
@description SOB (Strong Order Block) 조건 체크.\
_boxType: "sob" (Strong Order Block).\
상승 SOB: 양봉2 => 음봉1 => 양봉0, open2 > close1 AND open1 < close0.\
하락 SOB: 음봉2 => 양봉1 => 음봉0, open2 < close1 AND open1 > close0.\
3개 캔들 패턴으로 강한 주문 블록 형성 시 true 반환.
Parameters:
_boxType (string) : 박스 타입 ("sob")
_isBull (bool) : 상승(true) 또는 하락(false)
_open2 (float) : 2개 이전 캔들 open
_close1 (float) : 1개 이전 캔들 close
_open1 (float) : 1개 이전 캔들 open
_close0 (float) : 현재 캔들 close
Returns: bool 조건 만족 여부
CreateBox(_boxType, _tf, _isBull, _useLine, _colorBG, _colorBD, _colorText, _cache)
CreateBox
@description 박스 생성 (breachMode 자동 결정).\
_boxType: "fob", "rb", "custom" → directionalHighLow, 나머지 → both.\
_tf: 시간대 (timeframe.period 또는 HTF).\
_isBull: true(상승 박스), false(하락 박스).\
_cache: HTF 사용 시 필수, CurrentTF는 na.\
반환: .
Parameters:
_boxType (string) : 박스 타입
_tf (string) : 시간대
_isBull (bool) : 상승(true) 또는 하락(false)
_useLine (bool) : 중간선 표시 여부
_colorBG (color) : 박스 배경색
_colorBD (color) : 박스 테두리색
_colorText (color) : 텍스트 색상
_cache (HTFCache) : HTF 캐시 데이터
Returns: 성공 여부와 박스 데이터
CreateBox(_boxType, _tf, _isBull, _useLine, _colorBG, _colorBD, _colorText, _cache, _customText)
CreateBox
@description 박스 생성 (커스텀 텍스트 지원, breachMode 자동 결정).\
_boxType: "fob", "rb", "custom" → directionalHighLow, 나머지 → both.\
_customText: 박스에 표시할 텍스트 (비어있으면 "시간대 박스타입" 형식으로 자동 생성).\
_isBull: true(상승 박스), false(하락 박스).\
반환: .
Parameters:
_boxType (string) : 박스 타입
_tf (string) : 시간대
_isBull (bool) : 상승(true) 또는 하락(false)
_useLine (bool) : 중간선 표시 여부
_colorBG (color) : 박스 배경색
_colorBD (color) : 박스 테두리색
_colorText (color) : 텍스트 색상
_cache (HTFCache) : HTF 캐시 데이터
_customText (string) : 커스텀 텍스트
Returns: 성공 여부와 박스 데이터
CreateBox(_boxType, _breachMode, _tf, _isBull, _useLine, _colorBG, _colorBD, _colorText, _cache, _customText)
CreateBox
@description 박스 생성 (breachMode 명시적 지정).\
_breachMode: "both"(양쪽 모두 돌파), "directionalHighLow"(방향성 high/low 돌파), "directionalClose"(방향성 close 돌파).\
_isBull: true(상승 박스), false(하락 박스).\
_customText: 박스에 표시할 텍스트 (비어있으면 "시간대 박스타입" 형식으로 자동 생성).\
반환: .
Parameters:
_boxType (string) : 박스 타입 (fob, fvg, sweep, rb, custom 등)
_breachMode (string) : 돌파 처리 방식: "both" (양쪽 모두), "directionalHighLow" (방향성 high/low), "directionalClose" (방향성 close)
_tf (string) : 시간대
_isBull (bool) : 상승(true) 또는 하락(false) 방향
_useLine (bool) : 중간선 표시 여부
_colorBG (color) : 박스 배경색
_colorBD (color) : 박스 테두리색
_colorText (color) : 텍스트 색상
_cache (HTFCache) : HTF 캐시 데이터 (CurrentTF는 na)
_customText (string) : 커스텀 텍스트 (비어있으면 자동 생성)
Returns: 성공 여부와 박스 데이터
CreateCustomBox(_boxType, _breachMode, _isBull, _top, _bottom, _left, _right, _useLine, _colorBG, _colorBD, _colorText, _text)
CreateCustomBox
@description 완전히 유연한 커스텀 박스 생성.\
사용자가 박스 위치(top, bottom, left, right), breach mode, 모든 파라미터를 직접 지정.\
조건 체크는 사용자 스크립트에서 수행하고, 이 함수는 박스 생성만 담당.\
새로운 박스 타입 추가 시 라이브러리 수정 없이 사용 가능.
Parameters:
_boxType (string) : 박스 타입 (사용자 정의 문자열)
_breachMode (string) : 돌파 처리 방식: "both", "directionalHighLow", "directionalClose", "sobClose"
_isBull (bool) : 상승(true) 또는 하락(false) 방향
_top (float) : 박스 상단 가격
_bottom (float) : 박스 하단 가격
_left (int) : 박스 시작 시간 (xloc.bar_time 사용)
_right (int) : 박스 종료 시간 (xloc.bar_time 사용)
_useLine (bool) : 중간선 표시 여부
_colorBG (color) : 박스 배경색
_colorBD (color) : 박스 테두리색
_colorText (color) : 텍스트 색상
_text (string) : 박스에 표시할 텍스트
Returns: 성공 여부와 박스 데이터
ProcessBoxDatas(_openBoxes, _closedBoxes, _useMidLine, _closeCount, _colorClose, _currentBarIndex, _currentLow, _currentHigh, _currentTime)
ProcessBoxDatas
@description 박스 확장 및 돌파 처리.\
열린 박스들을 현재 bar까지 확장하고, 돌파 조건 체크.\
_closeCount: 돌파 횟수 (이 횟수만큼 돌파 시 박스 종료).\
breachMode에 따라 돌파 체크 방식 다름 (both/directionalHighLow/directionalClose).\
종료된 박스는 _closedBoxes로 이동하고 _colorClose 색상 적용.\
barstate.islast와 barstate.isconfirmed에서 호출 권장.
Parameters:
_openBoxes (array) : 열린 박스 배열
_closedBoxes (array) : 닫힌 박스 배열
_useMidLine (bool) : 중간선 표시 여부
_closeCount (int) : 돌파 카운트 (이 횟수만큼 돌파 시 종료)
_colorClose (color) : 종료된 박스 색상
_currentBarIndex (int) : 현재 bar_index
_currentLow (float) : 현재 low
_currentHigh (float) : 현재 high
_currentTime (int) : 현재 time
Returns: bool 항상 true
UpdateHTFCache(_cache, _tf)
UpdateHTFCache
@description HTF 데이터 캐싱 (성능 최적화).\
HTF의 OHLC 데이터를 캐싱하여 매 틱마다 request.security 호출 방지.\
_cache: 기존 캐시 (없으면 na, 첫 호출 시).\
_tf: 캐싱할 시간대 (예: "60", "1D").\
새 bar 또는 bar_index 변경 시에만 업데이트, 그 외에는 기존 캐시 반환.\
Parameters:
_cache (HTFCache) : 기존 캐시 데이터 (없으면 na)
_tf (string) : 시간대
Returns: HTFCache 업데이트된 캐시 데이터
GetTimeframeSettings(_currentTF, _midTF1m, _highTF1m, _midTF5m, _highTF5m, _midTF15m, _highTF15m, _midTF30m, _highTF30m, _midTF60m, _highTF60m, _midTF240m, _highTF240m, _midTF1D, _highTF1D, _midTF1W, _highTF1W, _midTF1M, _highTF1M)
GetTimeframeSettings
@description 현재 차트 시간대에 맞는 중위/상위 시간대 자동 선택.\
_currentTF: 현재 차트 시간대 (timeframe.period).\
1분~1월 차트별로 적절한 중위/상위 시간대 매핑.\
예: 5분 차트 → 중위 15분, 상위 60분.\
반환: .\
Parameters:
_currentTF (string) : 현재 차트 시간대
_midTF1m (string)
_highTF1m (string)
_midTF5m (string)
_highTF5m (string)
_midTF15m (string)
_highTF15m (string)
_midTF30m (string)
_highTF30m (string)
_midTF60m (string)
_highTF60m (string)
_midTF240m (string)
_highTF240m (string)
_midTF1D (string)
_highTF1D (string)
_midTF1W (string)
_highTF1W (string)
_midTF1M (string)
_highTF1M (string)
Returns:
BoxData
BoxData
Fields:
_type (series string) : 박스 타입 (fob, fvg, sweep, rb, custom 등)
_breachMode (series string) : 돌파 처리 방식
_isBull (series bool) : 상승(true) 또는 하락(false) 방향
_box (series box)
_line (series line)
_boxTop (series float)
_boxBot (series float)
_boxMid (series float)
_topBreached (series bool)
_bottomBreached (series bool)
_breakCount (series int)
_createdBar (series int)
HTFCache
Fields:
_timeframe (series string)
_lastBarIndex (series int)
_isNewBar (series bool)
_barIndex (series int)
_open (series float)
_high (series float)
_low (series float)
_close (series float)
_open1 (series float)
_close1 (series float)
_high1 (series float)
_low1 (series float)
_open2 (series float)
_close2 (series float)
_high2 (series float)
_low2 (series float)
_high3 (series float)
_low3 (series float)
_time1 (series int)
_time2 (series int)

tgpFibonacciLib_v2Library "tgpFibonacciLib_v2"
getFib(tf, ratio)
Parameters:
tf (string)
ratio (float)
getGoldenPocket(tf)
Parameters:
tf (string)
getMonthlyFib(ratio)
Parameters:
ratio (float)
getWeeklyFib(ratio)
Parameters:
ratio (float)
getYestFib(ratio)
Parameters:
ratio (float)

AssetCorrelationLibraryLibrary "AssetCorrelationLibrary™"
detectIndicesFutures(ticker)
Detects Index Futures (NQ/ES/YM/RTY + micro variants)
Parameters:
ticker (string) : The ticker string to check (typically syminfo.ticker)
Returns: AssetPairing with secondary and tertiary assets configured
detectMetalsFutures(ticker)
Detects Metal Futures (GC/SI/HG + micro variants)
Parameters:
ticker (string) : The ticker string to check
Returns: AssetPairing with secondary and tertiary assets configured
detectForexFutures(ticker)
Detects Forex Futures (6E/6B + micro variants)
Parameters:
ticker (string) : The ticker string to check
Returns: AssetPairing with secondary and tertiary assets configured
detectEnergyFutures(ticker)
Detects Energy Futures (CL/RB/HO + micro variants)
Parameters:
ticker (string) : The ticker string to check
Returns: AssetPairing with secondary and tertiary assets configured
detectTreasuryFutures(ticker)
Detects Treasury Futures (ZB/ZF/ZN)
Parameters:
ticker (string) : The ticker string to check
Returns: AssetPairing with secondary and tertiary assets configured
detectForexCFD(ticker, tickerId)
Detects Forex CFD pairs (EUR/GBP/DXY, USD/JPY/CHF triads)
Parameters:
ticker (string) : The ticker string to check
tickerId (string) : The full ticker ID (syminfo.tickerid) for primary asset
Returns: AssetPairing with secondary and tertiary assets configured
detectCrypto(ticker, tickerId)
Detects major Crypto assets (BTC, ETH, SOL, XRP, alts)
Parameters:
ticker (string) : The ticker string to check
tickerId (string) : The full ticker ID for primary asset
Returns: AssetPairing with secondary and tertiary assets configured
detectMetalsCFD(ticker, tickerId)
Detects Metals CFD (XAU/XAG/Copper)
Parameters:
ticker (string) : The ticker string to check
tickerId (string) : The full ticker ID for primary asset
Returns: AssetPairing with secondary and tertiary assets configured
detectIndicesCFD(ticker, tickerId)
Detects Indices CFD (NAS100/SP500/DJ30)
Parameters:
ticker (string) : The ticker string to check
tickerId (string) : The full ticker ID for primary asset
Returns: AssetPairing with secondary and tertiary assets configured
detectEUStocks(ticker, tickerId)
Detects EU Stock Indices (GER40/EU50) - Dyad only
Parameters:
ticker (string) : The ticker string to check
tickerId (string) : The full ticker ID for primary asset
Returns: AssetPairing with secondary asset configured (tertiary empty for dyad)
getDefaultFallback(tickerId)
Returns default fallback assets (chart ticker only, no correlation)
Parameters:
tickerId (string) : The full ticker ID for primary asset
Returns: AssetPairing with chart ticker as primary, empty secondary/tertiary (no correlation)
applySessionModifierWithBackadjust(tickerStr, sessionType)
Applies futures session modifier to ticker WITH back adjustment
Parameters:
tickerStr (string) : The ticker to modify
sessionType (string) : The session type (syminfo.session)
Returns: Modified ticker string with session and backadjustment.on applied
applySessionModifierNoBackadjust(tickerStr, sessionType)
Applies futures session modifier to ticker WITHOUT back adjustment
Parameters:
tickerStr (string) : The ticker to modify
sessionType (string) : The session type (syminfo.session)
Returns: Modified ticker string with session and backadjustment.off applied
isTriadMode(pairing)
Checks if a pairing represents a valid triad (3 assets)
Parameters:
pairing (AssetPairing) : The AssetPairing to check
Returns: True if tertiary is non-empty (triad mode), false for dyad
getAssetTicker(tickerId)
Extracts clean ticker string from full ticker ID
Parameters:
tickerId (string) : The full ticker ID (e.g., "BITGET:BTCUSDT.P")
Returns: Clean ticker string (e.g., "BTCUSDT.P")
resolveTriad(chartTickerId, pairing)
Resolves triad asset assignments with proper inversion flags
Parameters:
chartTickerId (string) : The current chart's ticker ID (syminfo.tickerid)
pairing (AssetPairing) : The detected AssetPairing
Returns: Tuple
resolveDyad(chartTickerId, pairing)
Resolves dyad asset assignment with proper inversion flag
Parameters:
chartTickerId (string) : The current chart's ticker ID
pairing (AssetPairing) : The detected AssetPairing (dyad: tertiary is empty)
Returns: Tuple
resolveAssets(ticker, tickerId, assetType, sessionType, useBackadjust)
Main auto-detection entry point. Detects asset category and returns fully resolved config.
Parameters:
ticker (string) : The ticker string to check (typically syminfo.ticker)
tickerId (string) : The full ticker ID (typically syminfo.tickerid)
assetType (string) : The asset type (typically syminfo.type)
sessionType (string) : The session type for futures (typically syminfo.session)
useBackadjust (bool) : Whether to apply back adjustment for futures session alignment
Returns: AssetConfig with fully resolved assets, inversion flags, and detection status
resolveCurrentChart()
Simplified auto-detection using current chart's syminfo values
Returns: AssetConfig with fully resolved assets, inversion flags, and detection status
AssetPairing
Core asset pairing structure for triad/dyad configurations
Fields:
primary (series string) : The primary (chart) asset ticker ID
secondary (series string) : The secondary correlated asset ticker ID
tertiary (series string) : The tertiary correlated asset ticker ID (empty for dyad)
invertSecondary (series bool) : Whether secondary asset should be inverted for divergence calc
invertTertiary (series bool) : Whether tertiary asset should be inverted for divergence calc
AssetConfig
Full asset resolution result with mode detection and computed values
Fields:
detected (series bool) : Whether auto-detection succeeded
isTriadMode (series bool) : True if triad (3 assets), false if dyad (2 assets)
primary (series string) : The resolved primary asset ticker ID
secondary (series string) : The resolved secondary asset ticker ID
tertiary (series string) : The resolved tertiary asset ticker ID (empty for dyad)
invertSecondary (series bool) : Computed inversion flag for secondary asset
invertTertiary (series bool) : Computed inversion flag for tertiary asset
assetCategory (series string) : String describing the detected asset category
Note to potential users.
I did not really intend to make this public but i have to in order to avoid any potential compliance issues with the TradingView Moderation Team and the House Rules.
However if you are to use this library, you cannot make your code closed source / invite only as it is intellectual property. The only exception to this is if I am credited in the header of your code and i explicitly give permission to do so.
As per the TradingView house rules, you are completely FREE to do with this as you like, provided the script stays private.
Use the @fstarcapital tag to give credits
❤️ from cephxs

NexusLibsDisplayNexusLibsDisplay provides lightweight, reusable UI helpers for Pine Script indicators.
It is designed to simplify the creation of display elements on the chart—such as info tables, headers, and custom text overlays—without forcing users to rebuild UI components in every script.
This library follows a minimal, dependency-free design so it can be imported safely into protected or invite-only indicators.
Functions
createInfoTable(showPair, showTF, txtColor, bgColor)
Creates a compact top-center table displaying the current symbol and timeframe.
Useful for dashboards, algo-overviews, and clean chart annotations.
showText(txt, posX, posY, txtColor)
Displays custom text at a specific chart location.
Ideal for labels, markers, or highlighting model states.

MTFToolkit-LibraryLibrary "MTFToolkit"
Multi-Timeframe Utilities Library: conversions, Fibonacci, TF sorting, MTF helpers, color gradients, demo table
timeframeToMinutes(tf)
Converts a timeframe string to minutes
Parameters:
tf (string) : Timeframe string (e.g., "1", "15", "1D", "1W", "1M")
Returns: Number of minutes as float
minutesToTimeframe(minutes)
Converts minutes to a timeframe string
Parameters:
minutes (float) : Number of minutes
Returns: Timeframe string
timeframeToSeconds(tf)
Converts a timeframe string to seconds
Parameters:
tf (string) : Timeframe string
Returns: Number of seconds
secondsToTimeframe(seconds)
Converts seconds to a timeframe string
Parameters:
seconds (float) : Number of seconds
Returns: Timeframe string
fiboGenerate(n)
Generates Fibonacci sequence up to n elements
Parameters:
n (int) : Number of elements
Returns: Array of Fibonacci numbers
fiboMapToTV(arrFibo)
Maps Fibonacci values to TradingView timeframe strings
Parameters:
arrFibo (array) : Array of Fibonacci numbers
Returns: Array of timeframe strings
arrayMergeUnique(arr1, arr2)
Merges two string arrays and keeps unique values
Parameters:
arr1 (array) : First array
arr2 (array) : Second array
Returns: Merged array with unique strings
arrayFilterMax(arr, maxMinutes)
Filters TF array by max minutes
Parameters:
arr (array) : Array of timeframe strings
maxMinutes (float) : Maximum allowed minutes
Returns: Filtered array
arraySortTF(tf_array, show_array, ascending)
Sorts TF array by minutes, optionally ascending
Parameters:
tf_array (array) : Array of timeframes
show_array (array) : Array of bool flags (for visibility)
ascending (bool)
masterTF(arr)
Returns the largest TF from array (master)
Parameters:
arr (array) : Array of TF strings
Returns: Master TF
slaveTF(arr)
Returns all TFs except master (slaves)
Parameters:
arr (array) : Array of TF strings
Returns: Array of slave TFs
isTFIncreasing(prevTF, nextTF)
Checks if next TF is larger than previous
Parameters:
prevTF (string) : Previous timeframe
nextTF (string) : Next timeframe
Returns: true if nextTF > prevTF
TFScore(values)
Computes simple average as score
Parameters:
values (array) : Array of float
Returns: Simple average (na if empty)
gradient_triangular(value, mid_point, min_color, mid_color, max_color)
Produces a triangular gradient between 3 colors
Parameters:
value (float) : Current value (0–100 or any scale)
mid_point (float) : Center point of gradient
min_color (color) : Color at low end
mid_color (color) : Color at midpoint
max_color (color) : Color at high end
Returns: A color value
TFColorGradient(tf_val, min_val, max_val)
Timeframe color gradient helper
Converts a timeframe (in minutes) into a color using a
red → yellow → green gradient.
Parameters:
tf_val (float) : Timeframe value in minutes
min_val (float) : Minimum expected minutes
max_val (float) : Maximum expected minutes
Returns: Color based on position between min_val and max_val
------------------------------------------------------------
TFColorGradientEx(tf_val, min_val, mid_val, max_val, low_color, mid_color, high_color)
Extended customizable timeframe gradient
Parameters:
tf_val (float) : Timeframe value in minutes
min_val (float) : Minimum minutes
mid_val (float) : Middle minutes
max_val (float) : Maximum minutes
low_color (color) : Color at min_val
mid_color (color) : Color at mid_val
high_color (color) : Color at max_val
Returns: Color determined by TF position
------------------------------------------------------------
demoTable(tf_arr, show_arr, dashboard_position, horizontal_table, show_header)
Creates a demo table for testing TF arrays
Parameters:
tf_arr (array) : Array of TF strings
show_arr (array) : Array of bools to show TFs
dashboard_position (string) : Position string
horizontal_table (bool) : true=horizontal, false=vertical
show_header (bool) : Show header row

