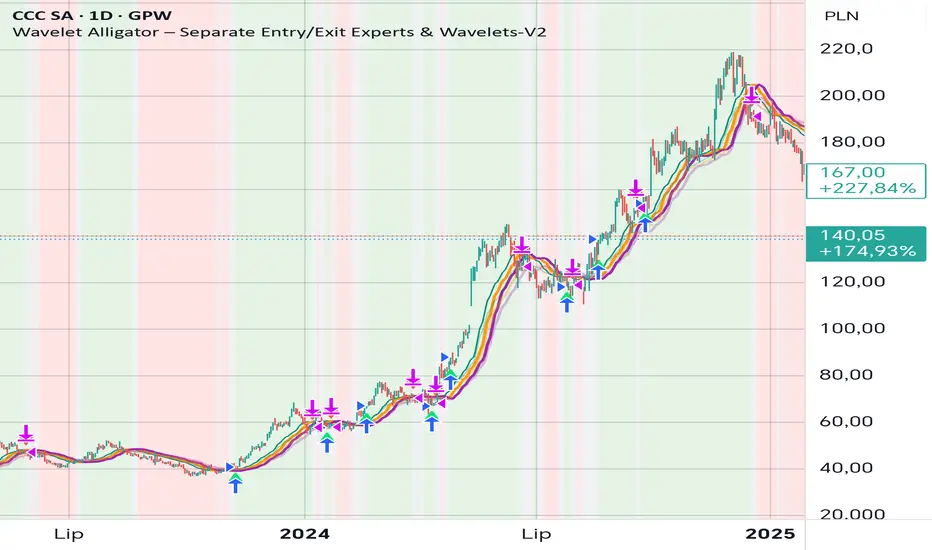
Wavelet Alligator – Separate Entry/Exit Experts & Wavelets-V2
Wavelet Alligator – Strategy Explanation & How to Use
1. Concept Overview
The Wavelet Alligator strategy combines:
- Wavelet transforms (Daubechies, Haar, Symlet, Mexican Hat, Morlet)
- Fractional calculus kernels: Caputo-Fabrizio (CF) and Atangana-Baleanu (AB)
- Three-layer “alligator-like” wavelet smoothing (soft → medium → strong)
- Expert-based entry/exit routing (RAW, CF, AB, or Majority vote)
- Independent wavelets for ENTRY and EXIT
- Main trend defined by AB wavelet ordering
This creates a multi-structure, multi-kernel trend engine capable of capturing extended moves with high signal quality.
2. Wavelet Alligator Structure
Each source (RAW, CF, AB) is transformed into three wavelet layers:
Soft = fastest reaction
Medium = mid smoothing
Strong = trend backbone
Wavelets:
- Daubechies: stable trend
- Haar: fast impulse detection
- Symlet: balanced
- Mexican Hat: curvature and reversal detection
- Morlet: cyclic, oscillatory
3. Entry Logic
Long entry occurs when:
- AB wavelet shows bullish structure (soft > medium > strong, medium rising)
- Selected entry expert approves (RAW / CF / AB / Majority)
- Wavelet condition: soft > strong AND medium crosses above strong
4. Exit Logic
Exit is independent from entry:
- Controlled by chosen exit expert
- Wavelet reversal condition: soft < strong AND medium crosses below strong
- Forced exit when AB trend turns neutral or bearish
5. Background Color (Regime)
- Green: bullish AB regime
- Red: bearish AB regime
- Gray: neutral/transition
6. How to Use
Step 1 – Choose entry wavelet
Daubechies: stable trend
Haar: breakout scalping
Mexican Hat: early reversals
Symlet: balanced
Morlet: cyclic markets
Step 2 – Choose exit wavelet
Mexican Hat: best precision
Daubechies: smooth exits
Haar: aggressive exits
Step 3 – Select entry/exit experts
CF only – fast fractional trend
AB only – stable long-memory trend
RAW only – pure price structure
Majority – safest, noise-filtered
Step 4 – Run the strategy
Entries occur only during AB bullish trend.
Exits occur on wavelet reversal or AB trend failure.
7. Why This Strategy Works
It fuses:
- Fractional calculus (memory)
- Wavelets (shape/curvature)
- Alligator ordering (trend hierarchy)
Result: high-quality entries, strong trend holding, noise-resistant signals.
Penunjuk dan strategi
V15.0 Adaptive Chameleon [Pro]
# **V15.0 Adaptive Chameleon – Strategy Description**
**Adaptive Chameleon** is a fully automated TradingView strategy powered by a signal engine based on multi-timeframe trend analysis, adaptive moving averages, and a volatility filter. The goal is to trade in the direction of a strong and confirmed trend, avoid opening trades in weak or manipulative price zones, and establish positions with a clearly defined risk/reward ratio.
---
## **1. General Logic and Philosophy**
The strategy divides tasks between two timeframes:
* **4-Hour Chart → Trend Manager (Boss)**
Determines the direction and strength of the trend.
* **4-Minute Chart → Entry Trigger (Operating Unit)**
Generates the ideal entry signal in the direction of the trend.
Thanks to this structure, the strategy both follows the long-term main direction and finds clear entries with low lag on smaller timeframes.
---
## **2. Trend Detection (4H)**
The strategy uses **KAMA (Kaufman Adaptive Moving Average)** and **ADX** to identify trends on the higher timeframe.
### **KAMA – Adaptive Trend Line**
* The KAMA is much more "smart" than traditional moving averages.
* It accelerates during price movements and decelerates during sideways movements.
* This allows for much clearer detection of trend direction.
### **ADX – Trend Strength Meter**
The strategy only opens trades when **trend strength** is rising (above the ADX average).
This prevents unnecessary trades when the trend is weak.
### **Trend Rules**
* Price above the KAMA → **Uptrend**
* Price below the KAMA → **Downtrend**
* ADX widening → **Trend strong**
The entry trigger is activated when these three conditions are met together.
---
## **3. Entry Engine (45m)**
On the 45-minute timeframe, the system uses the following components:
### **AlphaTrend (MFI + ATR-Based Adaptive Line)**
* Measures market flow direction with MFI (Money Flow Index),
* Measures price level breakouts with ATR (Volatility).
AlphaTrend detects whether the price is likely to reverse upwards or downwards.
### **Entry Signal**
* **Buy signal:** If the AlphaTrend has reversed upwards based on recent bars
* **Sell signal:** If the AlphaTrend has broken downwards
### **Pivot Points (For Stop)**
* The **pivotLow** and **pivotHigh** levels of the last 10 bars are calculated.
* These are used to determine the most logical stop distance.
---
## **4. Protection Shields**
The strategy uses two main filters to protect against the most dangerous conditions in the crypto market:
### **1. Pump/Dump Filter**
* A candlestick length greater than 4% is considered a "pump bar."
* Never open a trade on these bars.
The goal: to avoid sudden manipulation candlesticks.
### **2. RSI Filter**
* Long trades: RSI > 45 (open long on weak momentum)
* Short trades: RSI < 55 (open short on extremely strong momentum)
These filters provide more balanced entries.
---
## **5. Final Entry Conditions**
### **All conditions are required simultaneously for long:**
1. 4H trend up
2. ADX trend strength increasing
3. 45m AlphaTrend issued a "buy" signal
4. RSI > 45
5. No candlestick pump
6. Date range is suitable
### **All conditions apply in the opposite direction for short.**
---
## **6. Exit Mechanism (Stop, TP, Trailing)**
The strategy uses a three-layer structure on the exit side:
### **1. Pivot-Based Stop**
* Stop distance = Entry price − Pivot Low (for long)
* Minimum stop distance = **1% of the price**
Provides both structural and mathematical security.
### **2. Fixed R:R (Default 1:2)**
* TP = Entry + Stop Distance × R:R
The default 2R target is ideal for trend systems.
### **3. Optional Trailing Stop**
* Dynamic trailing stop that follows the price by a certain percentage.
* Allows trend trades to yield greater profits.
---
## **7. Chart Displays**
* Purple line:** 4H WEDGE (main trend line)
* Yellow background:** Pump protection is active (trades will not be opened on that bar)
---
## **8. Practical Effect of the Strategy**
This system has an adaptive structure based on trend variations.
**Strengths:**
* Very high accuracy (76–80% in SOL and ETH tests)
* Low drawdown (approximately 6–7%)
* Safe entries thanks to pump/dump and extreme momentum filters
* Clearly defined stop and target structure
* Low noise thanks to multi-timeframe compatibility
**Weaknesses:**
* Performance may decrease in sideways markets without trends
* Overtrading may occur if the ADX filter is closed
* Very small stops can sometimes cause unnecessary triggers
---
## **9. Conclusion**
**Adaptive Chameleon** is a trend-based and highly stable strategy with well-established risk management, manipulation filtering, and entry into lower timeframes with clear trend direction detection and low-latency signals.
SOL and ETH demonstrated strong and balanced performance in backtests with metrics such as:
* **600+ trades**
* **30–37% profit**
* **76–80% win rate**
* **Low max drawdown**

HPAS mean reversion strategy testerTakes Krown HPAS values hardcoded and simulates longs and short with configurable standard deviation multiplier TP/SL. Best used on lower timeframes

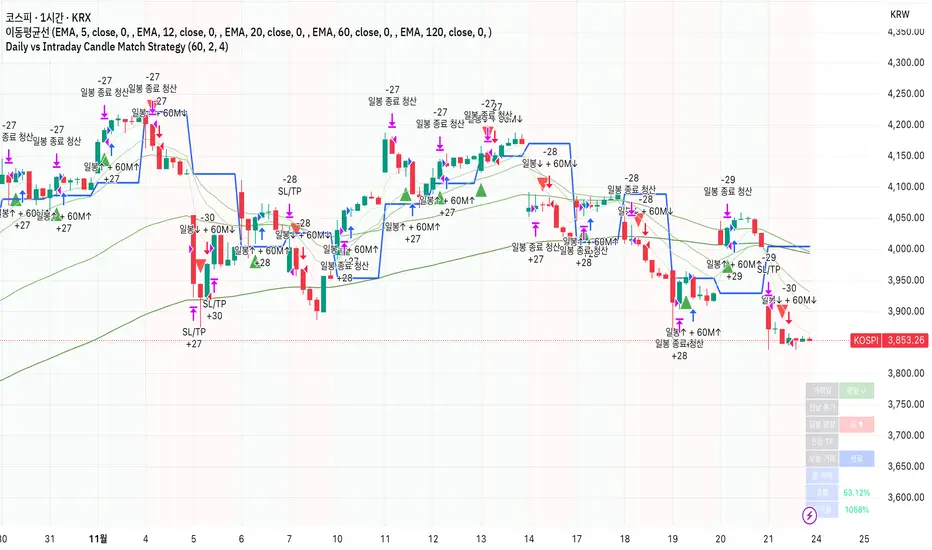
Daily vs Intraday Candle Match Strategy고죠 훈의 차트공부방
Gojo Hoon’s Trading Room
전일 종가 대비 현재 일봉 방향과 시간봉 방향이 일치할 때 진입
Trade when current daily direction (vs. previous close) matches the hourly/15-minute candle direction.
Kill Zone Strategy - Exact Match고죠 훈의 차트공부방
Gojo Hoon’s Trading Room
Kill Zone 시간대 방향성과 일중 추세의 상관관계
The 9–10 AM Kill Zone candle on the KOSPI chart determines the day’s long or short trading direction.

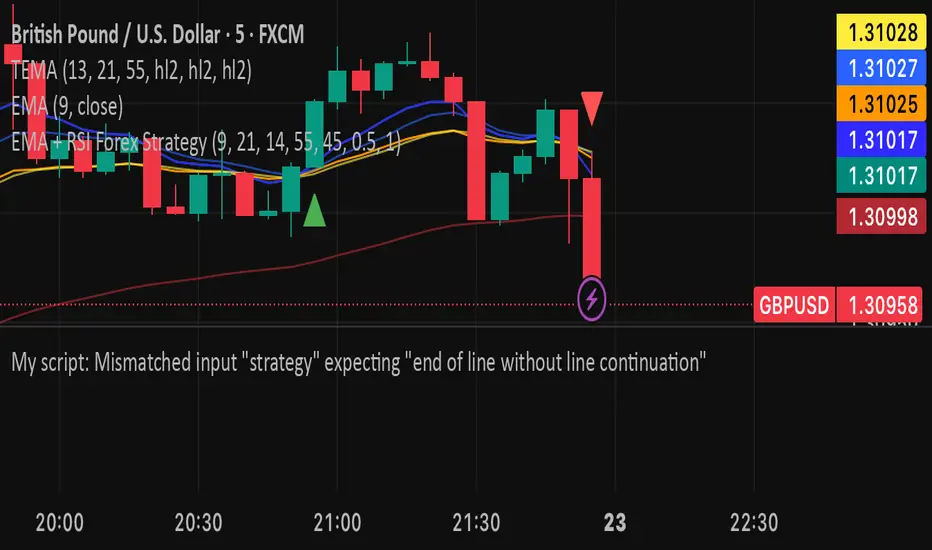
EMA + RSI Forex StrategyHere is a complete and ready-to-use Pine Strategy Script v5 trading strategy. It’s designed for forex pairs and uses combination of EMA crossover and RSI confirmation to identify high-probability entries. The script includes backtesting capability and adjustable parameters for optimization.

RSI + 55 EMA + Volume (SL Marked, No Engulfing)This is to help entering in trades by considering 50 EMA and RSI indicators, Volume is used for confirmations

Price Actionthis is indicator from VuTienTurtleTrader, I need to further develop it thus publish my own version here.
the original script source:
EMA 89 and Hull MA 89 used to filter trading signals and working as support and resistance.
When both of them are red, market is bearisk, only short.
When both of them are green, market is bullish, only long.
when there is 1 green and 1 red, market is neutral, can short or long.
Enjoy and happy trading!

singularity crypto editionA trend following strategy that enters in a pullback of a trend . works greate on 3m to 15m timeframe. should be optimize on current market regime
ParabolicSAR+EMA[TS_Indie]🚀 EMA + Parabolic SAR Reversal Trading Strategy
This trading system effectively combines the use of Exponential Moving Averages (EMA) with the Parabolic SAR to identify both price trends and key reversal points. The EMA Fast is used to signal the primary short-term trend, while the EMA Slow acts as a filter for the long-term trend direction. The Parabolic SAR then helps to confirm the reversal signals.
🛠️ Tools Used
1. EMA Fast – Primary Short-Term Trend
2. EMA Slow – Long-Term Trend Filter
3. Parabolic SAR – Reversal Confirmation
🎯 Entry Rules
📈 Buy Setup
1. Trend Filter: EMA Fast > EMA Slow → Uptrend
2. Pullback: Price pulls back and closes below the EMA Fast line.
3. Reversal: Price reverses/pulls back up and closes above the EMA Fast line.
4. SAR Confirmation: The previous Parabolic SAR dot is above the high, and the dot in the current candle is below the low → Reversal signal confirmed.
5. Entry: Enter Buy immediately.
📉 Sell Setup
1. Trend Filter: EMA Fast < EMA Slow → Downtrend
2. Pullback: Price pulls back and closes above the EMA Fast line.
3. Reversal: Price reverses/pulls back down and closes below the EMA Fast line.
4. SAR Confirmation: The previous Parabolic SAR dot is below the low, and the dot in the current candle is above the high → Reversal signal confirmed.
5. Entry: Enter Sell immediately.
💰 Exit Management (Entry, Stop Loss, Take Profit)
1. Entry: Enter the order at the closing price of the signal candle.
2. Stop Loss (SL): Set the Stop Loss at the Parabolic SAR dot.
3. Take Profit (TP): Calculated from the Entry and Stop Loss points, multiplied by the Risk Reward Ratio.
⚙️ Optional Parameters
➭ Custom Risk/Reward Ratio for Take Profit.
➭ Option to add an ATR buffer to the Stop Loss.
➭ Adjustable EMA Fast period.
➭ Adjustable EMA Slow period.
➭ Adjustable Parabolic SAR parameters.
➭ Option to enable Long-only / Short-only positions.
➭ Customizable Backtest start and end date.
➭ Customizable trading session time.
🔔 Alert Function
Alerts display:
➭ Entry Price
➭ Stop Loss Price
➭ Take Profit Price
💡 This strategy allows for many parameter adjustments, such as the MA type, adding/subtracting from the Stop Loss using ATR, and selecting specific sessions for backtesting. If you find interesting or profitable results after adjusting the parameters, please share your comments with other traders!
⚠️ Disclaimer
This indicator is designed for educational and research purposes only. It does not guarantee profits and should not be considered financial advice. Trading in financial markets involves significant risk , including the potential loss of capital.

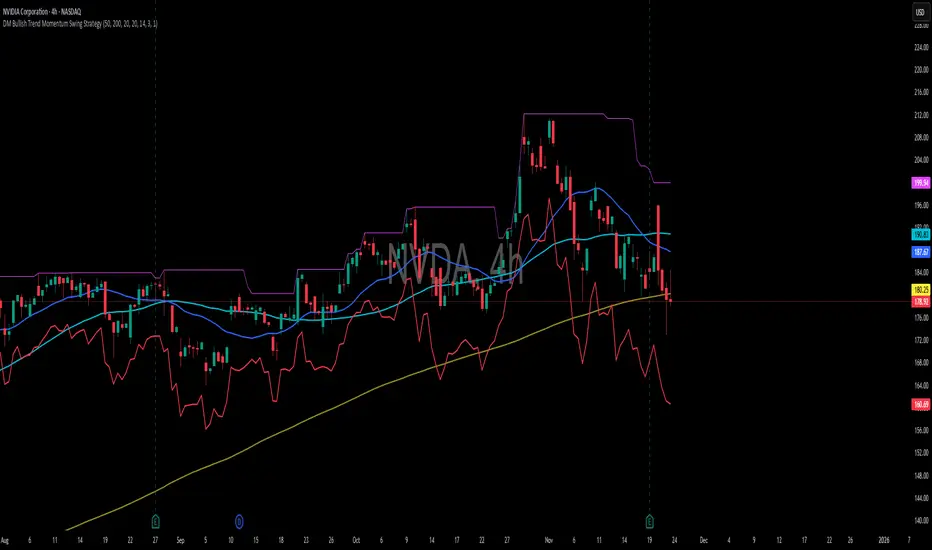
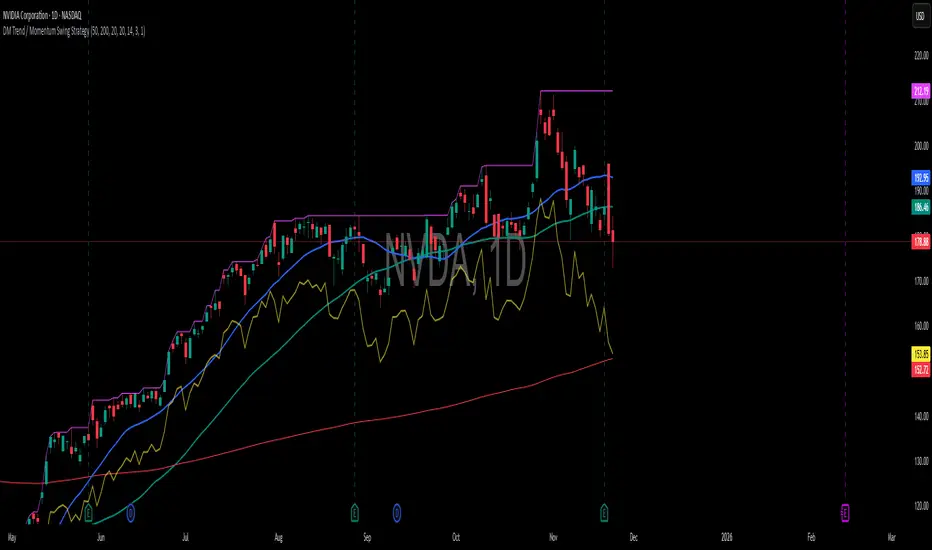
DM Trend Momentum Swing Strategy Bull / BearHow to Trade Your DM Trend Momentum Swing Strategy
You trade breakouts with trend direction.
2 setups:
Bullish (buy)
Bearish (short)
Bullish Trade (BUY)
Take a BUY only when all 3 are true:
50 MA is above 200 MA
Price is above 50 MA
Candle closes above the purple breakout line
How to enter:
Wait for the candle to close above the purple line.
Then at the start of the next candle → you BUY.
Stop Loss:
Look at your blue/red ATR stop line or your table.
Use the number in the table as your stop price.
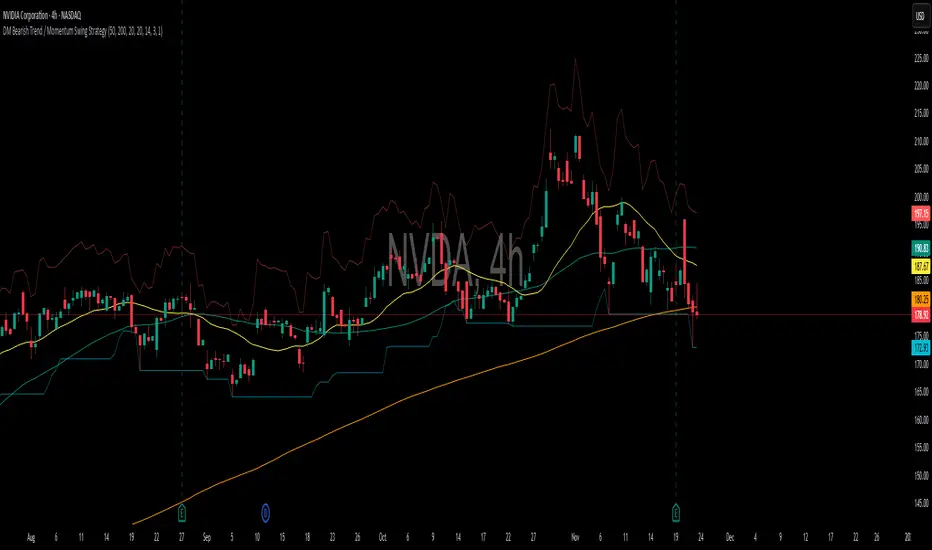
Bearish Trade (SELL / SHORT)
Take a SELL only when all 3 are true:
50 MA is below 200 MA
Price is below 50 MA
Candle closes below the aqua support line
How to enter:
Wait for the candle to close below the aqua line.
Then at the start of the next candle → you SELL / SHORT.
Stop Loss:
Use the stop price shown in the table.
When to Exit
You exit when EITHER happens:
• Your stop loss gets hit
OR
• Price closes on the wrong side of the 20 EMA (yellow line)
Ultra-Simple Checklist
Before every trade:
☐ Trend direction matches?
☐ Price above/below 50 MA?
☐ Candle closed beyond breakout/breakdown line?
All yes → Take the trade
Any no → Skip
Final Important Rule
Never enter before the candle closes.
Most losses come from impulse trading during candles.
DM Bullish Trend Momentum Swing StrategyHow To Enter A Trade (Bullish Strategy)
You only take BUY (long) trades.
1. Check the trend
Only trade if:
The 50 MA is above the 200 MA
Price is above the 50 MA
If that’s not true → No trade.
2. Wait for a breakout
Look at the pink breakout line on your chart.
You enter only when:
A candle closes above the pink line
(not just touches it).
No candle close above → No entry.
3. When to actually click BUY
You should:
Wait for the candle to close above the breakout line.
As soon as the NEXT candle starts → Click BUY.
That’s it.
4. Place your stop loss
After you enter the trade:
Look at the red line (ATR stop).
Place your stop loss order at that level.
Your rule:
Entry price − (ATR × 3)
Simple example
Let’s say:
Price = $150
Breakout line = $149
ATR shown in table = $1.50
A candle closes at $150.50.
Next candle opens.
You BUY
Stop loss = 150.50 − (1.5 × 3) = $146.00
Quick checklist before every entry
50 MA > 200 MA
Price above 50 MA
Candle closed above breakout line
If all yes → BUY on the next candle open.
One important rule
Never jump in before the candle closes.
Let the breakout confirm.
Most losing trades happen because people enter too early.

DM Bearish Trend / Momentum Swing StrategyStep 1: Find a trend
Only trade when:
The 50 MA is below the 200 MA
Price is below the 50 MA
If this is not true → Don’t trade
Step 2: Wait for a breakdown
Look at your chart and your indicator:
You will see a support line (from the lowest lows).
You enter only when a candle CLOSES below that line.
Not when it touches.
Not when it goes under and comes back.
Only when the candle closes below it.
Step 3: When do you actually click Sell?
You do it like this:
✔ Candle closes below the breakdown level
✔ A new candle starts
You enter a SHORT / SELL at the start of the new candle.
Step 4: Place your stop loss
You already have this on your chart.
Your script uses:
Stop Loss = ATR × 3
And since you are short:
👉 The stop is above your entry price
Just place your stop at the red line on your chart.
Step 5: Exit the trade
You exit when:
Price closes above the 20 MA
That’s your exit signal.
Or
Your stop loss gets hit.
Very Simple Checklist
Before every trade, ask:
Is 50 MA below 200 MA?
Is price below 50 MA?
Did a candle close below support?
If YES → Place SHORT
If NO → Do nothing
Real Example (Simple)
Let’s say:
You’re trading a large cap stock like Tesla on the Daily.
50 MA is below 200 MA
Price is below 50 MA
A candle closes below recent support
Next candle opens → You SELL (short).
Put stop at the red line (ATR ×3).
Hold until price closes above 20 MA.
Final Advice
Your strategy is:
For trends
For breaking weak stocks
Not for bouncing or guessing bottoms.
Be patient. Wait for clear setups.

DM Bullish Trend Momentum Swing StrategyHow to Enter a Trade .
You ONLY enter when all 3 conditions are true:
1. The trend is up
Check your moving averages:
The 50 MA must be above the 200 MA.
The price must be above the 50 MA.
If those two aren’t true → NO TRADE.
2. A breakout happens
Look at the pink breakout line on your chart.
Enter a trade only when the candle CLOSES above that line.
If the candle just touches it → NO TRADE
If it breaks during the candle but closes below → NO TRADE
Only when it closes above → VALID ENTRY
3. When do you click Buy?
You do it like this:
Wait for the candle to close above the breakout line.
As soon as the next candle starts → ENTER A BUY (LONG) trade.
That’s your entry.
Simple Example
Let’s say you’re on a 4H chart:
The 50 MA is above the 200 MA
Price is above the 50 MA
A candle closes above the pink breakout line
You now enter a BUY trade at the start of the next 4H candle.
Your Stop Loss
After you enter:
Place your stop loss at:
Entry price − (ATR × 3)
is is already calculated .
So just place your stop at the red line.
Quick Checklist
Is 50 MA above 200 MA?
Is price above 50 MA?
Did a candle CLOSE above the breakout line?
If all are YES → ENTER BUY
If any is NO → NO TRADE
DM Bearish Trend / Momentum Swing Strategy
How to Enter Trades in a Bearish Market (Short Entry)
Just flip everything upside down.
1. Downtrend condition
The 50 MA must be below the 200 MA
The price must be below the 50 MA
If those two are not true → NO SHORT TRADE.
2. Bearish breakout
Instead of breaking above highs:
Price must close below the lowest low of the last X candles
(default would be your same breakout period, like 20).
So:
If the candle closes below recent support → that’s your bearish breakout.
3. When do you enter the short?
You enter like this:
Wait for a candle to close below the breakdown level.
At the open of the next candle, you enter a SELL (SHORT).
Bearish Entry Checklist
For a short trade:
Is the 50 MA below the 200 MA?
Is price below the 50 MA?
Did a candle close below recent support?
If YES to all → ENTER SELL (SHORT)
DM Trend / Momentum Swing StrategyHow to Enter a Trade.
You ONLY enter when all 3 conditions are true:
1. The trend is up
Check your moving averages:
The 50 MA must be above the 200 MA.
The price must be above the 50 MA.
If those two aren’t true → NO TRADE.
2. A breakout happens
Look at the pink breakout line on your chart.
Enter a trade only when the candle CLOSES above that line.
If the candle just touches it → NO TRADE
- If it breaks during the candle but closes below → NO TRADE
- Only when it closes above → VALID ENTRY
3. When do you click Buy?
You do it like this:
Wait for the candle to close above the breakout line.
As soon as the next candle starts → ENTER A BUY (LONG) trade.
That’s your entry.
Example
Let’s say you’re on a 4H chart:
The 50 MA is above the 200 MA
Price is above the 50 MA
A candle closes above the pink breakout line
You now enter a BUY trade at the start of the next 4H candle.
Your Stop Loss
After you enter:
Place your stop loss at:
Entry price − (ATR × 3)
It calculates already.
So just place your stop at the red line.
Quick Checklist
Is 50 MA above 200 MA?
Is price above 50 MA?
Did a candle CLOSE above the breakout line?
If all are YES → ENTER BUY
If any is NO → NO TRADE
Dami's HMA Strategy"Dami's HMA Strategy: Dynamic Crossover with Momentum Filter"
Key Points to Include:
Foundation: The strategy is based on the Hull Moving Average (HMA), noted for its speed and reduced lag, making it ideal for identifying trend inflection points early.
Enhanced Logic: Unlike a simple moving average crossover, this strategy incorporates a momentum filter. A signal is only triggered if the HMA crossover coincides with a candle moving in the direction of the new trend (bullish candle for Long, bearish candle for Short). This aims to confirm the impulse and avoid false entries during consolidation periods or 'weak' crossovers.
100% Market Coverage System: It is a continuous reversal system. Every new signal (Long or Short) closes the opposite position, ensuring the trader is always positioned in the direction indicated by the HMA.
Complementary Visualization: It includes the 8-Period High/Low Bands (Dami's Bands) to provide visual context of the recent price range, although they do not affect trading orders.
Adjustment and Optimization: The HMA length (hma_len=9 by default) is the key parameter to optimize based on the specific pair and timeframe. Higher values will generate fewer signals and be slower, while lower values (like the current 9) make it more sensitive.

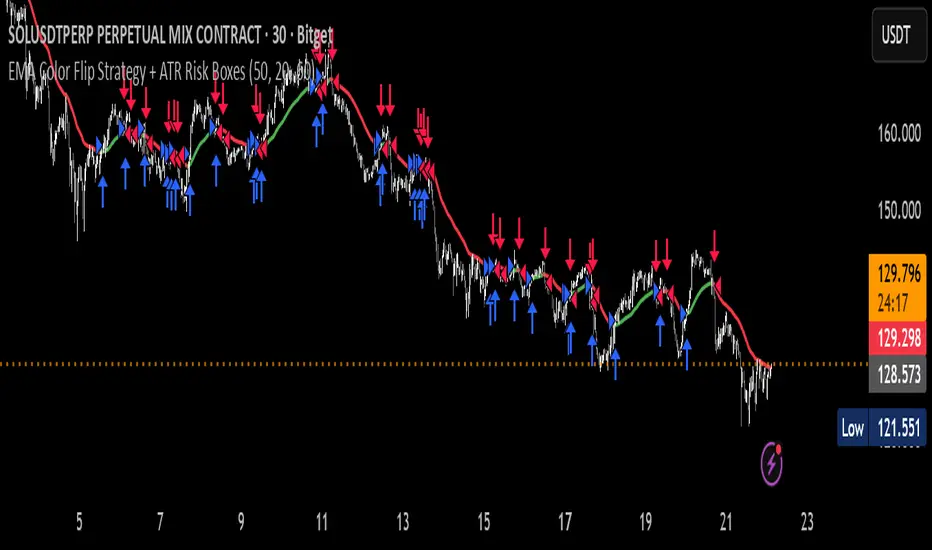
EMA Color Flip Strategy Experimenting on SOL 30 min chart, it seems good!
Let me know what you think!
Simple MA Crossover w/ SLTPPicture two cheetahs on a racetrack made of price candles. One cheetah is fast and twitchy (the short-term EMA). The other is chill, lumbering, and takes its sweet time (the long-term EMA). When the twitchy cheetah sprints ahead and crosses above the chill one → “BUY, YOU MAGNIFICENT DEGEN!” When the twitchy one gets tired, slows down, and gets lapped from above → “SELL before this turns into a horror movie!”
That, my friend, is the EMA crossover strategy in its purest, most dramatic form.

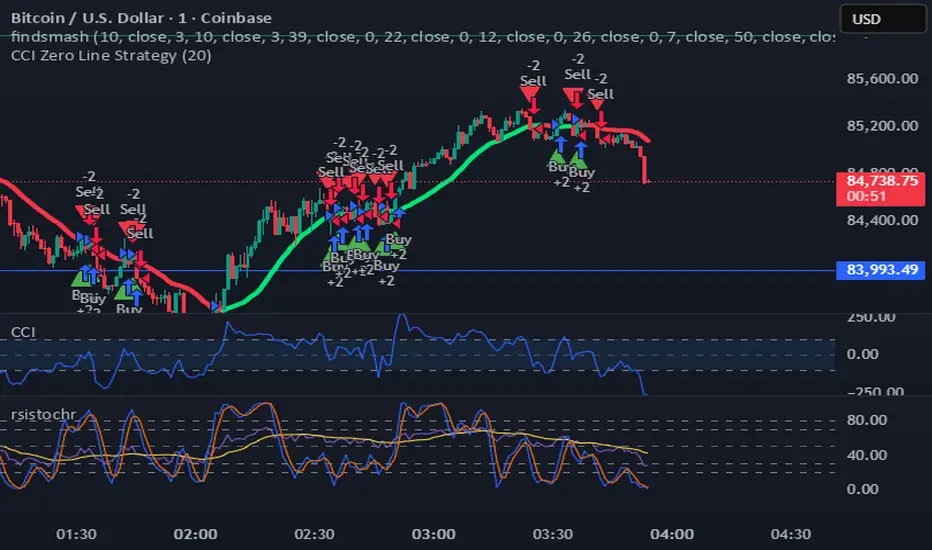
CCI Zero Line StrategyCCI Zero Line Strategy i have created this using cci just check in different time frame you and check the results