Plot_4_Key_LevelsBollinger Bands (upper & lower)
- computes 12-bar Bollinger Bands on the chart’s current timeframe, with a 3σ (standard-deviation) multiplier.
- computes vwap
- computes VWMA(HL2, 36)—a smoothed, volume-weighted average price—plotted as a line.
Penunjuk dan strategi

Trajectory Channel (VWAP Highs/Lows) [Euler-Inspired]VPWA higha nd low Euler trajectory inspired script

Adaptive FoS LibraryThis library provides Adaptive Functions that I use in my scripts. For calculations, I use the max_bars_back function with a fixed length of 200 bars to prevent errors when a script tries to access data beyond its available history. This is a key difference from most other adaptive libraries — if you don’t need it, you don’t have to use it.
Some of the adaptive length functions are normalized. In addition to the adaptive length functions, this library includes various methods for calculating moving averages, normalized differences between fast and slow MA's, as well as several normalized oscillators.

XAUUSD/SPX Slope IndicatorThe XAUUSD/SPX Slope Indicator for TradingView calculates the slope of the XAUUSD (Gold) to SPX (S&P 500) ratio using linear regression over a customizable lookback period (default 20 bars). It plots the slope to show whether Gold is outperforming or underperforming the S&P 500, with a positive slope indicating Gold's strength and a negative slope favoring stocks. A zero line and color-coded background (green for positive, red for negative) enhance readability, making it a useful tool for analyzing relative market trends. Ensure your platform supports XAUUSD and SPX symbols.

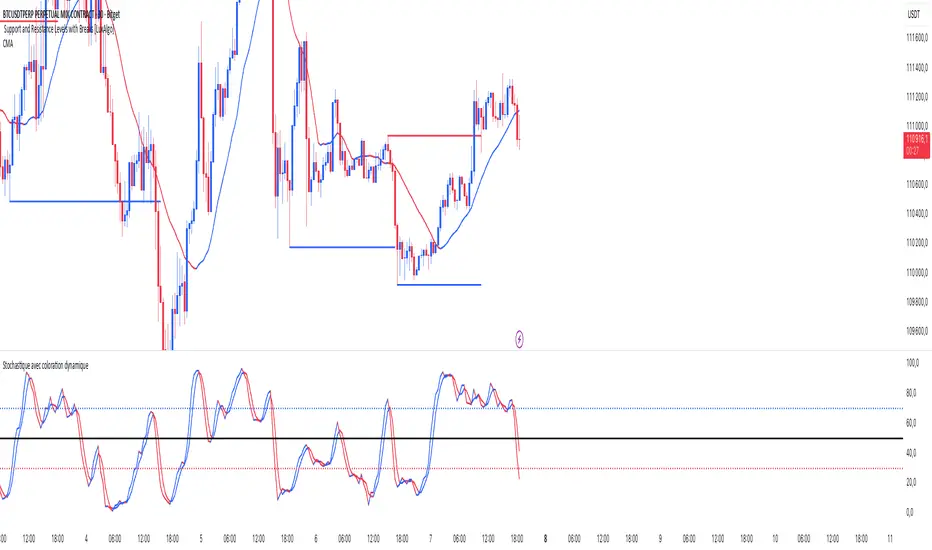
Stochastic ColorStochastic Color. A momentum indicator that compares a particular closing price of an asset to a range of its prices over a specific period of time. It helps identify overbought and oversold conditions in the market. The indicator ranges from 0 to 100, with readings above 80 typically considered overbought and readings below 20 considered oversold. It is often used to anticipate potential price reversals.
RSI SMA ColorRSI 14 with SMA 21 Color. A momentum oscillator that measures the speed and change of price movements. It ranges from 0 to 100 and is typically used to identify overbought or oversold conditions in a market. An RSI above 70 may indicate that an asset is overbought, while an RSI below 30 may suggest it is oversold.

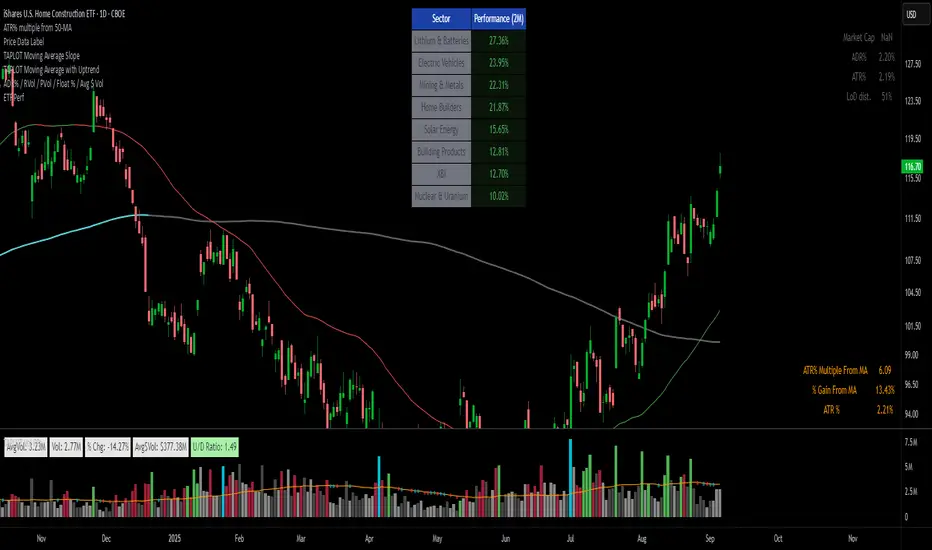
ETFs Sector PerformanceDisplays a table of the Top 8 performing ETFs over a selected period (1M / 2M / 3M / 6M) to quickly identify industry strength.
Pre-Set Universe (39 ETFs)
ITA — iShares U.S. Aerospace & Defense ETF
DBA — Invesco DB Agriculture Fund
BOTZ — Global X Robotics & Artificial Intelligence ETF
JETS — U.S. Global Jets ETF
XLB — Materials Select Sector SPDR Fund
XBI — SPDR S&P Biotech ETF
PKB — Invesco Dynamic Building & Construction ETF
ICLN — iShares Global Clean Energy ETF
SKYY — First Trust Cloud Computing ETF
DBC — Invesco DB Commodity Index Tracking Fund
XLY — Consumer Discretionary Select Sector SPDR Fund
XLP — Consumer Staples Select Sector SPDR Fund
BLOK — Amplify Transformational Data Sharing ETF
KARS — KraneShares Electric Vehicles & Future Mobility ETF
XLE — Energy Select Sector SPDR Fund
ESPO — VanEck Video Gaming and eSports ETF
XLF — Financial Select Sector SPDR Fund
PBJ — Invesco Dynamic Food & Beverage ETF
ITB — iShares U.S. Home Construction ETF
XLI — Industrial Select Sector SPDR Fund
PAVE — Global X U.S. Infrastructure Development ETF
PEJ — Invesco Dynamic Leisure & Entertainment ETF
LIT — Global X Lithium & Battery Tech ETF
IHI — iShares U.S. Medical Devices ETF
XME — SPDR S&P Metals & Mining ETF
FCG — First Trust Natural Gas ETF
URA — Global X Uranium ETF
PPH — VanEck Pharmaceutical ETF
QTUM — Defiance Quantum Computing & Machine Learning ETF
IYR — iShares U.S. Real Estate ETF
XRT — SPDR S&P Retail ETF
SOXX — iShares Semiconductor ETF
BOAT — SonicShares Global Shipping ETF
IGV — iShares Expanded Tech-Software Sector ETF
TAN — Invesco Solar ETF
SLX — VanEck Steel ETF
IYZ — iShares U.S. Telecommunications ETF
IYT — iShares U.S. Transportation ETF
XLU — Utilities Select Sector SPDR Fund
Bot Analyzer📌 Script Name: Bot Analyzer
This TradingView Pine Script v5 indicator creates a dashboard table on the chart that helps you analyze any asset for running a martingale grid bot on futures.
🔧 User Inputs
TP % (tpPct): Take Profit percentage.
SO step % (soStepPct): Step size between safety orders.
SO n (soCount): Number of safety orders.
M mult (martMult): Martingale multiplier (how much each next order increases in size).
Lev (leverage): Leverage used in futures.
BB len / BB mult: Bollinger Bands settings for measuring channel width.
ATR len: ATR period for volatility.
HV days: Lookback window (days) for Historical Volatility calculation.
📐 Calculations
ATR % (atrPct): Normalized ATR relative to price.
Bollinger Band width % (bbPct): Market channel width as percentage of basis.
Historical Volatility (hvAnn): Annualized volatility, calculated from daily log returns.
Dynamic Step % (dynStepPct): Step size for safety orders, automatically adjusted from ATR and clamped between 0.3% and 5%.
Covered Move % (coveredPct): Total percentage move the bot can withstand before last safety order.
Martingale Size Factor (sizeFactor): Total position size multiplier after all safety orders, based on martingale multiplier.
Risk Score (riskLabel): Simple risk estimate:
Low if risk < 30
Mid if risk < 60
High if risk ≥ 60
📊 Output (Table on Chart)
At the top-right of the chart, the script draws a table with 9 rows:
Metric Value
BB % Bollinger Band width in %
HV % Historical Volatility (annualized %)
TP % Take profit setting
SO step % Safety order step size
SO n Number of safety orders
M mult Martingale multiplier
Dyn step % Dynamic step based on ATR
Size x Total position size factor (e.g., 4.5x)
Risk Risk label (Low / Mid / High)
⚙️ Use Case
Helps choose coins for a martingale bot:
If BB% is wide and HV% is high → the asset is volatile enough.
If Risk shows "High" → parameters are aggressive, you may need to adjust step size, SO count, or leverage.
The dashboard lets you compare assets quickly without switching between multiple indicators.

FNGAdataDates_Part2FNGAdataDates_Part2 provides the second part of historical trading dates for a financial instrument (e.g., FNGA index or related asset), covering approximately mid-2021 to January 22, 2018, with 896 trading days. The dates are organized into 18 chunks (dates_19 to dates_36), with 50 dates per chunk for 19–35 and 46 dates for chunk 36 (excluding weekends and possibly holidays). This library complements FNGAdataDates_Part1 to complete the 1,846-date dataset and is designed to align with the FNGAopenPrices and FNGAclosePrices libraries for backtesting, analysis, or visualization in Pine Script.
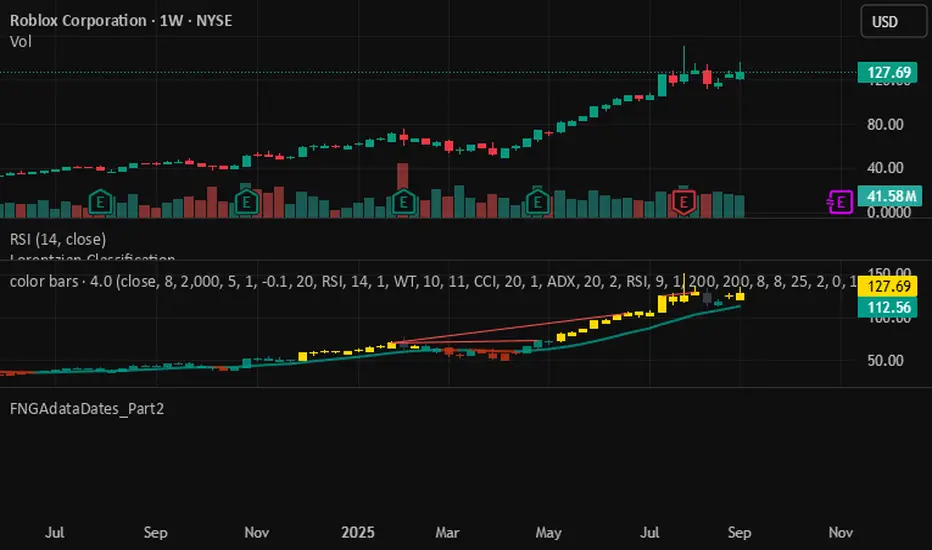
FNGAdataDates_Part1FNGAdataDates_Part1 provides historical trading dates for a financial instrument (e.g., FNGA index or related asset) from May 23, 2025, to approximately mid-2021, covering 950 trading days. The dates are organized into 19 chunks (dates_0 to dates_18), each containing 50 timestamps representing trading days (excluding weekends and possibly holidays). This library is part one of a two-part set due to Pine Script token limits and must be used with FNGAdataDates_Part2 for the complete dataset (1,846 dates). It is designed to align with the FNGAopenPrices and FNGAclosePrices libraries for backtesting, technical analysis, or visualization in Pine Script.
Multi-Indicator Buy/Sell Signals (EMA, RSI, MACD)Great base for a momentum + trend strategy. With the RSI dot

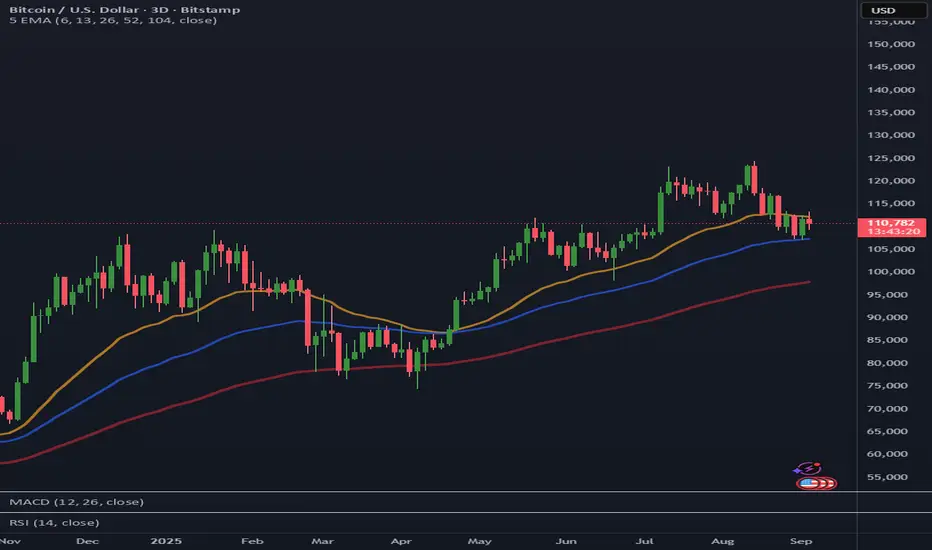
Multiple EMAMultiple EMA Indicator
This script overlays five customizable Exponential Moving Averages (EMAs) on your chart with color styling and transparency matching TradingView’s palette (≈65% opacity).
🔹 Features
Five EMAs with fully customizable lengths (default: 6, 13, 26, 52, 104)
Thicker line weights for longer-term EMAs (26, 52, 104) to emphasize trend bias
Short-term EMAs (6, 13) hidden by default but toggleable in settings
Custom color codes with opacity applied (35% transparency) for a smoother look
Adjustable price source input (close, open, hl2, etc.)
🔹 Best For
Swing traders and trend followers
Traders seeking a clear, color-coded, and visually optimized EMA setup
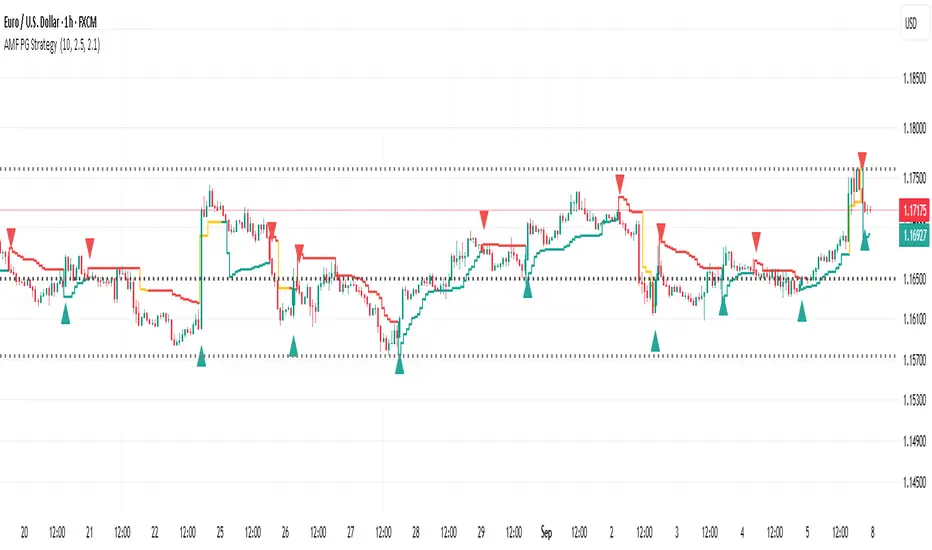
AMF PG Strategy_v2The AMF PG Strategy (Praetorian Guard) is an advanced trading system designed to seamlessly adapt to market conditions. Its unique structure balances precise entries with intelligent protection, giving traders confidence in both trending and volatility environments.
Key points include:
Adaptive Core (AMF Engine) – A dynamic framework that automatically adjusts for clearer long- and short-term opportunities and generates a robust tracking line.
Praetorian Guard – A built-in protective shield that activates in extreme conditions and helps stabilize performance when markets become turbulent.
Versatility – Effective across multiple timeframes, from scalping to swing trading, without constant parameter adjustments.
Clarity – Clear visual signals and color-coded monitoring for instant decision-making.
This strategy is designed for traders who want more than just entries and exits; it offers a command center for disciplined, adaptable, and resilient trading.
Disclaimer:
It should be noted that no strategy is guaranteed. This strategy does not provide buy-sell-hold advice. Responsibility rests with the user.
Version 2: Bugs overlooked in Version 1 have been corrected and improvements have been made.
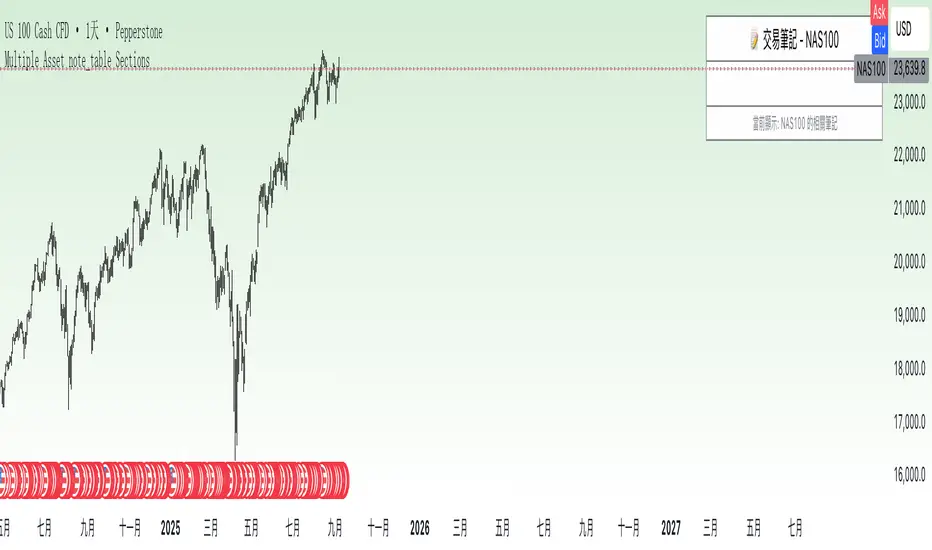
Multiple Asset note_table Sections### Features
- **Expanded to 10 independent Sections**: Each Section has a title, content, and associated asset
- **Asset-based filtering**: Section only displays when the Section's asset name is empty or matches the current chart asset
- **Empty asset setting retained**: If Section asset name is left blank, that Section will display across all assets
- **Automatic display of current asset**: Current asset name is automatically shown in the header and footer
### Usage Instructions
1. Each Section can be assigned a specific asset name, such as "BTCUSDT", "ETHUSDT", etc.
2. A Section will only display when the current chart asset matches the asset specified for that Section
3. If you want a Section to display across all assets, simply leave the asset name blank for that Section
4. Each Section has independent title and content that can be customized as needed
5. When switching to different trading instruments, the indicator automatically displays notes relevant to the current instrument
TEMA Ribbon 9/13/15/21 – Smooth trend shifts, less lag, clearer“TEMA Ribbon 9/13/15/21 – Smooth trend shifts, less lag, clearer bias.”
Plots four Triple Exponential Moving Averages (9, 13, 15, 21) with shaded zones for quick trend visualization. Helps identify short- vs. medium-term momentum shifts with reduced lag compared to standard EMAs.
Recommended Usage:
Best applied on 5M–1H intraday charts for momentum and trend confirmation.
Use the 9 & 13 TEMA for short-term momentum shifts.
Use the 15 & 21 TEMA for medium-term bias.
Look for crossovers and alignment (all fast TEMAs above/below slow ones) to confirm bullish or bearish conditions.
Shaded zones help visualize when the short- and medium-term trends converge or diverge, signaling potential entry or exit points.
Combine the TEMA Ribbon with VWAP or session-based trading (e.g., London/New York Killzones) to filter signals.
Trade only in the direction of VWAP bias (price above VWAP → favor longs, below → favor shorts).
Within Killzones, use TEMA alignment (9/13 above 15/21 = bullish trend, or opposite for bearish) as confirmation before entries.
This reduces false signals and locks entries to periods of high liquidity and volatility, where TEMA shines.
//@version=5
indicator("TEMA 9/13/15/21", overlay=true)
// Quelle
src = close
// Funktion: TEMA
tema(src, length) =>
e1 = ta.ema(src, length)
e2 = ta.ema(e1, length)
e3 = ta.ema(e2, length)
3.0 * e1 - 3.0 * e2 + e3
// TEMA-Berechnung
t9 = tema(src, 9)
t13 = tema(src, 13)
t15 = tema(src, 15)
t21 = tema(src, 21)
// Plots
p9 = plot(t9, "TEMA 9", color=color.teal, linewidth=2)
p13 = plot(t13, "TEMA 13", color=color.aqua, linewidth=2)
p15 = plot(t15, "TEMA 15", color=color.orange, linewidth=2)
p21 = plot(t21, "TEMA 21", color=color.fuchsia, linewidth=2)
// Einfaches Fill (zwischen schnellstem und langsamstem)
fill(p9, p21, color=color.new(color.gray, 85))
fill(p13, p15, color=color.new(color.gray, 92))

3-Candle Swing Highs & Lows//@version=5
indicator("3-Candle Swing Highs & Lows", overlay=true, max_lines_count=1000)
// Inputs
highColor = input.color(color.red, "Swing High (Unbroken)")
highBreachCol = input.color(color.green, "Swing High (Breached)")
lowColor = input.color(color.blue, "Swing Low (Unbroken)")
lowBreachCol = input.color(color.orange, "Swing Low (Breached)")
// Arrays for storing lines and prices
var line highLines = array.new_line()
var float highPrices = array.new_float()
var line lowLines = array.new_line()
var float lowPrices = array.new_float()
// --- Swing High condition ---
// We check candle (the middle one) against candle and candle
isSwingHigh = high > high and high > high
// --- Swing Low condition ---
isSwingLow = low < low and low < low
// If swing high found (confirmed after bar closes)
if isSwingHigh
newHigh = line.new(bar_index - 1, high , bar_index, high , extend=extend.right, color=highColor, width=2)
array.push(highLines, newHigh)
array.push(highPrices, high )
// If swing low found (confirmed after bar closes)
if isSwingLow
newLow = line.new(bar_index - 1, low , bar_index, low , extend=extend.right, color=lowColor, width=2)
array.push(lowLines, newLow)
array.push(lowPrices, low )
// Update line colours for swing highs
for i = 0 to array.size(highLines) - 1
ln = array.get(highLines, i)
lvl = array.get(highPrices, i)
if close > lvl
line.set_color(ln, highBreachCol)
else
line.set_color(ln, highColor)
// Update line colours for swing lows
for i = 0 to array.size(lowLines) - 1
ln = array.get(lowLines, i)
lvl = array.get(lowPrices, i)
if close < lvl
line.set_color(ln, lowBreachCol)
else
line.set_color(ln, lowColor)
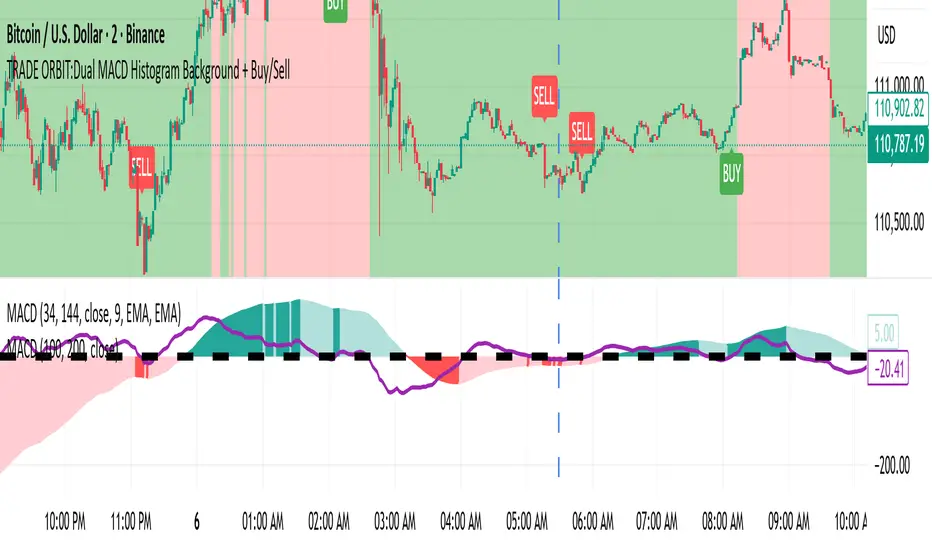
TRADE ORBIT:Dual MACD Histogram Background + Buy/SellDescription:
This indicator combines two MACD systems to provide clear trend, buy/sell signals, and identifies potential discount and premium zones for smarter entries and exits.
Features:
MACD #1 (100, 200, 50) – Trend & Background Coloring
Histogram > 0 → Green background (Bullish trend)
Histogram < 0 → Red background (Bearish trend)
MACD #2 (34, 144, 9) – Buy/Sell Signals
Buy Signal: Histogram crosses above zero and MACD #1 background is green
Sell Signal: Histogram crosses below zero and MACD #1 background is red
Signals are plotted as tiny labels directly on the chart
Discount & Premium Zones
Discount Zone: Price below MACD #1 slow EMA → highlighted in green
Premium Zone: Price above MACD #1 slow EMA → highlighted in red
Helps identify “cheap” (potential buy) and “expensive” (potential sell) areas relative to trend
Reference Plots (Optional)
MACD #1 & #2 histograms plotted as columns for visual confirmation
Usage:
Use MACD #1 background to identify the prevailing trend.
Wait for MACD #2 cross signals aligned with trend for buy/sell confirmation.
Discount and premium zones help time entries and exits more efficiently.
Ideal For:
Swing traders and position traders who want to combine trend-following signals with overbought/oversold zones.
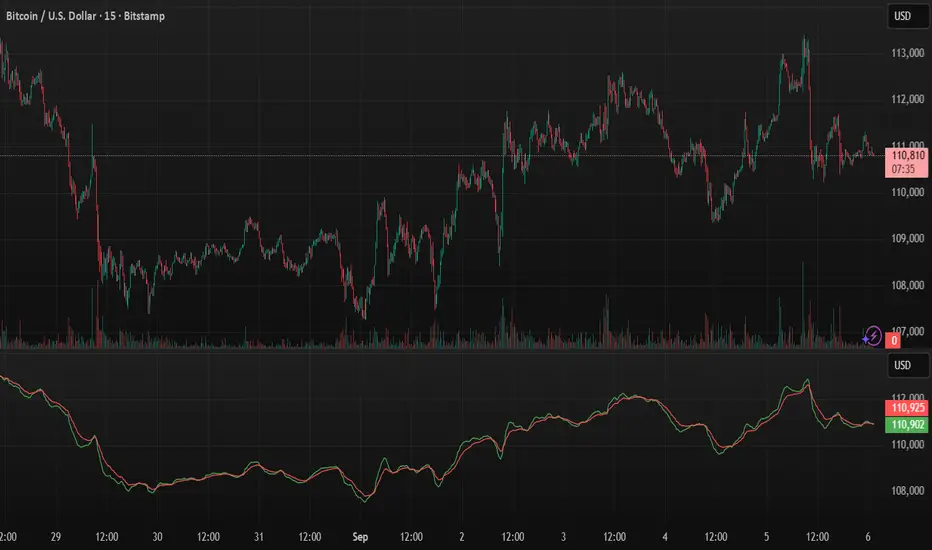
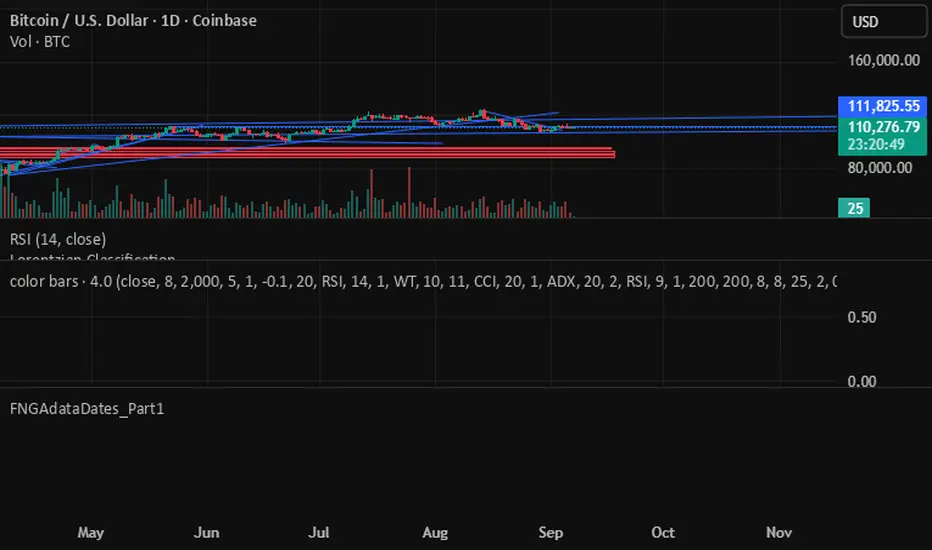
BTCUSD Weekly Sell Signal – Visual Trade SetupThis indicator highlights a long-term SELL signal on BTCUSD (Bitcoin vs US Dollar) based on weekly chart structure.
Levels included:
— Entry: 11080
— Stop Loss: 11160
— Take Profits: 11040, 11000, 10960
A visual aid for swing traders to monitor bearish momentum on higher timeframes.
🟢 For educational use only.
❗ Always combine with your personal analysis and manage risk responsibly.


TRADE ORBIT:Dual MACD + HEMA TrendThis indicator combines dual MACD histograms with a Harmonic EMA (HEMA) trend overlay to provide comprehensive trend analysis, buy/sell signals, and dynamic support/resistance zones.
Features:
Dual MACD System:
Background Coloring: Uses MACD(100,200,50) histogram to color the chart background:
Green = bullish momentum
Red = bearish momentum
Buy/Sell Signals: Uses MACD(34,144,9) histogram crossovers for trade signals:
BUY Signal: Histogram crosses above zero and background is green
SELL Signal: Histogram crosses below zero and background is red
Signals are plotted as labels on the chart.
HEMA Trend Overlay:
Uses short and long HEMA lines (default 20 & 40) to detect trend direction.
Colors bars dynamically based on trend:
Green = bullish
Red = bearish
Gray = neutral or indecisive
Provides gradient fill between HEMA lines to visually highlight trend strength.
Trend Boxes & Markers:
Bullish/bearish boxes highlight areas of potential support/resistance based on HEMA crossovers.
Markers (▲ / ▼) appear when the price interacts with trend boxes for easy visual confirmation.
Alerts:
HEMA crossovers (bullish/bearish)
Price tests of bullish/bearish boxes
Optionally, can add alerts for MACD BUY/SELL signals.
Visualization:
MACD histograms plotted as columns for reference
Dynamic bar colors reflecting HEMA trend
Combined view gives a multi-layered trend analysis on a single chart.
Use Case:
Ideal for traders who want to filter trades by overall trend (background MACD), time precise entries/exits (MACD signals), and confirm trend strength (HEMA overlay) in a single indicator.

交易区本地时间This is a practical timezone display indicator designed specifically for forex and global market traders, showing real-time current times of three major financial centers in a clear table format at the top-right corner of the chart: Tokyo, New York, and London.
✨ Key Features
🗾 Tokyo Time - Asian trading session reference
🗽 New York Time - American trading session reference
🏛️ London Time - European trading session reference
📅 Complete Date & Time - Display format: MM-DD HH:MM
🔄 Automatic DST - Smart handling of daylight saving time transitions
🎨 Color Coding - Different colors for different timezone identification
⚡ Real-time Updates - Based on current timestamp, accurate with no delay
💼 Use Cases
Forex Traders - Track major financial center opening/closing times
Global Market Analysis - Understand market activity across different timezones
News Trading - Master timing of important economic data releases
Multi-timezone Coordination - Time management tool for international investors
这是一个专为外汇和全球市场交易者设计的实用时区显示指标,在图表右上角以清晰的表格形式实时显示三大主要金融中心的当前时间:东京、纽约和伦敦。
✨ 主要功能
🗾 东京时间 - 亚洲交易时段参考
🗽 纽约时间 - 美洲交易时段参考
🏛️ 伦敦时间 - 欧洲交易时段参考
📅 完整日期时间 - 显示格式:MM-DD HH:MM
🔄 自动夏令时 - 智能处理冬令时/夏令时切换
🎨 色彩区分 - 不同颜色标识不同时区
⚡ 实时更新 - 基于当前时间戳,准确无延迟
💼 适用场景
外汇交易者 - 把握各大金融中心开盘收盘时间
全球市场分析 - 了解不同时区的市场活跃度
新闻交易 - 掌握重要经济数据发布时间
多时区协调 - 国际投资者的时间管理工具

Marubozu Detector with Dynamic SL/TP
Strategy Overview:
This indicator detects a "Marubozu" bullish pattern or a “Marubozu” bearish pattern to suggest potential buy and sell opportunities. It uses dynamic Stop Loss (SL) and Take Profit (TP) management, based on either market volatility (ATR) or liquidity zones.
This tool is intended for educational and informational purposes only.
Key Features:
Entry: Based on detecting Marubozu bullish or bearish candle pattern.
Exit: Targets are managed through ATR multiples or previous liquidity levels (swing highs or swing lows).
Smart Liquidity: Optionally identify deeper liquidity targets.
Full Alerts: Buy and Sell signals supported with customizable alerts.
Visualized Trades: Entry, SL, and TP levels are plotted on the chart.
User Inputs:
ATR Length, ATR Multipliers
Take Profit Mode (Liquidity/ATR)
Swing Lookback and Strength
Toggleable Buy/Sell alerts
All Time Frames
📖 How to Use:
Add the Indicator:
Apply the script to your chart from the TradingView indicators panel.
Look for Buy Signals:
A buy signal is triggered when the script detects a "Marubozu" bullish pattern.
Entry, Stop Loss, and Take Profit levels are plotted automatically.
Look for Sell Signals:
A Sell signal is triggered when the script detects a "Marubozu" bearish pattern.
Entry, Stop Loss, and Take Profit levels are plotted automatically.
Choose Take Profit Mode:
ATR Mode: TP is based on a volatility target.
Liquidity Mode: TP is based on past swing highs.
Set Alerts (Optional):
Enable Buy/Sell alerts in the settings to receive real-time notifications.
Practice First:
Always backtest and paper trade before live use.
📜 Disclaimer:
This script does not offer financial advice.
No guarantees of profit or performance are made.
Use in demo accounts or backtesting first.
Always practice proper risk management and seek advice from licensed professionals if needed.
✅ Script Compliance:
This script is designed in full accordance with TradingView’s House Rules for educational tools.
No financial advice is provided, no performance is guaranteed, and users are encouraged to backtest thoroughly.

sHip Crypto Buy/Sell Pro BTC 15minThis is a 15min BTC buy sell indicator that is made by Ai. Have not tested yet but you can give it a go if you want.