Info TablesThis indicator provides two clear tables showing key market metrics, helping you make sense of price action. Each metric is chosen to give you practical insights, and you can customize the display to fit your needs.
## Key Features and Why Metrics Matter
### Main Table Metrics
- **ML-Predicted Price**:
- **What**: A price forecast based on a machine learning model using past price, volume, and RSI data.
- **Why**: Shows where the market might head, helping you gauge if the current price is too high or low compared to the prediction. Useful for spotting potential reversals or continuations.
- **Deviation %**:
- **What**: The percentage difference between the current price and the predicted price.
- **Why**: Tells you how far the market is straying from the ML forecast. A large deviation might suggest overbought/oversold conditions or a trend shift.
- **VWAP Deviation %**:
- **What**: The percentage difference between the current price and the Volume Weighted Average Price (VWAP).
- **Why**: VWAP is a benchmark for fair price; deviation shows if the market is stretched above or below this level, aiding entries or exits.
- **FRED UNRATE % Change**:
- **What**: The percentage change in the U.S. unemployment rate from FRED data.
- **Why**: Offers macro context. Rising unemployment can signal economic weakness, impacting market sentiment, while falling rates may boost confidence.
- **Open Interest**:
- **What**: The total number of open futures contracts for MESM2.
- **Why**: High open interest indicates strong market participation, often tied to liquidity and conviction. Low levels might suggest indecision or lack of commitment.
- **COT Commercial Long/Short**:
- **What**: Commitment of Traders (COT) data showing commercial traders’ long and short positions.
- **Why**: Reveals how big players (hedgers) are positioned. More longs than shorts can hint at bullish sentiment, while more shorts suggest bearish views.
### New Metrics Table
- **QQE Bias**:
- **What**: A momentum indicator based on a smoothed RSI with trailing stops.
- **Why**: Highlights bullish (green) or bearish (red) momentum, helping you confirm short-term trade directions or avoid choppy markets (gray).
- **Volume Momentum**:
- **What**: A score (1–20) comparing current volume to past volume over a lookback period.
- **Why**: High scores indicate strong buying/selling pressure, signaling potential breakouts or reversals. Low scores suggest weak participation.
- **ATR Volatility**:
- **What**: A score (1–20) based on the Average True Range, measuring price volatility.
- **Why**: High volatility warns of larger price swings, useful for setting stop-losses or avoiding trades in choppy conditions. Low volatility may indicate consolidation.
- **ADX Trend**:
- **What**: The Average Directional Index, measuring trend strength.
- **Why**: High ADX values confirm strong trends, guiding you to trade with the trend. Low values suggest range-bound markets, better for mean-reversion strategies.
- **RSI**:
- **What**: Relative Strength Index, showing overbought (>70) or oversold (<30) conditions.
- **Why**: Helps identify potential reversal points or confirm momentum. Useful for timing entries in overextended markets.
- **Frahm Volatility**:
- **What**: A score (1–20) based on true range over a time window (e.g., 24 hours).
- **Why**: Measures short-term volatility, helping you adjust position sizes or avoid trading during erratic price moves.
- **Frahm Avg Candle (Ticks)**:
- **What**: The average candle size in ticks over the same time window.
- **Why**: Indicates typical price movement, useful for setting realistic profit targets or stop-losses based on recent market behavior.
### Additional Features
- **Plotted Predicted Price**:
- **What**: An optional line showing the ML-predicted price on the chart.
- **Why**: Lets you visually compare the predicted price to actual price action, making it easier to spot divergence or alignment.
- **Custom Gradient Colors**:
- **What**: User-defined colors for high/low values in both tables.
- **Why**: Makes it quick to see which metrics are at extremes (e.g., high deviation or strong ADX), improving decision-making under pressure.
- **Alerts**:
- **What**: Notifications for high/low Frahm volatility and bullish/bearish QQE Bias.
- **Why**: Keeps you informed of critical changes (e.g., volatility spikes or momentum shifts) without needing to watch the chart constantly.
## Customization Options
- **ML Matrix Inputs**:
- Adjust the **ML Lookback Period** (e.g., 200–300 for volatile markets, 1000 for trends) to control how much history the ML model uses.
- Set the **ML RSI Period** (e.g., 7–10 for fast markets, 20 for calm) to tweak the RSI’s sensitivity in the prediction.
- **Plot Settings**:
- Toggle the predicted price line and choose its color (default blue) for clear visibility.
- **Table Settings**:
- Position tables (top/bottom, left/center/right) and show/hide them to focus on what matters.
- **Gradient Color Settings**:
- Pick colors for high/low values in each table to match your chart or preferences.
- **Timeframe & Thresholds**:
- Set specific timeframes (e.g., 5-minute for smoother data) and thresholds (e.g., tighter deviation ranges) for each metric to suit your trading style.
## Ideal Use Case
This indicator is perfect for MESM2 traders navigating fast-moving markets. The Main Table gives you a big-picture view (predicted price, macro data, and positioning), while the New Metrics Table zooms in on momentum and volatility, ideal for scalping or trend trades. Use it to confirm entries, set stops, or avoid choppy periods.
## Why It’s Valuable
The **ML Matrix - Tables Only** puts essential data at your fingertips. Each metric is selected to answer a specific question—Is the price overextended? Is momentum building? Are big players bullish? Are conditions too volatile?—helping you trade with clarity and confidence, whether you’re catching quick moves or riding longer trends.
Penunjuk dan strategi

RAHA Strategy - LongThe RAHA Long Strategy is based on a unique average formula called RAHA – an acronym for:
Roni's Adjusted Hybrid Average – a formula developed by Aharon Roni Pesach.
What is RAHA?
This is an adjusted hybrid average that gives different weight to outliers:
The extreme values (particularly high or low) receive a lower weight.
The calculation is based on the standard deviation and average of the data.
This results in a more sensitive but stable average that does not ignore outliers – but rather considers them in proportion.
The RAHA Long Strategy identifies a positive trend and enters when clear technical conditions are met, such as an upward slope of RAHA 40, RAHA 10 crossing above RAHA 20, and the absence of a sequence of 3 green candles.
Entry is also made in the exceptional case of a green candle below the Bollinger Band.
The position size is determined by 1% of the capital divided by the stop.
The exit is carried out by a stop below the low, or under additional conditions above the profit target (TP).
אסטרטגיית הלונג RAHA מבוססת על נוסחת ממוצע ייחודית בשם RAHA – ראשי תיבות של :
Roni's Adjusted Hybrid Average – נוסחה שפיתח אהרון רוני פסח.
מהו RAHA?
מדובר בממוצע היברידי מתואם המעניק משקל שונה לנתונים חריגים:
הערכים הקיצוניים (גבוהים או נמוכים במיוחד) מקבלים משקל נמוך יותר.
החישוב מבוסס על סטיית התקן והממוצע של הנתונים.
כך מתקבל ממוצע רגיש אך יציב יותר, שאינו מתעלם מהחריגים – אלא מתחשב בהם בפרופורציה.
אסטרטגיית הלונג RAHA מזהה מגמה חיובית ומבצעת כניסה כשמתקיימים תנאים טכניים ברורים, כמו שיפוע עולה של RAHA 40, חציית RAHA 10 מעל RAHA 20, והיעדר רצף של 3 נרות ירוקים.
הכניסה מבוצעת גם במקרה חריג של נר ירוק מתחת לרצועת בולינגר.
גודל הפוזיציה נקבע לפי 1% מההון חלקי הסטופ.
היציאה מבוצעת לפי סטופ מתחת לנמוך, או בתנאים נוספים מעל יעד הרווח (TP).

NFP RangesThis simple indicator will mark the high and low prices during NFP days. You an choose how many NFP days you want to go back and a gradient to use for the levels.
The NFP dates are hard coded from 2023 through 2029. If this script survives past 2029, it should be simple to add more dates.

Leveraged Liquidation ZonesOVERVIEW
This indicator estimates potential liquidation zones based on leveraged positions (25x, 50x, 75x, 100x). It visually displays upper and lower bounds for each leverage tier, allowing traders to infer areas where the market might be seeking liquidity.
CONCEPTS
In leveraged markets, especially crypto derivatives, price often moves towards zones of high liquidation potential — areas where traders using high leverage are likely to be stopped out. These zones represent concentrations of liquidity that can serve as targets for price movement.
This script models simplified liquidation areas by calculating the price range within which positions using specific leverage levels would be at risk, assuming no maintenance margin and using the previous candle close as a reference.
FEATURES
Visual zones for 25x, 50x, 75x, and 100x leverage levels.
Customizable visibility and colors for each leverage tier.
Real-time zone calculation based on the previous candle close.
Simple and clean design to overlay directly on price action.
USAGE
Use this tool to identify areas of liquidity accumulation or potential price magnet zones. High-leverage liquidations often lead to volatile movements when triggered, so tracking these zones can help anticipate breakout or reversal behavior.
You can toggle individual leverage levels via the settings panel, and adjust color transparency to suit your chart theme. This tool is most effective when combined with volume spikes, order book analysis, or high-frequency behavior.

TSLA Reversal Alert: Harmonic + VWAP + RSI DivergenceWorking on a Bearish Harmonic Alert, and Bullish Harmonic Alert

Price Reaction Analysis by Day of WeekOverview
The "Price Reaction Analysis by Day of Week" indicator is a tool that enables traders to analyze historical price reaction patterns to technical indicator signals on a selected day of the week. It examines price behavior on a chosen candle (from 1 to 30) in the next day or subsequent days after a signal, depending on the timeframe, and provides success rate statistics to support data-driven trading decisions. The indicator is optimized for timeframes up to 1 day (e.g., 1D, 12H, 8H, 6H, 4H, 1H, 15M), as the analysis relies on day-of-week comparisons. Lower timeframes generate more signals due to the higher number of candles per day.
Key Features
1. Flexible Technical Indicator Selection
Users can choose one of four technical indicators: RSI, SMI, MA, or Bollinger Bands. Each indicator has configurable parameters, such as:
RSI length, oversold/overbought levels.
SMI length, %K and %D smoothing, signal levels.
MA length.
Bollinger Bands length and multiplier.
2. Day-of-Week Analysis
The indicator allows users to select a day of the week (Monday, Tuesday, Wednesday, Thursday, Friday) for generating signals. It analyzes price reactions on a selected candle (from 1 to 30) in the next day or subsequent days after the signal. Examples:
On a daily timeframe, a signal on Monday can be analyzed for the first, fourth, or later candle (up to 30) in subsequent days (e.g., Tuesday, Wednesday).
On timeframes lower than 1 day (e.g., 12H, 8H, 6H, 4H, 1H, 15M), the analysis targets the selected candle in the next day or subsequent days. For example, on a 4H timeframe, you can analyze the second Tuesday candle following a Monday signal. The maximum timeframe is 1 day to ensure consistent day-of-week analysis.
3. Visual Signals
Signals for the analysis period are marked with background highlights in real-time when the indicator’s conditions are met. The last highlighted candle of the selected day is always analyzed. Arrows are displayed on the chart at the candle specified by the “Candles to Compare” setting (e.g., the first candle if set to 1):
Green upward triangles (below the candle) for successful buy signals (the closing price of the selected candle is higher than the signal candle’s close).
Red downward triangles (above the candle) for successful sell signals (the closing price of the selected candle is lower than the signal candle’s close).
Gray “x” marks for unsuccessful signals (no price reversal in the expected direction). Arrow positions are intuitive: buy signals below the candle, sell signals above. Highlights and arrows do not require waiting for future signals but are essential for calculating statistics.
Note: The first candle of the next day may appear shifted on the chart due to timezone differences, which can affect the timing of signal appearance.
4. Signal Conditions (Highlights) for Each Indicator
RSI: The oscillator is in oversold (buy) or overbought (sell) zones.
SMI: SMI returns from oversold (buy) or overbought (sell) zones.
MA: Price crosses the MA (upward for buy, downward for sell).
Bollinger Bands: Price returns inside the bands (from below for buy, from above for sell).
5. Success Rate Statistics
A table in the top-right corner of the chart displays:
The number of buy and sell signals for the selected day of the week.
The percentage of cases where the price of the selected candle in the next day or subsequent days reversed as expected (e.g., rising after a buy signal). Statistics are based on comparing the closing price of the signal candle with the closing price of the selected candle (e.g., first, fourth) in the next day or subsequent days.
Important: Statistics do not account for price movements within the candle or after its close. The price on the selected candle (e.g., fourth) may be lower than earlier candles but still higher than the signal candle, counting as a positive buy signal, though it does not guarantee profit.
6. Date Range
Users can specify the analysis date range, enabling strategy testing on historical data from a chosen period. Ensure the start and end dates are set correctly.
Applications
The indicator is designed for traders who want to leverage historical patterns for position planning. Examples:
On a 4-hour timeframe: If a sell signal highlight appears on Monday and statistics show an 80% chance that the fourth Tuesday candle is bearish, traders may consider playing a correction at the open of that candle.
On a daily timeframe: If a highlight indicates market overheating, traders may consider entering a position at the open of the first candle after the signal (e.g., Tuesday), provided statistics suggest an edge. Users can analyze the signal on the first candle and check later candles to validate results, increasing confidence in consistent patterns.
Key Settings
Indicator Type: Choose between RSI, SMI, MA, or Bollinger Bands.
Selected Day: Monday, Tuesday, Wednesday, Thursday, or Friday.
Candles to Compare: The number of the candle in the next day or subsequent days (from 1 to 30).
Indicator Parameters: Lengths, levels (e.g., oversold/overbought for RSI).
Background Colors: Configurable highlights for buy and sell signals.
Notes
Timeframes: The indicator is optimized for timeframes up to 1 day (e.g., 1D, 12H, 8H, 6H, 4H, 1H, 15M), as the analysis relies on day-of-week patterns. Timeframes lower than 1 day generate more signals due to the higher number of candles per day.
Candle Shift: The first candle of the next day may appear shifted on the chart due to timezone differences, affecting the timing of signals across markets or platforms.
Statistical Limitations: Results are based on the closing prices of the selected candle, ignoring fluctuations in earlier candles, within the candle, or subsequent price movements. Traders must assess whether entering at the open or after the close of the selected candle is profitable.
Testing: Effectiveness depends on historical data and parameter settings. Testing different configurations across markets and timeframes is recommended.
Who Is It For?
Swing and position traders who base decisions on technical analysis and historical patterns.
Market analysts seeking patterns in price behavior by day of the week.
TradingView users of all experience levels, thanks to an intuitive interface and flexible settings.

IntermarketWhat is Intermarket Analysis?
Intermarket analysis looks at how various asset classes influence each other. The key idea is that markets are interconnected, and movements in one can signal or predict movements in another. For example:
Stocks and Bonds: Rising bond yields (e.g., US 10-year Treasury) often pressure stock prices downward.
Commodities and Forex: A rising US Dollar (USD) typically weakens gold (XAU/USD) prices due to their inverse relationship.
Forex and Equities: Strong economic data boosting equities might strengthen the USD.
This method helps you confirm trends, anticipate reversals, or avoid false signals in your EMA 10/20 crossover strategy.
Key Intermarket Relationships
USD Index (DXY) and Gold (XAU/USD):
Correlation: Inverse. When DXY rises (stronger USD), gold often falls, and vice versa.
Indicator: Track DXY on a separate chart. Use a 50-period SMA or RSI to spot overbought/oversold conditions in USD strength.
Application: If your EMA 10/20 gives a buy signal on gold but DXY is overbought (RSI > 70), it might be a false signal—wait for DXY to cool off.
US 10-Year Treasury Yields and Equities (e.g., S&P 500):
Correlation: Inverse. Higher yields increase borrowing costs, pressuring stocks.
Indicator: Use a 200-day EMA on yields (e.g., ^TNX) and compare with S&P 500’s 50-day EMA.
Application: If yields are trending up (above 200 EMA) while your EMA 10/20 signals a stock buy, consider it risky—cross-check with macro data.
Crude Oil (WTI/Brent) and Gold:
Correlation: Positive. Both are inflation hedges, so they often move together during economic uncertainty.
Indicator: Apply a MACD (12, 26, 9) on oil prices to confirm trend direction.
Application: If oil’s MACD shows a bullish crossover and your gold buy signal aligns, it strengthens the case for a trend.
Bond Yields and USD:
Correlation: Positive. Rising yields support a stronger USD.
Indicator: Use a Stochastic Oscillator (14, 3, 3) on DXY to spot momentum shifts.
Application: If Stochastic is overbought on DXY and yields are high, a gold sell signal from EMA 10/20 might be more reliable.
How to Apply Intermarket Analysis to Your EMA 10/20 Strategy
Your current strategy uses EMA 10/20 crossovers for entry/exit, with SL at swing low/high and no TP until an opposite crossover. Here’s how to integrate intermarket analysis:
Confirmation: Before acting on a buy signal (EMA 10 > EMA 20), check if DXY is weakening (e.g., below 50 SMA) or oil is rising (MACD bullish). This supports a gold uptrend.
Divergence Warning: If your EMA 10/20 buy signal occurs but DXY is trending up (strong USD) or yields are spiking, it might indicate a false breakout—hold off.
Macro Context: On July 02, 2025, 08:30 PM WIB, watch for upcoming US Jobless Claims (3-4 July). A weak report could boost gold and weaken USD, aligning with your buy signal.

Intermarket Analisis V.1What is Intermarket Analysis?
Intermarket analysis looks at how various asset classes influence each other. The key idea is that markets are interconnected, and movements in one can signal or predict movements in another. For example:
Stocks and Bonds: Rising bond yields (e.g., US 10-year Treasury) often pressure stock prices downward.
Commodities and Forex: A rising US Dollar (USD) typically weakens gold (XAU/USD) prices due to their inverse relationship.
Forex and Equities: Strong economic data boosting equities might strengthen the USD.
This method helps you confirm trends, anticipate reversals, or avoid false signals in your EMA 10/20 crossover strategy.
Key Intermarket Relationships
USD Index (DXY) and Gold (XAU/USD):
Correlation: Inverse. When DXY rises (stronger USD), gold often falls, and vice versa.
Indicator: Track DXY on a separate chart. Use a 50-period SMA or RSI to spot overbought/oversold conditions in USD strength.
Application: If your EMA 10/20 gives a buy signal on gold but DXY is overbought (RSI > 70), it might be a false signal—wait for DXY to cool off.
US 10-Year Treasury Yields and Equities (e.g., S&P 500):
Correlation: Inverse. Higher yields increase borrowing costs, pressuring stocks.
Indicator: Use a 200-day EMA on yields (e.g., ^TNX) and compare with S&P 500’s 50-day EMA.
Application: If yields are trending up (above 200 EMA) while your EMA 10/20 signals a stock buy, consider it risky—cross-check with macro data.
Crude Oil (WTI/Brent) and Gold:
Correlation: Positive. Both are inflation hedges, so they often move together during economic uncertainty.
Indicator: Apply a MACD (12, 26, 9) on oil prices to confirm trend direction.
Application: If oil’s MACD shows a bullish crossover and your gold buy signal aligns, it strengthens the case for a trend.
Bond Yields and USD:
Correlation: Positive. Rising yields support a stronger USD.
Indicator: Use a Stochastic Oscillator (14, 3, 3) on DXY to spot momentum shifts.
Application: If Stochastic is overbought on DXY and yields are high, a gold sell signal from EMA 10/20 might be more reliable.
How to Apply Intermarket Analysis to Your EMA 10/20 Strategy
Your current strategy uses EMA 10/20 crossovers for entry/exit, with SL at swing low/high and no TP until an opposite crossover. Here’s how to integrate intermarket analysis:
Confirmation: Before acting on a buy signal (EMA 10 > EMA 20), check if DXY is weakening (e.g., below 50 SMA) or oil is rising (MACD bullish). This supports a gold uptrend.
Divergence Warning: If your EMA 10/20 buy signal occurs but DXY is trending up (strong USD) or yields are spiking, it might indicate a false breakout—hold off.
Macro Context: On July 02, 2025, 08:30 PM WIB, watch for upcoming US Jobless Claims (3-4 July). A weak report could boost gold and weaken USD, aligning with your buy signal.

LaCrazy Smash CandleLaCrazy Smash Candle highlights powerful engulfing candles that signal potential momentum reversals or breakout continuation.
Smash Long: The candle's low touches or dips below the prior candle's low, then closes above the previous high with a strong body (minimum % of the candle range).
Smash Short: The candle's high touches or exceeds the prior high, then closes below the previous low with a strong body.
These “Smash” moves often occur at key pivot points, signaling decisive rejections or trend continuation. Customize the body strength filter to match your strategy needs.

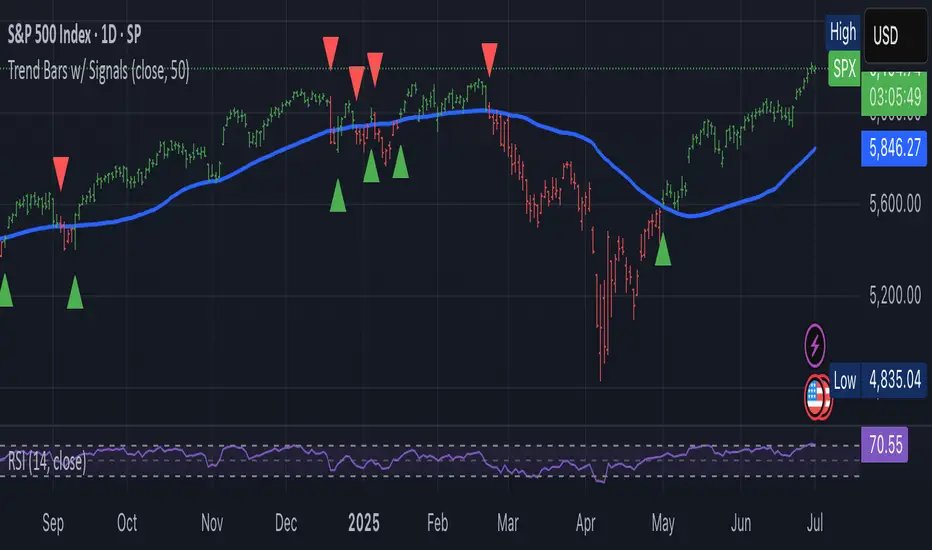
Trend-Following Colored Bars w/ SignalsTheTechnicalTraders trendfollowing
Easy way to follow the trend.
EMA 50/75/120 Golden & Death Cross Strategyuy: When all EMAs are aligned in golden cross order.
Sell: When all EMAs are aligned in death cross order.
Color Coding:
Green: All EMAs rising
Red: All EMAs falling
Gray: Mixed movement


Simple 20 SMAThe Simple 20 SMA is a technical analysis indicator that calculates the average closing price of an asset over the last 20 candles (bars). It smooths out short-term price fluctuations to help traders identify the overall trend direction.
How It Works:
It takes the last 20 closing prices, adds them together, and divides by 20.
The result is plotted as a smooth line on the chart, updating with each new candle

Az's EMA Scalper with Trend Confirmation (Fast TF)Az's EMA Scalper with Trend Confirmation combines fast-moving average signals with multi-timeframe trend analysis for precision intraday trading. The strategy uses a customizable moving average (7 types including EMA, HMA, ALMA) applied to Heikin-Ashi or regular candles on user-defined timeframes.
Core Mechanics:
Trend Identification:
Calculates MA values for open/close/high/low prices
Determines trend direction Bullish (green) and bearish (red)
Entry Signals:
Long entries when MA_close crosses above MA_open
Short entries when MA_close crosses below MA_open
Trade filters: LONG/SHORT/BOTH/NONE
Risk Management:
Fixed stop loss (points)
Fixed take profit (points)
Auto-position closing for directional modes
Visual Features:
Colored trend cloud (bullish/bearish)
Optional MA plots for close/high/low
Customizable colors and transparency
Optimized For:
Fast timeframes (1-15min charts)
Configurable trend confirmation (any higher timeframe)
Backtesting window control
The strategy simplifies price action into clear visual trends while maintaining flexibility through 15+ input parameters. Trades align with the dominant trend direction shown by the colored MA cloud, with exits triggered by profit targets, stop losses, or counter-trend MA crosses.

TRADER_3DThis indicator is derived from the sum of moving averages. Price charts sometimes react to the areas of this indicator. You cannot rely on this indicator alone and enter a trade only by reacting to these bands. This is wrong and will lower your win rate. Instead, wait for the remaining conditions to form before entering a trade, for example with full-body candles or a multi-time frame look.

Dynamic Sniper ProDynamic Sniper Pro - Binary Options Signal
Description:
Dynamic Sniper Pro is a powerful Pine Script v6 indicator designed for binary options trading. It combines Exponential Moving Averages (EMAs), Relative Strength Index (RSI), and an optional ATR filter to generate precise buy and sell signals. Ideal for short-term charts like 1-minute, this indicator helps traders spot trend reversals and breakouts with clear visual arrows. Tested on CAD/JPY, it recently delivered actionable signals during the morning session on July 01, 2025.
How It Works:
Buy Signal (Green Arrow): Triggered when the closing price exceeds both the 3-period Fast EMA and 8-period Slow EMA, RSI drops below the oversold level (default 40), and (if ATR filter is on) the price breaks above the Slow EMA + 0.15 * ATR. Enter a call option at the next candle open.
Sell Signal (Red Arrow): Triggered when the closing price falls below both EMAs, RSI rises above the overbought level (default 60), and (if ATR filter is on) the price breaks below the Slow EMA - 0.15 * ATR. Enter a put option at the next candle open.
Key Features:
Customizable parameters: Adjust EMA lengths, RSI periods, oversold/overbought levels, and ATR multiplier.
Optional ATR filter to reduce whipsaw entries.
Visual alerts with arrows and background highlights.
Compatible with any forex pair or timeframe—optimize for your strategy!
Settings:
Fast EMA Length: 3 (short-term trend)
Slow EMA Length: 8 (trend confirmation)
RSI Length: 14 (default smoothness)
Oversold Level: 40 (tweak for sensitivity)
Overbought Level: 60 (tweak for sensitivity)
Use ATR Filter: True (optional)
ATR Length: 14
ATR Multiplier: 0.3 (adjust for breakout strength)
Performance:
Backtesting on CAD/JPY 1-minute from 10:34–11:34 AM PDT on July 01, 2025, showed promising signal frequency. Results may vary—test on your preferred asset.
Tips:
Set alerts via the "Alerts" tab for real-time notifications.
Adjust oversold/overbought levels (e.g., 45/55) for fewer/more signals.
Best on volatile pairs like CAD/JPY or EUR/USD.
Disclaimer:
This indicator is for educational purposes only. Past performance is not indicative of future results. Use at your own risk, and consider market conditions and risk management.

ZYTX CCI SuperTrendZYTX CCI SuperTrend
The definitive integration of CCI and SuperTrend trend-following indicators, delivering exemplary performance in automated trading bots.

Last 10 Sessions: High, Low, Pivot, GapLast 10 Sessions: High, Low, Pivot, Gap
This indicator highlights the most important price levels from the last 10 completed trading sessions to help intraday and swing traders quickly spot potential support, resistance, and price reaction zones.
Key Features:
Previous Highs and Lows : Visualize the high and low from each of the past 10 sessions. These are the most commonly tested breakout and reversal points for day trading.
Session Pivots: The classic pivot formula ((High + Low + Close) / 3) for each of the last 10 sessions, often acting as a market “equilibrium” or intraday magnet.
Gaps: Displays the difference between each day’s open and the previous session’s close (“gap”), showing sentiment shifts and possible gap fill targets.
Clean, Faded Visuals: All lines and labels are subtly faded so your chart remains clear and uncluttered, with each level labeled by how many sessions ago it occurred.
Full Customization: Instantly toggle any level type (High, Low, Pivot, Gap) ON/OFF in settings, extend lines to the right, and adjust their forward length.
Bulletproof Logic: Never throws runtime errors. Lines and labels only display when valid data is present.
How to Use:
Use recent highs/lows for breakout, breakdown, or mean reversion trades.
Spot where multiple levels from past sessions cluster together for high-probability reversal or breakout areas.
Watch pivots for intraday bias, and gaps for sentiment and possible fill plays.
Perfect for all intraday timeframes.
If you want a powerful yet minimal map of where price is most likely to react, this indicator is for you!
Developed by

Last 10 Sessions: High, Low, Pivot, GapLast 10 Sessions: High, Low, Pivot, Gap
Version: v1.0
Developed by
This indicator highlights the most important price levels from the last 10 completed trading sessions to help intraday and swing traders quickly spot potential support, resistance, and price reaction zones.
Key Features:
Previous Highs and Lows: Visualize the high and low from each of the past 10 sessions. These are the most commonly tested breakout and reversal points for day trading.
Session Pivots: The classic pivot formula ((High + Low + Close) / 3) for each of the last 10 sessions, often acting as a market “equilibrium” or intraday magnet.
Gaps: Displays the difference between each day’s open and the previous session’s close (“gap”), showing sentiment shifts and possible gap fill targets.
Clean, Faded Visuals: All lines and labels are subtly faded so your chart remains clear and uncluttered, with each level labeled by how many sessions ago it occurred.
Full Customization: Instantly toggle any level type (High, Low, Pivot, Gap) ON/OFF in settings, extend lines to the right, and adjust their forward length.
Bulletproof Logic: Never throws runtime errors. Lines and labels only display when valid data is present.
How to Use:
Use recent highs/lows for breakout, breakdown, or mean reversion trades.
Spot where multiple levels from past sessions cluster together for high-probability reversal or breakout areas.
Watch pivots for intraday bias, and gaps for sentiment and possible fill plays.
Perfect for all intraday timeframes.
If you want a powerful yet minimal map of where price is most likely to react, this indicator is for you!

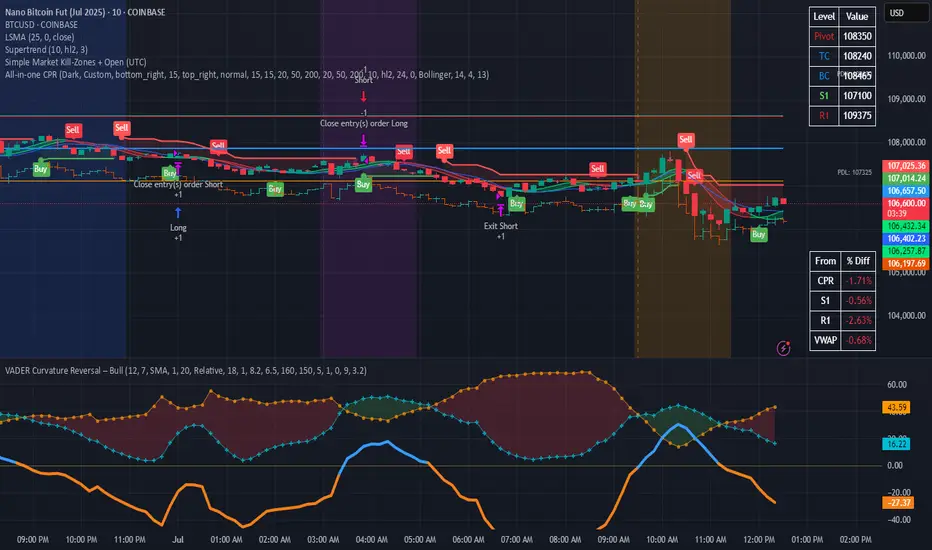
Simple Market Kill-Zones + Open (UTC)What it does
This Pine v6 indicator highlights the “kill-zones” around the big session opens—Asian (23:00–03:00 UTC), London (07:00–09:00 UTC) and New York (13:30–15:30 UTC)—by reading each bar’s actual UTC timestamp. It also draws dashed vertical lines at exactly 23:00, 07:00 and 13:30 UTC, so you never miss the liquidity ramps. Because it uses raw UTC hours/minutes, it stays accurate even when exchanges pause (e.g. Nano-BTC’s daily halt) or your chart’s display timezone changes.
Key Inputs
Show Asia/London/NY Kill Zone – toggle each shaded band on/off
Zone Colors – pick your own semi-transparent hues
Show Session-Open Lines – enable dashed verticals at the exact open times
Line Colors – customize the line opacity and style
How to use
Apply on your favorite timeframe (15 min–1 h is a sweet spot).
Toggle the zones you care about and pick readable colors.
Use the dashed lines as entry triggers or as visual bookmarks.
In your own Pine strategies, wrap order logic with the zone booleans to only trade when liquidity’s alive.
OBV-ROC Tilson Trend (Delta Toggle)Tracks the ROC of Obv via Tilson MA and plots slow and fast obv to see direction change

Stochastics Momentum Index with Buy Dotsstokastik ve ema kesişimlerinde buy sinyali ile aşırı alım noktalarını belirleme.

Candle Pattern Detector By Prashanth
Bullish Signal (🟢 below candle):
Plotted when any of the following occur:
✅ Bullish Engulfing
✅ Bullish Three-Line Strike
✅ Bottom wick ≥ % threshold (default: 80%)
Bearish Signal (🔴 above candle):
Plotted when any of the following occur:
❌ Bearish Engulfing
❌ Bearish Three-Line Strike
❌ Top wick ≥ % threshold (default: 80%)
Only one signal per candle (🟢 or 🔴)
If both bullish and bearish conditions happen on same candle → no signal
Helps simplify visual clutter while scanning for strong candle patterns
