Relative Performance Indicator by ComLucro - 2025_V01The "Relative Performance Indicator by ComLucro - 2025_V01" is a powerful tool designed to analyze an asset's performance relative to a benchmark index over multiple timeframes. This indicator provides traders with a clear view of how their chosen asset compares to a market index in short, medium, and long-term periods.
Key Features:
Customizable Lookback Periods: Analyze performance across three adjustable periods (default: 20, 50, and 200 bars).
Relative Performance Analysis: Calculate and visualize the difference in percentage performance between the asset and the benchmark index.
Dynamic Summary Label: Displays a detailed breakdown of the asset's and index's performance for the latest bar.
User-Friendly Interface: Includes customizable colors and display options for clear visualization.
How It Works:
The script fetches closing prices of both the asset and a benchmark index.
It calculates percentage changes over the selected lookback periods.
The indicator then computes the relative performance difference between the asset and the index, plotting it on the chart for easy trend analysis.
Who Is This For?:
Traders and investors who want to compare an asset’s performance against a benchmark index.
Those looking to identify trends and deviations between an asset and the broader market.
Disclaimer:
This tool is for educational purposes only and does not constitute financial or trading advice. Always use it alongside proper risk management strategies and backtest thoroughly before applying it to live trading.
Chart Recommendation:
Use this script on clean charts for better clarity. Combine it with other technical indicators like moving averages or trendlines to enhance your analysis. Ensure you adjust the lookback periods to match your trading style and the timeframe of your analysis.
Additional Notes:
For optimal performance, ensure the benchmark index's data is available on your TradingView subscription. The script uses fallback mechanisms to avoid interruptions when index data is unavailable. Always validate the settings and test them to suit your trading strategy.
Performance

Portfolio [Afnan]🚀 Portfolio - Advanced Portfolio Management Indicator 📊
A game-changing portfolio management tool designed to help traders stay on top of their positions and manage risk efficiently. This indicator combines detailed tracking, real-time analytics, and visual clarity to ensure traders are well-equipped for the dynamic world of financial markets.
📈 Key Features 💡
Track up to 14 positions with ease
Real-time Profit & Loss (P&L) updates and risk metrics
Visual representation of entry, stop-loss (SL), and target levels
Alerts for stop-loss breaches and target achievements
Comprehensive portfolio summaries for quick analysis
Customizable options to suit individual trading styles
🔍 Main Components ⚙️
📊 1. Position Tracking
Detailed position data: entry, stop-loss, target levels, and more
Real-time risk-reward ratios
Insights into position size and exposure percentages
Continuous updates on P&L in real-time
📉 2. Visual Indicators
Clear visual markers for entry, SL, and target prices
Price labels with detailed percentage changes
Indicators that show the current position's market status
💼 3. Portfolio Summary
Aggregate account values and exposure
Summarized P&L metrics across all positions
Risk management insights for better decision-making
Daily performance tracking to evaluate strategies
⚠️ 4. Alert System
Instant notifications for stop-loss breaches
Alerts when target prices are hit
Alerts operate for the current chart symbol
⚡ Customization Options 🎨
Show or hide specific data columns
Adjust the table's position and size for better visibility
Personalize color schemes and text styles
Switch between full portfolio view and single symbol focus
📱 How to Use 📝
Input your positions in the indicator's settings
Enable or disable specific positions dynamically
Customize display preferences to your liking
Set up alerts for proactive risk management
Monitor all your trading activities in one comprehensive dashboard
📌 Important Notes ℹ️
Compatible with any trading symbol
Updates seamlessly during market hours
Alerts are specific to the currently active chart symbol
Maximum capacity: 14 simultaneous positions
Created by: @AfnanTAjuddin
⚠️ Disclaimer ⚠️
This indicator is a tool for informational purposes only. Ensure all calculations are verified and consult a financial professional before making investment decisions.
🎯 "Stay disciplined, trade smart, and let data guide your decisions." 📊

US/JP Factor/Sector Performance RankingThis indicator is designed to help you easily understand the strengths and weaknesses of different factors and sectors in the U.S. stock market. It looks at various ETFs, ranks their performance over a specific period (20 days by default), and shows the results visually.
= How the Ranking Works
The best-performing rank is shown as -1, with lower ranks as -2, -3, -4, and so on. This setup makes it easy to see rank order in TradingView’s default view.
If you turn on the “Inverse” setting, ranks will be shown as positive numbers in order (e.g., 1, 2, 3…). In this case, it’s recommended to reverse the TradingView scale for better understanding.
= How the Indicator Reacts to Market Conditions
- Normal Market Conditions
Certain factors or sectors often stay at the top rank. For example, during the rallies at the start of 2024 and in May, the Momentum factor performed well, showing a risk-on market environment.
On the other hand, sectors at the bottom rank also tend to stay in specific positions.
- Market Tops
Capital flows within sectors slow down, and top ranks begin to change frequently. This may suggest a market turning point.
- Bear Markets or High Volatility
Rankings become more chaotic in these conditions. These large changes can help you understand market sentiment and the level of volatility.
= Way of using the Indicator
You can use this indicator in the following ways:
- To apply sector rotation strategies.
- To build positions after volatile markets calm down.
- To take long positions on strong elements (higher ranks) and short positions on weaker ones (lower ranks).
= Things to Keep in Mind
It’s a Lagging Indicator
This indicator calculates rankings using the past 20 days of data. It doesn’t provide signals for the future but is a tool for analyzing past performance. To predict the market, you should combine this with other tools or leading indicators.
However, since trends in capital flows often continue, this indicator can help you spot those trends.
= Customization
This indicator is set up for U.S. and Japanese stock markets. However, you can customize it for other markets by changing the ticker and label description in the script.
==Japanese Description==
このインジケーターは、米国株市場におけるファクターやセクターの強弱を直感的に把握するために設計されています。
各ETFを参照し、特定期間(デフォルトでは20日間)のパフォーマンスを順位付けし、それを視覚的に表示します。
= インジケーターの特徴
- ランク付けの仕様
ランク1位は-1で表され、順位が下がるごとに-2、-3、-4…と減少します。この仕様により、TradingViewの標準状態でランクの高低を直感的に把握できるようにしました。
さらに、Inverse設定をONにすると、1位から順に正の値(例: 1, 2, 3…)で表示されるようになります。この場合、TradingViewのスケールを反転させることを推奨します。
= 市況とインジケーターの動き
- 平常時の市況
特定のファクターやセクターがランク1位を維持することが多いです。
例えば、2024年の年初や同年5月の上昇相場では、Momentumファクターが効果を発揮し、リスクオンの市場環境であったことを示しています。
一方、最下位に位置するセクターも特定の順位を維持する傾向があります。
- 天井圏の市況
セクター内の資金流入や流出が停滞し、上位ランクの変動が起こり始めます。これが市場の転換点を示唆する場合があります。
- 下落相場や荒れた市況
ランク順位が大きく乱れることが特徴です。この変動の大きさは、市況の雰囲気やボラティリティの高さを感じ取る材料として活用できます。
= 活用方法
このインジケーターは以下のような投資戦略に役立てることができます:
- セクターローテーションを活用した投資戦略
- 荒れた相場が落ち着いたタイミングでのポジション構築
- 強い要素(ランク上位)のロング、弱い要素(ランク下位)のショート
= 注意点
- 遅行指標であること
本インジケーターは、過去20日間のデータを基にランクを算出します。そのため、先行的なシグナルを提供するものではなく、過去のパフォーマンスに基づいた分析ツールです。市場を先回りするには、別途先行指標や分析を組み合わせる必要があります。
ただし、特定のファクターやセクターへの資金流入・流出が継続する傾向があるため、これを見極める手助けにはなります。
= カスタマイズについて
このインジケーターは米国・日本株市場に特化しています。ただし、他国のファクターやセクターのETFや指数が利用可能であれば、スクリプト内のtickerとlabel descriptionを変更することでカスタマイズが可能です。

Crypto Wallets Profitability & Performance [LuxAlgo]The Crypto Wallets Profitability & Performance indicator provides a comprehensive view of the financial status of cryptocurrency wallets by leveraging on-chain data from IntoTheBlock. It measures the percentage of wallets profiting, losing, or breaking even based on current market prices.
Additionally, it offers performance metrics across different timeframes, enabling traders to better assess market conditions.
This information can be crucial for understanding market sentiment and making informed trading decisions.
🔶 USAGE
🔹 Wallets Profitability
This indicator is designed to help traders and analysts evaluate the profitability of cryptocurrency wallets in real-time. It aggregates data gathered from the blockchain on the number of wallets that are in profit, loss, or breaking even and presents it visually on the chart.
Breaking even line demonstrates how realized gains and losses have changed, while the profit and the loss monitor unrealized gains and losses.
The signal line helps traders by providing a smoothed average and highlighting areas relative to profiting and losing levels. This makes it easier to identify and confirm trading momentum, assess strength, and filter out market noise.
🔹 Profitability Meter
The Profitability Meter is an alternative display that visually represents the percentage of wallets that are profiting, losing, or breaking even.
🔹 Performance
The script provides a view of the financial health of cryptocurrency wallets, showing the percentage of wallets in profit, loss, or breaking even. By combining these metrics with performance data across various timeframes, traders can gain valuable insights into overall wallet performance, assess trend strength, and identify potential market reversals.
🔹 Dashboard
The dashboard presents a consolidated view of key statistics. It allows traders to quickly assess the overall financial health of wallets, monitor trend strength, and gauge market conditions.
🔶 DETAILS
🔹 The Chart Occupation Option
The chart occupation option adjusts the occupation percentage of the chart to balance the visibility of the indicator.
🔹 The Height in Performance Options
Crypto markets often experience significant volatility, leading to rapid and substantial gains or losses. Hence, plotting performance graphs on top of the chart alongside other indicators can result in a cluttered display. The height option allows you to adjust the plotting for balanced visibility, ensuring a clearer and more organized chart.
🔶 SETTINGS
The script offers a range of customizable settings to tailor the analysis to your trading needs.
Chart Occupation %: Adjust the occupation percentage of the chart to balance the visibility of the indicator.
🔹 Profiting Wallets
Profiting Percentage: Toggle to display the percentage of wallets in profit.
Smoothing: Adjust the smoothing period for the profiting percentage line.
Signal Line: Choose a signal line type (SMA, EMA, RMA, or None) to overlay on the profiting percentage.
🔹 Losing Wallets
Losing Percentage: Toggle to display the percentage of wallets in loss.
Smoothing: Adjust the smoothing period for the losing percentage line.
Signal Line: Choose a signal line type (SMA, EMA, RMA, or None) to overlay on the losing percentage.
🔹 Breaking Even Wallets
Breaking-Even Percentage: Toggle to display the percentage of wallets breaking even.
Smoothing: Adjust the smoothing period for the breaking-even percentage line.
🔹 Profitability Meter
Profitability Meter: Enable or disable the meter display, set its width, and adjust the offset.
🔹 Performance
Performance Metrics: Choose the timeframe for performance metrics (Day to Date, Week to Date, etc.).
Height: Adjust the height of the chart visuals to balance the visibility of the indicator.
🔹 Dashboard
Block Profitability Stats: Toggle the display of profitability stats.
Performance Stats: Toggle the display of performance stats.
Dashboard Size and Position: Customize the size and position of the performance dashboard on the chart.
🔶 RELATED SCRIPTS
Market-Sentiment-Technicals
Multi-Chart-Widget

analytics_tablesLibrary "analytics_tables"
📝 Description
This library provides the implementation of several performance-related statistics and metrics, presented in the form of tables.
The metrics shown in the afforementioned tables where developed during the past years of my in-depth analalysis of various strategies in an atempt to reason about the performance of each strategy.
The visualization and some statistics where inspired by the existing implementations of the "Seasonality" script, and the performance matrix implementations of @QuantNomad and @ZenAndTheArtOfTrading scripts.
While this library is meant to be used by my strategy framework "Template Trailing Strategy (Backtester)" script, I wrapped it in a library hoping this can be usefull for other community strategy scripts that will be released in the future.
🤔 How to Guide
To use the functionality this library provides in your script you have to import it first!
Copy the import statement of the latest release by pressing the copy button below and then paste it into your script. Give a short name to this library so you can refer to it later on. The import statement should look like this:
import jason5480/analytics_tables/1 as ant
There are three types of tables provided by this library in the initial release. The stats table the metrics table and the seasonality table.
Each one shows different kinds of performance statistics.
The table UDT shall be initialized once using the `init()` method.
They can be updated using the `update()` method where the updated data UDT object shall be passed.
The data UDT can also initialized and get updated on demend depending on the use case
A code example for the StatsTable is the following:
var ant.StatsData statsData = ant.StatsData.new()
statsData.update(SideStats.new(), SideStats.new(), 0)
if (barstate.islastconfirmedhistory or (barstate.isrealtime and barstate.isconfirmed))
var statsTable = ant.StatsTable.new().init(ant.getTablePos('TOP', 'RIGHT'))
statsTable.update(statsData)
A code example for the MetricsTable is the following:
var ant.StatsData statsData = ant.StatsData.new()
statsData.update(ant.SideStats.new(), ant.SideStats.new(), 0)
if (barstate.islastconfirmedhistory or (barstate.isrealtime and barstate.isconfirmed))
var metricsTable = ant.MetricsTable.new().init(ant.getTablePos('BOTTOM', 'RIGHT'))
metricsTable.update(statsData, 10)
A code example for the SeasonalityTable is the following:
var ant.SeasonalData seasonalData = ant.SeasonalData.new().init(Seasonality.monthOfYear)
seasonalData.update()
if (barstate.islastconfirmedhistory or (barstate.isrealtime and barstate.isconfirmed))
var seasonalTable = ant.SeasonalTable.new().init(seasonalData, ant.getTablePos('BOTTOM', 'LEFT'))
seasonalTable.update(seasonalData)
🏋️♂️ Please refer to the "EXAMPLE" regions of the script for more advanced and up to date code examples!
Special thanks to @Mrcrbw for the proposal to develop this library and @DCNeu for the constructive feedback 🏆.
getTablePos(ypos, xpos)
Get table position compatible string
Parameters:
ypos (simple string) : The position on y axise
xpos (simple string) : The position on x axise
Returns: The position to be passed to the table
method init(this, pos, height, width, positiveTxtColor, negativeTxtColor, neutralTxtColor, positiveBgColor, negativeBgColor, neutralBgColor)
Initialize the stats table object with the given colors in the given position
Namespace types: StatsTable
Parameters:
this (StatsTable) : The stats table object
pos (simple string) : The table position string
height (simple float) : The height of the table as a percentage of the charts height. By default, 0 auto-adjusts the height based on the text inside the cells
width (simple float) : The width of the table as a percentage of the charts height. By default, 0 auto-adjusts the width based on the text inside the cells
positiveTxtColor (simple color) : The text color when positive
negativeTxtColor (simple color) : The text color when negative
neutralTxtColor (simple color) : The text color when neutral
positiveBgColor (simple color) : The background color with transparency when positive
negativeBgColor (simple color) : The background color with transparency when negative
neutralBgColor (simple color) : The background color with transparency when neutral
method init(this, pos, height, width, neutralBgColor)
Initialize the metrics table object with the given colors in the given position
Namespace types: MetricsTable
Parameters:
this (MetricsTable) : The metrics table object
pos (simple string) : The table position string
height (simple float) : The height of the table as a percentage of the charts height. By default, 0 auto-adjusts the height based on the text inside the cells
width (simple float) : The width of the table as a percentage of the charts width. By default, 0 auto-adjusts the width based on the text inside the cells
neutralBgColor (simple color) : The background color with transparency when neutral
method init(this, seas)
Initialize the seasonal data
Namespace types: SeasonalData
Parameters:
this (SeasonalData) : The seasonal data object
seas (simple Seasonality) : The seasonality of the matrix data
method init(this, data, pos, maxNumOfYears, height, width, extended, neutralTxtColor, neutralBgColor)
Initialize the seasonal table object with the given colors in the given position
Namespace types: SeasonalTable
Parameters:
this (SeasonalTable) : The seasonal table object
data (SeasonalData) : The seasonality data of the table
pos (simple string) : The table position string
maxNumOfYears (simple int) : The maximum number of years that fit into the table
height (simple float) : The height of the table as a percentage of the charts height. By default, 0 auto-adjusts the height based on the text inside the cells
width (simple float) : The width of the table as a percentage of the charts width. By default, 0 auto-adjusts the width based on the text inside the cells
extended (simple bool) : The seasonal table with extended columns for performance
neutralTxtColor (simple color) : The text color when neutral
neutralBgColor (simple color) : The background color with transparency when neutral
method update(this, wins, losses, numOfInconclusiveExits)
Update the strategy info data of the strategy
Namespace types: StatsData
Parameters:
this (StatsData) : The strategy statistics object
wins (SideStats)
losses (SideStats)
numOfInconclusiveExits (int) : The number of inconclusive trades
method update(this, stats, positiveTxtColor, negativeTxtColor, negativeBgColor, neutralBgColor)
Update the stats table object with the given data
Namespace types: StatsTable
Parameters:
this (StatsTable) : The stats table object
stats (StatsData) : The stats data to update the table
positiveTxtColor (simple color) : The text color when positive
negativeTxtColor (simple color) : The text color when negative
negativeBgColor (simple color) : The background color with transparency when negative
neutralBgColor (simple color) : The background color with transparency when neutral
method update(this, stats, buyAndHoldPerc, positiveTxtColor, negativeTxtColor, positiveBgColor, negativeBgColor)
Update the metrics table object with the given data
Namespace types: MetricsTable
Parameters:
this (MetricsTable) : The metrics table object
stats (StatsData) : The stats data to update the table
buyAndHoldPerc (float) : The buy and hold percetage
positiveTxtColor (simple color) : The text color when positive
negativeTxtColor (simple color) : The text color when negative
positiveBgColor (simple color) : The background color with transparency when positive
negativeBgColor (simple color) : The background color with transparency when negative
method update(this)
Update the seasonal data based on the season and eon timeframe
Namespace types: SeasonalData
Parameters:
this (SeasonalData) : The seasonal data object
method update(this, data, positiveTxtColor, negativeTxtColor, neutralTxtColor, positiveBgColor, negativeBgColor, neutralBgColor, timeBgColor)
Update the seasonal table object with the given data
Namespace types: SeasonalTable
Parameters:
this (SeasonalTable) : The seasonal table object
data (SeasonalData) : The seasonal cell data to update the table
positiveTxtColor (simple color) : The text color when positive
negativeTxtColor (simple color) : The text color when negative
neutralTxtColor (simple color) : The text color when neutral
positiveBgColor (simple color) : The background color with transparency when positive
negativeBgColor (simple color) : The background color with transparency when negative
neutralBgColor (simple color) : The background color with transparency when neutral
timeBgColor (simple color) : The background color of the time gradient
SideStats
Object that represents the strategy statistics data of one side win or lose
Fields:
numOf (series int)
sumFreeProfit (series float)
freeProfitStDev (series float)
sumProfit (series float)
profitStDev (series float)
sumGain (series float)
gainStDev (series float)
avgQuantityPerc (series float)
avgCapitalRiskPerc (series float)
avgTPExecutedCount (series float)
avgRiskRewardRatio (series float)
maxStreak (series int)
StatsTable
Object that represents the stats table
Fields:
table (series table) : The actual table
rows (series int) : The number of rows of the table
columns (series int) : The number of columns of the table
StatsData
Object that represents the statistics data of the strategy
Fields:
wins (SideStats)
losses (SideStats)
numOfInconclusiveExits (series int)
avgFreeProfitStr (series string)
freeProfitStDevStr (series string)
lossFreeProfitStDevStr (series string)
avgProfitStr (series string)
profitStDevStr (series string)
lossProfitStDevStr (series string)
avgQuantityStr (series string)
MetricsTable
Object that represents the metrics table
Fields:
table (series table) : The actual table
rows (series int) : The number of rows of the table
columns (series int) : The number of columns of the table
SeasonalData
Object that represents the seasonal table dynamic data
Fields:
seasonality (series Seasonality)
eonToMatrixRow (map)
numOfEons (series int)
mostRecentMatrixRow (series int)
balances (matrix)
returnPercs (matrix)
maxDDs (matrix)
eonReturnPercs (array)
eonCAGRs (array)
eonMaxDDs (array)
SeasonalTable
Object that represents the seasonal table
Fields:
table (series table) : The actual table
headRows (series int) : The number of head rows of the table
headColumns (series int) : The number of head columns of the table
eonRows (series int) : The number of eon rows of the table
seasonColumns (series int) : The number of season columns of the table
statsRows (series int)
statsColumns (series int) : The number of stats columns of the table
rows (series int) : The number of rows of the table
columns (series int) : The number of columns of the table
extended (series bool) : Whether the table has additional performance statistics

Blockunity Level Presets (BLP)A simple tool for setting performance targets.
Level Presets (BLP) is a simple tool for setting upside and downside levels relative to the current price of any asset. In this way, you can track which price the asset needs to move towards in order to achieve a defined performance.
How to Use
This indicator is very easy to use, you can set up to 5 upward and downward targets in the parameters.
Elements
The main elements of this tool are upward (default green) and downward (default red) levels.
Settings
Several parameters can be defined in the indicator configuration.
In addition to configuring which performance value to set the level at, you can choose not to display it if you don't need it. For example, here we display only two levels:
You can also choose not to display the labels:
Also concerning labels, you can choose not to display them in currency format, but in numerical format only (for example, if you're viewing a non-USD pair, such as ETHBTC):
Finally, you can modify design elements such as colors, level widths and text size:
How it Works
Here's how upside (_u) and downside (_d) levels are calculated:
source = close
level_1_u = source + (source * (level_1 / 100))
level_1_d = math.max(source - (source * (level_1 / 100)), 0)

Annualized ReturnThis is a straightforward tool for investors, offering the capability to select a specific start date and visualize the annualized return of the currently displayed asset.
Annualized return is a crucial metric for investors, as it provides a standardized measure of an investment's performance, making it easier to compare different investments. By annualizing returns, investors can gain insights into the average yearly growth rate of their investments, enabling more informed decision-making and portfolio management .
Selecting various start dates enables users to understand how market timing can influence the success of their investments.
The annualized return is calculated using the following formula :
AnnualizedReturn = (Ending price / Beginning price) ^ (1 / Number of Years) − 1

Momentum ChannelbandsThe "Momentum Channelbands" is indicator that measures and displays an asset's momentum. It includes options to calculate Bollinger Bands and Donchian Channels around the momentum. Users can customize settings for a comprehensive view of momentum-related insights. This tool helps assess trend strength, identify overbought/oversold conditions, and pinpoint highs/lows. It should be used alongside other indicators due to potential lag and false signals.

Multi-Asset Performance [Spaghetti] - By LeviathanThis indicator visualizes the cumulative percentage changes or returns of 30 symbols over a given period and offers a unique set of tools and data analytics for deeper insight into the performance of different assets.
Multi Asset Performance indicator (also called “Spaghetti”) makes it easy to monitor the changes in Price, Open Interest, and On Balance Volume across multiple assets simultaneously, distinguish assets that are overperforming or underperforming, observe the relative strength of different assets or currencies, use it as a tool for identifying mean reversion opportunities and even for constructing pairs trading strategies, detect "risk-on" or "risk-off" periods, evaluate statistical relationships between assets through metrics like correlation and beta, construct hedging strategies, trade rotations and much more.
Start by selecting a time period (e.g., 1 DAY) to set the interval for when data is reset. This will provide insight into how price, open interest, and on-balance volume change over your chosen period. In the settings, asset selection is fully customizable, allowing you to create three groups of up to 30 tickers each. These tickers can be displayed in a variety of styles and colors. Additional script settings offer a range of options, including smoothing values with a Simple Moving Average (SMA), highlighting the top or bottom performers, plotting the group mean, applying heatmap/gradient coloring, generating a table with calculations like beta, correlation, and RSI, creating a profile to show asset distribution around the mean, and much more.
One of the most important script tools is the screener table, which can display:
🔸 Percentage Change (Represents the return or the percentage increase or decrease in Price/OI/OBV over the current selected period)
🔸 Beta (Represents the sensitivity or responsiveness of asset's returns to the returns of a benchmark/mean. A beta of 1 means the asset moves in tandem with the market. A beta greater than 1 indicates the asset is more volatile than the market, while a beta less than 1 indicates the asset is less volatile. For example, a beta of 1.5 means the asset typically moves 150% as much as the benchmark. If the benchmark goes up 1%, the asset is expected to go up 1.5%, and vice versa.)
🔸 Correlation (Describes the strength and direction of a linear relationship between the asset and the mean. Correlation coefficients range from -1 to +1. A correlation of +1 means that two variables are perfectly positively correlated; as one goes up, the other will go up in exact proportion. A correlation of -1 means they are perfectly negatively correlated; as one goes up, the other will go down in exact proportion. A correlation of 0 means that there is no linear relationship between the variables. For example, a correlation of 0.5 between Asset A and Asset B would suggest that when Asset A moves, Asset B tends to move in the same direction, but not perfectly in tandem.)
🔸 RSI (Measures the speed and change of price movements and is used to identify overbought or oversold conditions of each asset. The RSI ranges from 0 to 100 and is typically used with a time period of 14. Generally, an RSI above 70 indicates that an asset may be overbought, while RSI below 30 signals that an asset may be oversold.)
⚙️ Settings Overview:
◽️ Period
Periodic inputs (e.g. daily, monthly, etc.) determine when the values are reset to zero and begin accumulating again until the period is over. This visualizes the net change in the data over each period. The input "Visible Range" is auto-adjustable as it starts the accumulation at the leftmost bar on your chart, displaying the net change in your chart's visible range. There's also the "Timestamp" option, which allows you to select a specific point in time from where the values are accumulated. The timestamp anchor can be dragged to a desired bar via Tradingview's interactive option. Timestamp is particularly useful when looking for outperformers/underperformers after a market-wide move. The input positioned next to the period selection determines the timeframe on which the data is based. It's best to leave it at default (Chart Timeframe) unless you want to check the higher timeframe structure of the data.
◽️ Data
The first input in this section determines the data that will be displayed. You can choose between Price, OI, and OBV. The second input lets you select which one out of the three asset groups should be displayed. The symbols in the asset group can be modified in the bottom section of the indicator settings.
◽️ Appearance
You can choose to plot the data in the form of lines, circles, areas, and columns. The colors can be selected by choosing one of the six pre-prepared color palettes.
◽️ Labeling
This input allows you to show/hide the labels and select their appearance and size. You can choose between Label (colored pointed label), Label and Line (colored pointed label with a line that connects it to the plot), or Text Label (colored text).
◽️ Smoothing
If selected, this option will smooth the values using a Simple Moving Average (SMA) with a custom length. This is used to reduce noise and improve the visibility of plotted data.
◽️ Highlight
If selected, this option will highlight the top and bottom N (custom number) plots, while shading the others. This makes the symbols with extreme values stand out from the rest.
◽️ Group Mean
This input allows you to select the data that will be considered as the group mean. You can choose between Group Average (the average value of all assets in the group) or First Ticker (the value of the ticker that is positioned first on the group's list). The mean is then used in calculations such as correlation (as the second variable) and beta (as a benchmark). You can also choose to plot the mean by clicking on the checkbox.
◽️ Profile
If selected, the script will generate a vertical volume profile-like display with 10 zones/nodes, visualizing the distribution of assets below and above the mean. This makes it easy to see how many or what percentage of assets are outperforming or underperforming the mean.
◽️ Gradient
If selected, this option will color the plots with a gradient based on the proximity of the value to the upper extreme, zero, and lower extreme.
◽️ Table
This section includes several settings for the table's appearance and the data displayed in it. The "Reference Length" input determines the number of bars back that are used for calculating correlation and beta, while "RSI Length" determines the length used for calculating the Relative Strength Index. You can choose the data that should be displayed in the table by using the checkboxes.
◽️ Asset Groups
This section allows you to modify the symbols that have been selected to be a part of the 3 asset groups. If you want to change a symbol, you can simply click on the field and type the ticker of another one. You can also show/hide a specific asset by using the checkbox next to the field.

Rolling Risk-Adjusted Performance RatiosThis simple indicator calculates and provides insights into different performance metrics of an asset - Sharpe, Sortino and Omega Ratios in particular. It allows users to customize the lookback period and select their preferred data source for evaluation of an asset.
Sharpe Ratio:
The Sharpe Ratio measures the risk-adjusted return of an asset by considering both the average return and the volatility or riskiness of the investment. A higher Sharpe Ratio indicates better risk-adjusted performance. It allows investors to compare different assets or portfolios and assess whether the returns adequately compensate for the associated risks. A higher Sharpe Ratio implies that the asset generates more return per unit of risk taken.
Sortino Ratio:
The Sortino Ratio is a variation of the Sharpe Ratio that focuses specifically on the downside risk or volatility of an asset. It takes into account only the negative deviations from the average return (downside deviation). By considering downside risk, the Sortino Ratio provides a more refined measure of risk-adjusted performance, particularly for investors who are more concerned with minimizing losses. A higher Sortino Ratio suggests that the asset has superior risk-adjusted returns when considering downside volatility.
Omega Ratio:
The Omega Ratio measures the probability-weighted ratio of gains to losses beyond a certain threshold or target return. It assesses the skewed nature of an asset's returns by differentiating between positive and negative returns and assigning more weight to extreme gains or losses. The Omega Ratio provides insights into the potential asymmetry of returns, highlighting the potential for significant positive or negative outliers. A higher Omega Ratio indicates a higher probability of achieving large positive returns compared to large negative returns.
Utility:
Performance Evaluation: Provides assessment of an asset's performance, considering both returns and risk factors.
Risk Comparison: Allows for comparing the risk-adjusted returns of different assets or portfolios. Helps identify investments with better risk-reward trade-offs.
Risk Management: Assists in managing risk exposure by evaluating downside risks and volatility.

Monthly Strategy Performance TableWhat Is This?
This script code adds a Monthly Strategy Performance Table to your Pine Script strategy scripts so you can see a month-by-month and year-by-year breakdown of your P&L as a percentage of your account balance.
The table is based on realized equity rather than open equity, so it only updates the metrics when a trade is closed.
That's why some numbers will not match the Strategy Tester metrics (such as max drawdown), as the Strategy Tester bases metrics like max drawdown on open trade equity and not realized equity (closed trades).
The script is still a work-in-progress, so make sure to read the disclaimer below. But I think it's ready to release the code for others to play around with.
How To Use It
The script code includes one of my strategies as an example strategy. You need to replace my strategy code with your own. To do that just copy the source code below into a blank script, delete lines 11 -> 60 and paste your strategy code in there instead of mine. The script should work with most systems, but make sure to read the disclaimer below.
It works best with a significant amount of historical data, so it may not work very effectively on intraday timeframes as there is a severe limitation of available bars on TradingView. I recommend using it on 4HR timeframes and above, as anything less will produce very little usable data. Having a premium TradingView plan will also help boost the number of available bars.
You can hover your mouse over a table cell to get more information in the form of tooltips (such as the Long and Short win rate if you hover over your total return cell).
Credit
The code in this script is based on open-source code originally written by QuantNomad, I've made significant changes and additions to the original script but all credit for the idea and especially the display table code goes to them - I just built on top of it:
Why Did I Make This?
None of this is trading or investment advice, just my personal opinion based on my experience as a trader and systems developer these past 6+ years:
The TradingView Strategy Tester is severely limited in some important ways. And unless you use complex Excel formulas on exported test data, you can't see a granular perspective of your system's historical performance.
There is much more to creating profitable and tradeable systems than developing a strategy with a good win rate and a good return with a reasonable drawdown.
Some additional questions we need to ask ourselves are:
What did the system's worst drawdown look like?
How long did it last?
How often do drawdowns occur, and how quickly are they typically recovered?
How often do we have a break-even or losing month or year?
What is our expected compounded annual growth rate, and how does that growth rate compare to our max drawdown?
And many more questions that are too long to list and take a lifetime of trading experience to answer.
Without answering these kinds of questions, we run the risk of developing systems that look good on paper, but when it comes to live trading, we are uncomfortable or incapable of enduring the system's granular characteristics.
This Monthly Performance Table script code is intended to help bridge some of that gap with the Strategy Tester's limited default performance data.
Disclaimer
I've done my best to ensure the numbers this code outputs are accurate, and according to my testing with my personal strategy scripts it appears to work fine. But there is always a good chance I've missed something, or that this code will not work with your particular system.
The majority of my TradingView systems are extremely simple single-target systems that operate on a closed-candle basis to minimize many of the data reliability issues with the Strategy Tester, so I was unable to do much testing with multiple targets and pyramiding etc.
I've included a Debug option in the script that will display important data and information on a label each time a trade is closed. I recommend using the Debug option to confirm that the numbers you see in the table are accurate and match what your strategy is actually doing.
Always do your own due diligence, verify all claims as best you can, and never take anyone's word for anything.
Take care, and best of luck with your trading :)
Kind regards,
Matt.
PS. If you're interested in learning how this script works, I have a free hour-long video lesson breaking down the source code - just check out the links below this script or in my profile.

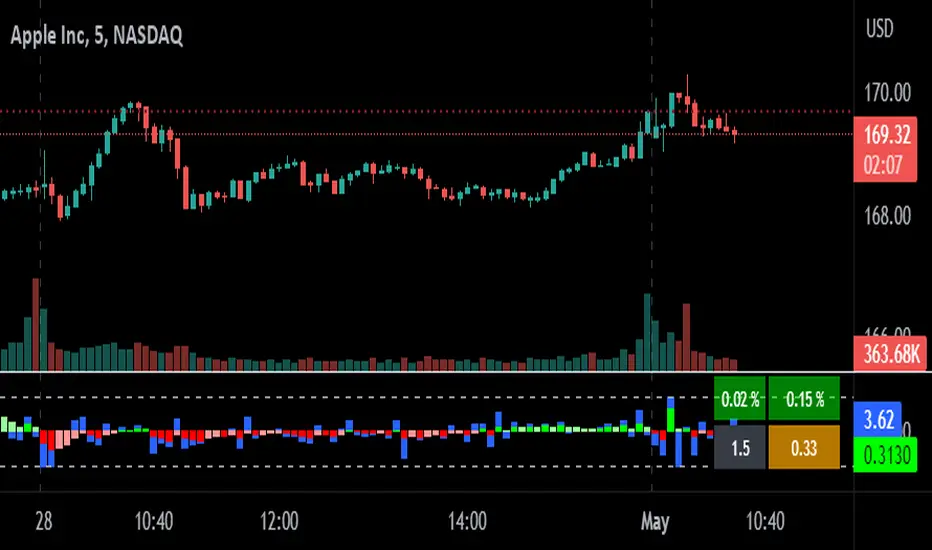
relative performanceThis indicator is built to mesure the performance of a stock vs the index of choice. it is best use for the intraday session because it doesn't take gap into account when doing the calculation. This is how i made my math (using AAPL compared to SPY for simplicity)
(change AAPL / ATR AAPL) - (change SPY / ATR SPY) * beta factor * volume factor
change is calculated open to close for each candle instead of close to close. this is why gap does not affect the calculation
blue columns is an instant snap shot of the RP
red and green columns is the moving average of the blue columns
limit is the max value for the blue line when ploting them on the chart but doesn't affect the calculation
option:
indice: default with SPY but could use any stock
moving average choice: let you choose between EMA or SMA green and red columns
rolling average length : number of bar for the moving average
I made an auto adjust for the 5 min chart and the 2 min chart so you can swithc between both chart and have the same average (default value set to 6x 5min and 15x 2 min, giving you the average of the last 30min)
volume weighing let you choose if you want a volume factor or not. volume factor is only going to multiplie the result of the price move. it cannot move it from positive to negative.
this is the calculation
(volume AAPL / volume SMA AAPL) / (volume SPY / volume sma SPY)
meaning that a higher volume on the thicker compared to it's sma while having a lower volume on SPY will give you a big relative performance.
you can choose the number of bar in the average for the volume.
BETA factor work the same way that the volume factor does. you got to manualy enter your beta. default is set to 1.5
table
top line : blue square is you RP value (same has the blue columns bar) and your reference thicker
middle line : pourcentage move from the open (9:30 open) for your stock on the left and the reference on the right
bottom line : beta on the left and volume factor on the right
feel free to ask question or give modification idea!
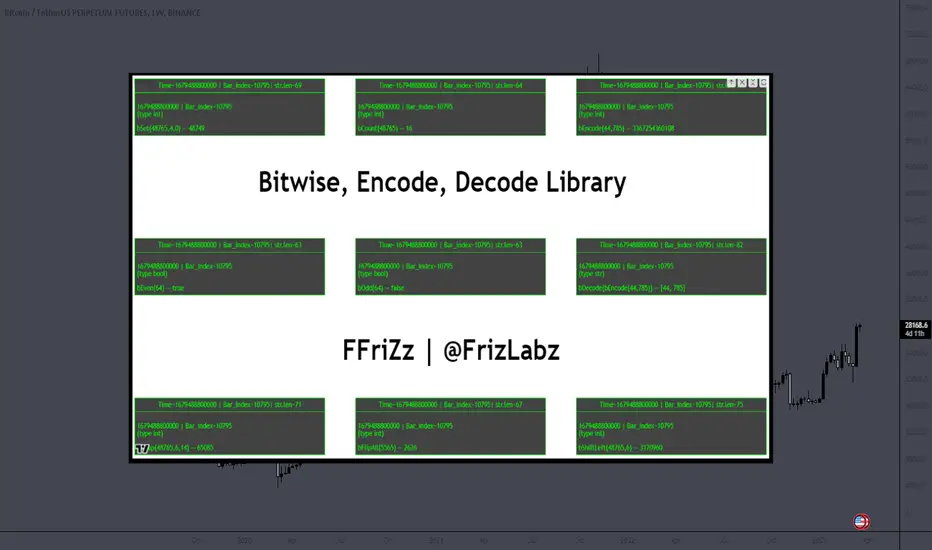
Bitwise, Encode, DecodeLibrary "Bitwise, Encode, Decode"
Bitwise, Encode, Decode, and more Library
docs()
Hover-Over Documentation for inside Text Editor
bAnd(a, b)
Returns the bitwise AND of two integers
Parameters:
a : `int` - The first integer
b : `int` - The second integer
Returns: `int` - The bitwise AND of the two integers
bOr(a, b)
Performs a bitwise OR operation on two integers.
Parameters:
a : `int` - The first integer.
b : `int` - The second integer.
Returns: `int` - The result of the bitwise OR operation.
bXor(a, b)
Performs a bitwise Xor operation on two integers.
Parameters:
a : `int` - The first integer.
b : `int` - The second integer.
Returns: `int` - The result of the bitwise Xor operation.
bNot(n)
Performs a bitwise NOT operation on an integer.
Parameters:
n : `int` - The integer to perform the bitwise NOT operation on.
Returns: `int` - The result of the bitwise NOT operation.
bShiftLeft(n, step)
Performs a bitwise left shift operation on an integer.
Parameters:
n : `int` - The integer to perform the bitwise left shift operation on.
step : `int` - The number of positions to shift the bits to the left.
Returns: `int` - The result of the bitwise left shift operation.
bShiftRight(n, step)
Performs a bitwise right shift operation on an integer.
Parameters:
n : `int` - The integer to perform the bitwise right shift operation on.
step : `int` - The number of bits to shift by.
Returns: `int` - The result of the bitwise right shift operation.
bRotateLeft(n, step)
Performs a bitwise right shift operation on an integer.
Parameters:
n : `int` - The int to perform the bitwise Left rotation on the bits.
step : `int` - The number of bits to shift by.
Returns: `int`- The result of the bitwise right shift operation.
bRotateRight(n, step)
Performs a bitwise right shift operation on an integer.
Parameters:
n : `int` - The int to perform the bitwise Right rotation on the bits.
step : `int` - The number of bits to shift by.
Returns: `int` - The result of the bitwise right shift operation.
bSetCheck(n, pos)
Checks if the bit at the given position is set to 1.
Parameters:
n : `int` - The integer to check.
pos : `int` - The position of the bit to check.
Returns: `bool` - True if the bit is set to 1, False otherwise.
bClear(n, pos)
Clears a particular bit of an integer (changes from 1 to 0) passes if bit at pos is 0.
Parameters:
n : `int` - The integer to clear a bit from.
pos : `int` - The zero-based index of the bit to clear.
Returns: `int` - The result of clearing the specified bit.
bFlip0s(n)
Flips all 0 bits in the number to 1.
Parameters:
n : `int` - The integer to flip the bits of.
Returns: `int` - The result of flipping all 0 bits in the number.
bFlip1s(n)
Flips all 1 bits in the number to 0.
Parameters:
n : `int` - The integer to flip the bits of.
Returns: `int` - The result of flipping all 1 bits in the number.
bFlipAll(n)
Flips all bits in the number.
Parameters:
n : `int` - The integer to flip the bits of.
Returns: `int` - The result of flipping all bits in the number.
bSet(n, pos, newBit)
Changes the value of the bit at the given position.
Parameters:
n : `int` - The integer to modify.
pos : `int` - The position of the bit to change.
newBit : `int` - na = flips bit at pos reguardless 1 or 0 | The new value of the bit (0 or 1).
Returns: `int` - The modified integer.
changeDigit(n, pos, newDigit)
Changes the value of the digit at the given position.
Parameters:
n : `int` - The integer to modify.
pos : `int` - The position of the digit to change.
newDigit : `int` - The new value of the digit (0-9).
Returns: `int` - The modified integer.
bSwap(n, i, j)
Switch the position of 2 bits of an int
Parameters:
n : `int` - int to manipulate
i : `int` - bit pos to switch with j
j : `int` - bit pos to switch with i
Returns: `int` - new int with bits switched
bPalindrome(n)
Checks to see if the binary form is a Palindrome (reads the same left to right and vice versa)
Parameters:
n : `int` - int to check
Returns: `bool` - result of check
bEven(n)
Checks if n is Even
Parameters:
n : `int` - The integer to check.
Returns: `bool` - result.
bOdd(n)
checks if n is Even if not even Odd
Parameters:
n : `int` - The integer to check.
Returns: `bool` - result.
bPowerOfTwo(n)
Checks if n is a Power of 2.
Parameters:
n : `int` - number to check.
Returns: `bool` - result.
bCount(n, to_count)
Counts the number of bits that are equal to 1 in an integer.
Parameters:
n : `int` - The integer to count the bits in.
to_count `string` - the bits to count
Returns: `int` - The number of bits that are equal to 1 in n.
GCD(a, b)
Finds the greatest common divisor (GCD) of two numbers.
Parameters:
a : `int` - The first number.
b : `int` - The second number.
Returns: `int` - The GCD of a and b.
LCM(a, b)
Finds the least common multiple (LCM) of two integers.
Parameters:
a : `int` - The first integer.
b : `int` - The second integer.
Returns: `int` - The LCM of a and b.
aLCM(nums)
Finds the LCM of an array of integers.
Parameters:
nums : `int ` - The list of integers.
Returns: `int` - The LCM of the integers in nums.
adjustedLCM(nums, LCM)
adjust an array of integers to Least Common Multiple (LCM)
Parameters:
nums : `int ` - The first integer
LCM : `int` - The second integer
Returns: `int ` - array of ints with LCM
charAt(str, pos)
gets a Char at a given position.
Parameters:
str : `string` - string to pull char from.
pos : `int` - pos to get char from string (left to right index).
Returns: `string` - char from pos of string or "" if pos is not within index range
decimalToBinary(num)
Converts a decimal number to binary
Parameters:
num : `int` - The decimal number to convert to binary
Returns: `string` - The binary representation of the decimal number
decimalToBinary(num, to_binary_int)
Converts a decimal number to binary
Parameters:
num : `int` - The decimal number to convert to binary
to_binary_int : `bool` - bool to convert to int or to string (true for int, false for string)
Returns: `string` - The binary representation of the decimal number
binaryToDecimal(binary)
Converts a binary number to decimal
Parameters:
binary : `string` - The binary number to convert to decimal
Returns: `int` - The decimal representation of the binary number
decimal_len(n)
way of finding decimal length using arithmetic
Parameters:
n `float` - floating decimal point to get length of.
Returns: `int` - number of decimal places
int_len(n)
way of finding number length using arithmetic
Parameters:
n : `int`- value to find length of number
Returns: `int` - lenth of nunber i.e. 23 == 2
float_decimal_to_whole(n)
Converts a float decimal number to an integer `0.365 to 365`.
Parameters:
n : `string` - The decimal number represented as a string.
Returns: `int` - The integer obtained by removing the decimal point and leading zeroes from s.
fractional_part(x)
Returns the fractional part of a float.
Parameters:
x : `float` - The float to get the fractional part of.
Returns: `float` - The fractional part of the float.
form_decimal(a, b, zero_fix)
helper to form 2 ints into 1 float seperated by the decimal
Parameters:
a : `int` - a int
b : `int` - b int
zero_fix : `bool` - fix for trailing zeros being truncated when converting to float
Returns: ` ` - float = float decimal of ints | string = string version of b for future use to ref length
bEncode(n1, n2)
Encodes two numbers into one using bit OR. (fastest)
Parameters:
n1 : `int` - The first number to Encodes.
n2 : `int` - The second number to Encodes.
Returns: `int` - The result of combining the two numbers using bit OR.
bDecode(n)
Decodes an integer created by the bCombine function.(fastest)
Parameters:
n : `int` - The integer to decode.
Returns: ` ` - A tuple containing the two decoded components of the integer.
Encode(a, b)
Encodes by seperating ints into left and right of decimal float
Parameters:
a : `int` - a int
b : `int` - b int
Returns: `float` - new float of encoded ints one on left of decimal point one on right
Decode(encoded)
Decodes float of 2 ints seperated by decimal point
Parameters:
encoded : `float` - the encoded float value
Returns: ` ` - tuple of the 2 ints from encoded float
encode_heavy(a, b)
Encodes by combining numbers and tracking size in the
decimal of a floating number (slowest)
Parameters:
a : `int` - a int
b : `int` - b int
Returns: `float` - new decimal of encoded ints
decode_heavy(encoded)
Decodes encoded float that tracks size of ints in float decimal
Parameters:
encoded : `float` - encoded float
Returns: ` ` - tuple of decoded ints
decimal of float (slowest)
Parameters:
encoded : `float` - the encoded float value
Returns: ` ` - tuple of the 2 ints from encoded float
Bitwise, Encode, Decode Docs
In the documentation you may notice the word decimal
not used as normal this is because when referring to
binary a decimal number is a number that
can be represented with base 10 numbers 0-9
(the wiki below explains better)
A rule of thumb for the two integers being
encoded it to keep both numbers
less than 65535 this is because anything lower uses 16 bits or less
this will maintain 100% accuracy when decoding
although it is possible to do numbers up to 2147483645 with
this library doesnt seem useful enough
to explain or demonstrate.
The functions provided work within this 32-bit range,
where the highest number is all 1s and
the lowest number is all 0s. These functions were created
to overcome the lack of built-in bitwise functions in Pinescript.
By combining two integers into a single number,
the code can access both values i.e when
indexing only one array index
for a matrices row/column, thus improving execution time.
This technique can be applied to various coding
scenarios to enhance performance.
Bitwise functions are a way to use integers in binary form
that can be used to speed up several different processes
most languages have operators to perform these function such as
`<<, >>, &, ^, |, ~`
en.wikipedia.org
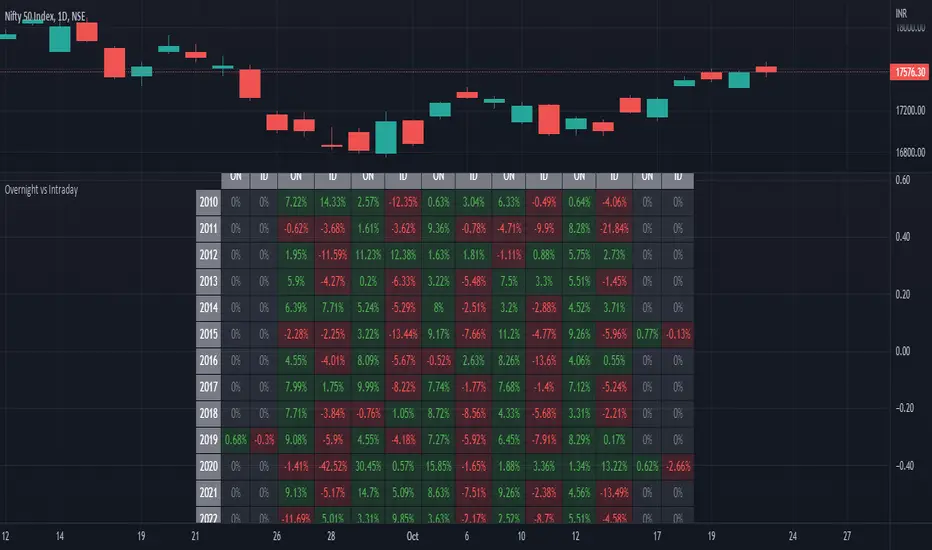
ILM Overnight vs Intraday Performance - Tabular FormUse this indicator on Daily Timeframe
This script compares Overnight vs Intraday Performance based on the Day of the Week (DOW) - Sun - Sat of index/stock/currency/commodity symbols.
ON column indicates Overnight performance = open/close -1
ID column indicates Intraday performance = close-open/1
The calculations are detailed in the tooltips of the individual table cells.
Performance Tablethis scrip is modified of Performance Table () of TradingView user @BeeHolder = Thank u very much.
-
@BeeHolder formula is based on daily basis,
but my calculation is based on respective day, week and month.
-
The formula of the calculation is (Current Close - Previous Close) * 100 / Previous Close, where Past value is:
1D = close 1 day before
5D = close 5 day before
1W - close 1 week before
4W = close 4 week before
1M - close 1 month before
3M - close 3 month before
6M - close 6 month before
12M - close 12 month before
52W - close 52 week before
Also table position cane be set.
thank you all
-

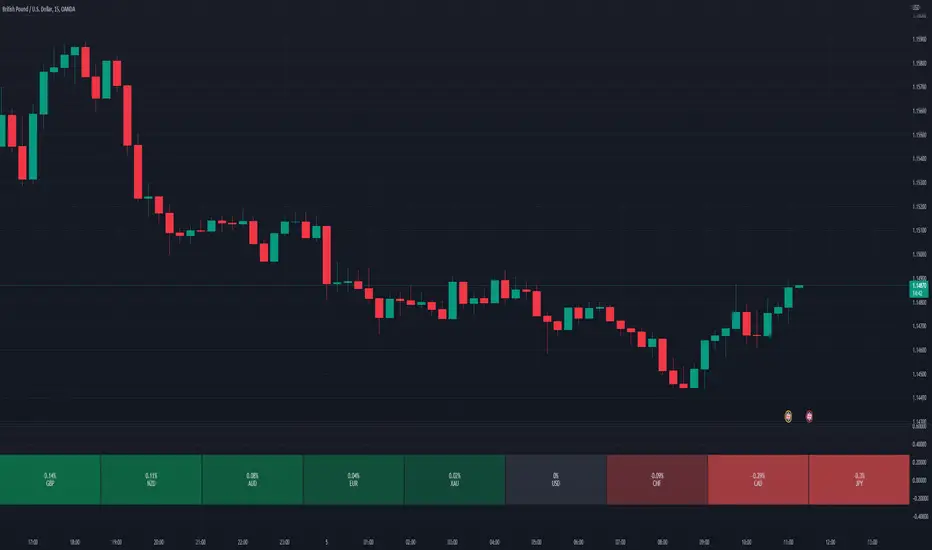
Relative Perfomance IndexHello Traders.
Lets keep it simple..
1. Take the major pairs that have USD in them and watch their change over a specific timeframe.
2. Now lets sort these changes of each pair from the most positive to the most negative.
Good, I see you have some ideas already.
This is exactly what this indicator does. You will visualize the biggest change in pairs of the timeframe of your choice and from this you can decide on pairs that you want to trade.
Monthly Returns of a Strategy in a ChartIt's a simple example of how you can present your strategy's monthly performance in a chart.
You maybe know that there is no support of these kind of charts in TradingView so this chart is actually a table object under the hood.
Table visual appearance is customizable, you can change:
Location
Bar Width / High
Colors
Thanks to @MUQWISHI for hard work, for helping me coding it.
It's not about the strategy itself but the way you display returns on your chart. So pls don't critique my choice of the strategy and its performance 🙂
Disclaimer
Please remember that past performance may not be indicative of future results.
Due to various factors, including changing market conditions, the strategy may no longer perform as well as in historical backtesting.
This post and the script don’t provide any financial advice.

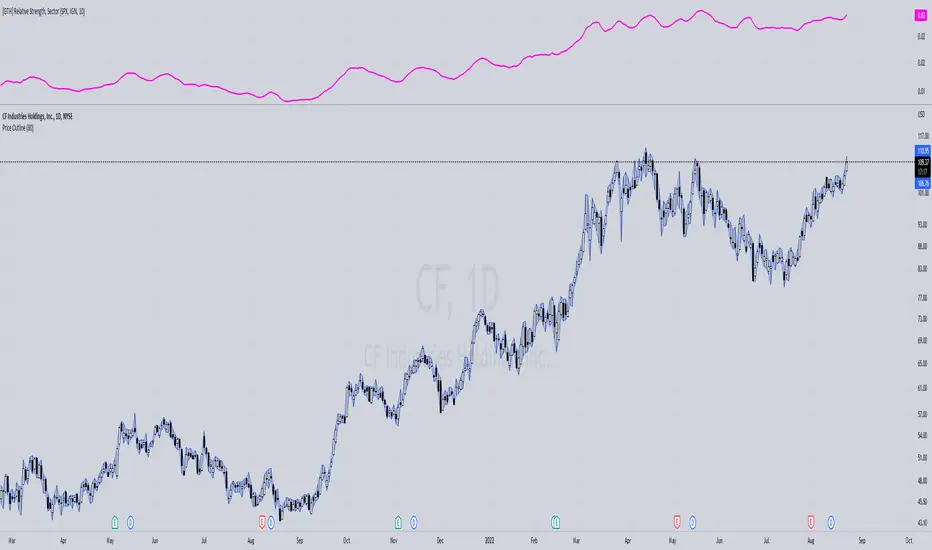
[GTH] Relative Strength, SectorsDisplays the Relative Strength (RS) of a symbol in relation to some common sector ETFs, SPX and NDX (select from drop-down list). This is done by dividing the symbol's price by the chosen sector ETF's price.
You can also select a symbol of your choice to compare against.
Interpretation:
RS line ascending: symbol performs stronger than the sector ETF.
RS line decending: symbol performs weaker than the sector ETF.
In case of error reports: please be specfic. Thanks.
Strategy BackTest Display Statistics - TraderHalaiThis script was born out of my quest to be able to display strategy back test statistics on charts to allow for easier backtesting on devices that do not natively support backtest engine (such as mobile phones, when I am backtesting from away from my computer). There are already a few good ones on TradingView, but most / many are too complicated for my needs.
Found an excellent display backtest engine by 'The Art of Trading'. This script is a snippet of his hard work, with some very minor tweaks and changes. Much respect to the original author.
Full credit to the original author of this script. It can be found here: www.tradingview.com
I decided to modify the script by simplifying it down and make it easier to integrate into existing strategies, using simple copy and paste, by relying on existing tradingview strategy backtester inputs. I have also added 3 additional performance metrics:
- Max Run Up
- Average Win per trade
- Average Loss per trade
As this is a work in progress, I will look to add in more performance metrics in future, as I further develop this script.
Feel free to use this display panel in your scripts and strategies.
Thanks and enjoy :)

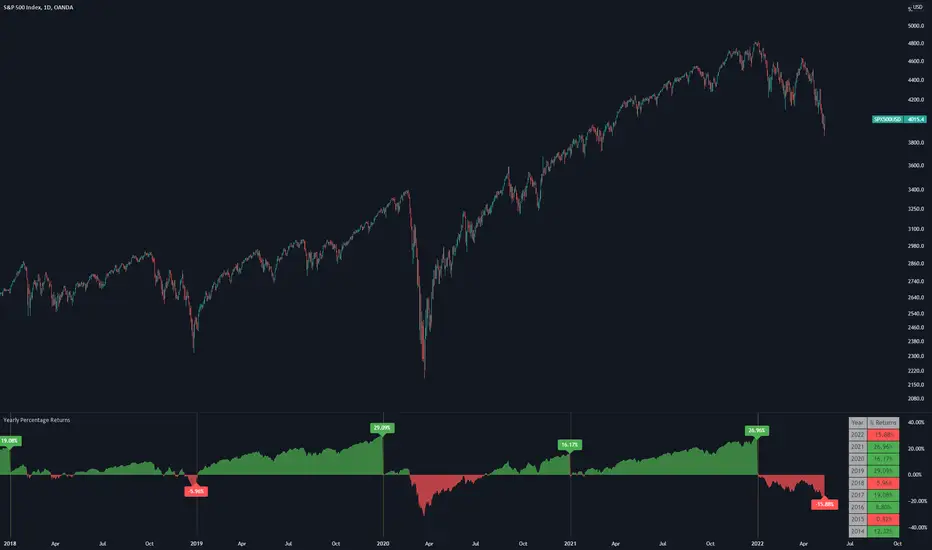
Yearly Percentage ReturnsAn indicator that lets you visualize the historical Yearly Percentage returns of any symbol .
Key Features:
Displays the yearly returns from start to end of each year
Displays a table showing all yearly returns for current symbol
Displays start of each year as a vertical line
Displays up to 5 custom horizontal levels
Table Settings:
Enable table - Show/Hide the table
Size - Sets the size of the table
Position - Sets the position of the table on the screen
Direction - Sets the direction of the table to display the data (Vertically or Horizontally)
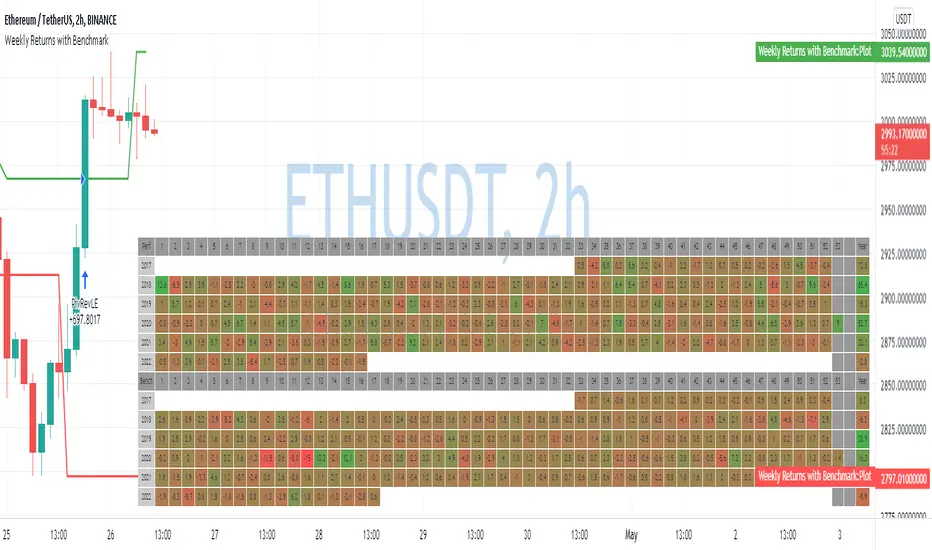
Weekly Returns with BenchmarkSome time ago I published Monthly returns table. Now It's time for weekly one.
To get it work you need a pretty big screen, but I hope it will be useful for some of you.
Features of this table includes:
Display weekly returns of your strategy, benchmark, and alpha over this benchmark.
Select benchmark to be another instrument
Select the date from which you want to compute monthly returns
Show/hide benchmark and alpha
Choose colors for gradient for gain/loss values
Use it with any type of strategy
Use it with replay
Thanks to @MUQWISHI to help me coding it.
It's not about the strategy itself but the way you display returns on your chart. So pls don't critique my choice of the strategy and its performance 🙂
Disclaimer
Please remember that past performance may not be indicative of future results.
Due to various factors, including changing market conditions, the strategy may no longer perform as well as in historical backtesting.
This post and the script don’t provide any financial advice.
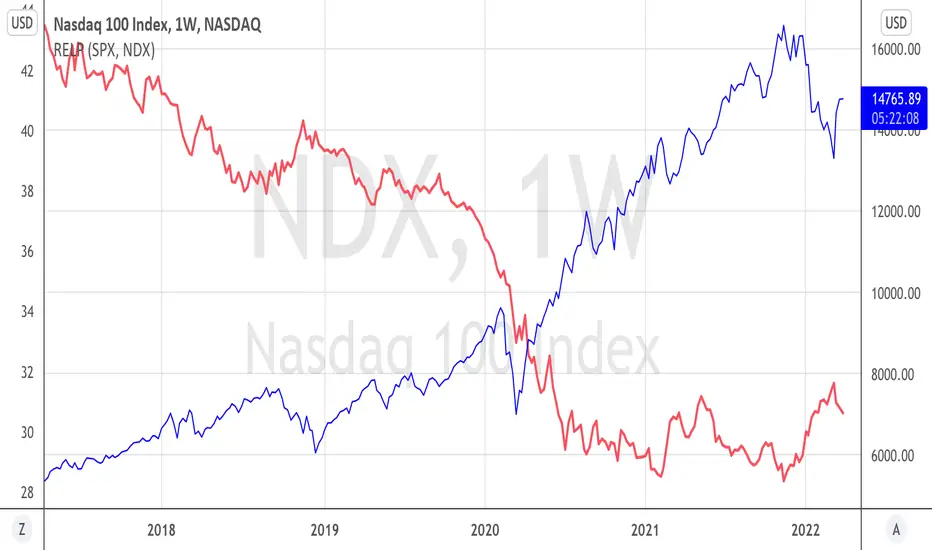
Relative PerformanceThis indicator allows to compare relative performance of two indices or securities. It is the update of the previous version rewritten in Pine Script 5 version.
Performance Table From OpenThis indicator plots the percentage performance from the open of up to 20 different customizable tickers.
Enjoy!
