OPEN-SOURCE SCRIPT
Weekly Returns with Benchmark
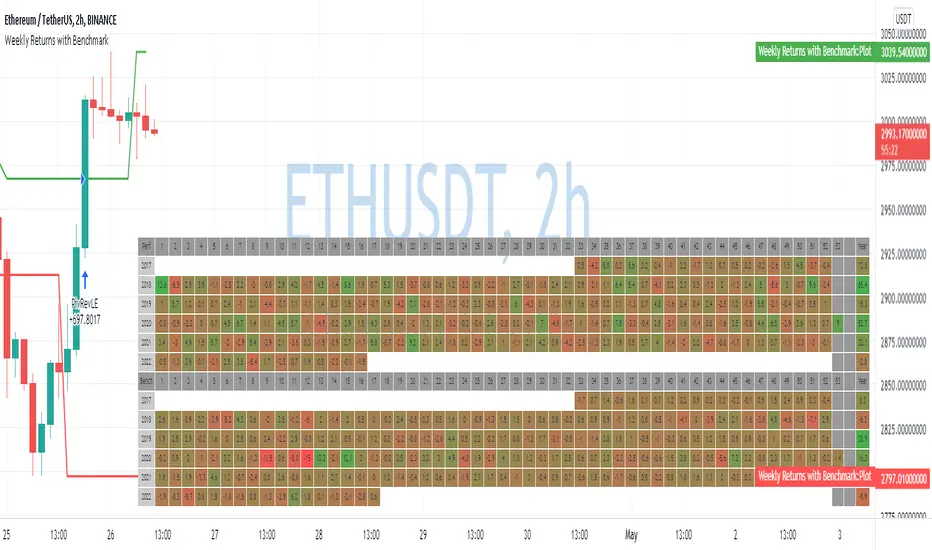
Some time ago I published Monthly returns table. Now It's time for weekly one.
To get it work you need a pretty big screen, but I hope it will be useful for some of you.
Features of this table includes:
Thanks to MUQWISHI to help me coding it.
It's not about the strategy itself but the way you display returns on your chart. So pls don't critique my choice of the strategy and its performance 🙂
Disclaimer
Please remember that past performance may not be indicative of future results.
Due to various factors, including changing market conditions, the strategy may no longer perform as well as in historical backtesting.
This post and the script don’t provide any financial advice.
To get it work you need a pretty big screen, but I hope it will be useful for some of you.
Features of this table includes:
- Display weekly returns of your strategy, benchmark, and alpha over this benchmark.
- Select benchmark to be another instrument
- Select the date from which you want to compute monthly returns
- Show/hide benchmark and alpha
- Choose colors for gradient for gain/loss values
- Use it with any type of strategy
- Use it with replay
Thanks to MUQWISHI to help me coding it.
It's not about the strategy itself but the way you display returns on your chart. So pls don't critique my choice of the strategy and its performance 🙂
Disclaimer
Please remember that past performance may not be indicative of future results.
Due to various factors, including changing market conditions, the strategy may no longer perform as well as in historical backtesting.
This post and the script don’t provide any financial advice.
Skrip sumber terbuka
Dalam semangat sebenar TradingView, pencipta skrip ini telah menjadikannya sumber terbuka supaya pedagang dapat menilai dan mengesahkan kefungsiannya. Terima kasih kepada penulis! Walaupun anda boleh menggunakannya secara percuma, ingat bahawa menerbitkan semula kod ini adalah tertakluk kepada Peraturan Dalaman kami.
💻 Online Courses and Access to PRO Indicators in the QuanTribe community: qntly.com/qt
💼 Hire Us: qntly.com/pine
📞 Book a call: qntly.com/cons
📰 qntly.com/news
𝕏: qntly.com/x
📩 qntly.com/tel
💼 Hire Us: qntly.com/pine
📞 Book a call: qntly.com/cons
📰 qntly.com/news
𝕏: qntly.com/x
📩 qntly.com/tel
Penafian
Maklumat dan penerbitan adalah tidak dimaksudkan untuk menjadi, dan tidak membentuk, nasihat untuk kewangan, pelaburan, perdagangan dan jenis-jenis lain atau cadangan yang dibekalkan atau disahkan oleh TradingView. Baca dengan lebih lanjut di Terma Penggunaan.