Utiliti Pine

N Order EMAThe exponential moving average is one of the most fundamental tools in technical analysis, but its implementation is almost always locked to a single mathematical approach. I've always wanted to extend the EMA into an n-order filter, and after some time working through the digital signal processing mathematics, I finally managed to do it. This indicator takes the familiar EMA concept and opens it up to four different discretization methods, each representing a valid way to transform a continuous-time exponential smoother into a discrete-time recursive filter. On top of that, it includes adjustable filter order, which fundamentally changes the frequency response characteristics in ways that simply changing the period length cannot achieve.
The four discretization styles are impulse-matched, all-pole, matched z-transform, and bilinear (Tustin). The all-pole version is exactly like stacking multiple EMAs together but implemented in a single function with proper coefficient calculation. It uses a canonical form where you get one gain coefficient and the rest are zeros, with the feedback coefficients derived from the binomial expansion of the pole polynomial. The other three methods are attempts at making generalizations of the EMA in different ways. Impulse-matched creates the filter by matching the discrete-time impulse response to what the continuous EMA would produce. Matched z-transform directly maps the continuous poles to the z-domain using the exponential relationship. Bilinear uses the Tustin transformation with frequency prewarping to ensure the cutoff frequency is preserved despite the inherent warping of the mapping.
Honestly, they're all mostly the same in practice, which is exactly what you'd expect since they're all valid discretizations of the same underlying filter. The differences show up in subtle ways during volatile market conditions or in the exact phase characteristics, but for most trading applications the outputs will track each other closely. That said, the bilinear version works particularly well at low periods like 2, where other methods can sometimes produce numerical artifacts. I personally like the z-match for its clean frequency-domain properties, but the real point here is demonstrating that you can tackle the same problem from multiple mathematical angles and end up with slightly different but equally valid implementations.
The order parameter is where things get interesting. A first-order EMA is the standard single-pole recursive filter everyone knows. When you move to second-order, you're essentially cascading two filter sections, which steepens the roll-off in the frequency domain and changes how the filter responds to sudden price movements. Higher orders continue this progression. The all-pole style makes this particularly clear since it's literally stacking EMA operations, but all four discretization methods support arbitrary order. This gives you control over the aggressiveness of the smoothing that goes beyond just adjusting the period length.
On top of the core EMA calculation, I've included all the standard variants that people use for reducing lag. DEMA applies the EMA twice and combines the results to get faster response. TEMA takes it further with three applications. HEMA uses a Hull-style calculation with fractional periods, applying the EMA to the difference between a half-period EMA and a full-period EMA, then smoothing that result with the square root of the period. These are all implemented using whichever discretization method you select, so you're not mixing different mathematical approaches. Everything stays consistent within the chosen framework.
The practical upside of this indicator is flexibility for people building trading systems. If you need a moving average with specific frequency response characteristics, you can tune the order parameter instead of hunting for the right period length. If you want to test whether different discretization methods affect your strategy's performance, you can swap between them without changing any other code. For most users, the impulse-matched style at order 1 will behave almost identically to a standard EMA, which gives you a familiar baseline to work from. From there you can experiment with higher orders or different styles to see if they provide any edge in your particular market or timeframe.
What this really highlights is that even something as seemingly simple as an exponential moving average involves mathematical choices that usually stay hidden. The standard EMA formula you see in textbooks is already a discretized version of a continuous exponential decay, and there are multiple valid ways to perform that discretization. By exposing these options, this indicator lets you explore a parameter space that most traders never even know exists. Whether that exploration leads to better trading results is an empirical question that depends on your strategy and market, but at minimum it's a useful reminder that the tools we take for granted are built on arbitrary but reasonable mathematical decisions.

NY Session Range Box with Labeled Time MarkersShows opening time ny session by timing with lines to inform traders to avoid 11:30am to 1:30pm for choppy sessions and mark early and power hour .


Previous Day & Week High/Low LevelsPrevious Day & Week High/Low Levels is a precision tool designed to help traders easily identify the most relevant price levels that often act as strong support or resistance areas in the market. It automatically plots the previous day’s and week’s highs and lows, as well as the current day’s developing internal high and low. These levels are crucial reference points for intraday, swing, and even position traders who rely on price action and liquidity behavior.
Key Features
Previous Day High/Low:
The indicator automatically draws horizontal lines marking the highest and lowest prices from the previous trading day.
These levels are widely recognized as potential zones where the market may react again — either rejecting or breaking through them.
Previous Week High/Low:
The script also tracks and displays the high and low from the last completed trading week.
Weekly levels tend to represent stronger liquidity pools and broader institutional zones, which makes them especially important when aligning higher timeframe context with lower timeframe entries.
Internal Daily High/Low (Real-Time Tracking):
While the day progresses, the indicator dynamically updates the current day’s internal high and low.
This allows traders to visualize developing market structure, identify intraday ranges, and anticipate potential breakouts or liquidity sweeps.
Multi-Timeframe Consistency:
All levels — daily and weekly — remain visible across any chart timeframe, from 1 minute to 1 day or higher.
This ensures traders can maintain perspective and avoid losing track of key zones when switching views.
Customizable Visuals:
The colors, line thickness, and label visibility can be easily adjusted to match personal charting preferences.
This makes the indicator adaptable to any trading style or layout, whether minimalistic or detailed.
How to Use
Identify Key Reaction Zones:
Observe how price interacts with the previous day and week levels. Rejections, consolidations, or clean breakouts around these lines often signal strong liquidity areas or potential directional moves.
Combine with Market Structure or Liquidity Concepts:
The indicator works perfectly with supply and demand analysis, liquidity sweeps, order block strategies, or simply classic support/resistance techniques.
Scalping and Intraday Trading:
On lower timeframes (1m–15m), the daily levels help identify intraday turning points.
On higher timeframes (1h–4h or daily), the weekly levels provide broader context and directional bias.
Risk Management and Planning:
Using these levels as reference points allows for more precise stop placement, target setting, and overall trade management.
Why This Indicator Helps
Markets often react strongly around previous highs and lows because these zones contain trapped liquidity, pending orders, or institutional decision points.
By having these areas automatically mapped out, traders gain a clear and objective view of where price is likely to respond — without needing to manually draw lines every day or week.
Whether you’re a beginner still learning about price structure, or an advanced trader refining entries within liquidity zones, this tool simplifies the process and keeps your charts clean, consistent, and data-driven.

Smart Weekly Lines — Clean & Scroll-Proof (Pine v6)Because your chart deserves structure. Elegant weekly dividers that stay aligned, scroll smoothly, and project future weeks using your wished UTC offset.
Smart Weekly Lines draws precise, full-height vertical lines marking each new week — perfectly aligned to your local UTC offset. It stays clean, smooth, and consistent no matter how far you scroll.
Features
• Accurate weekly boundaries based on your local UTC offset (supports half-hour zones like India +5.5)
• Clean, full-height lines that never cut off with zoom or scroll
• Adjustable color, opacity, width, and style (solid, dashed, dotted)
• Future week projection for planning and alignment
• Optional visibility: show only on Daily and Intraday charts
Works with any market — stocks, crypto, forex, or futures.
Built for traders who value clarity, structure, and precision.
Developed collaboratively with the assistance of ChatGPT under my direction and testing.

USCBBS-WDTGAL-RRPONTSYDThis is the U.S. Financial Market Net Liquidity.
The calculation method is to subtract the U.S. Treasury General Account balance (WDTGAL) and then the Overnight Reverse Repo balance (RRPONTSYD) from the Federal Reserve's balance sheet total (USCBBS).

ATR Trailing Stop Without tradepanel Open✅ Only plots ATR trailing stop line
✅ Only colors candles
✅ No trades / entries
✅ No “Strategy Tester” panel
✅ No arrows, markers, or trade lists

Metallic Retracement LevelsThere's something that's always bothered me about how traders use Fibonacci retracements. Everyone treats the golden ratio like it's the only game in town, but mathematically speaking, it's completely arbitrary. The golden ratio is just the first member of an infinite family of metallic means, and there's no particular reason why 1.618 should be special for markets when we have the silver ratio at 2.414, the bronze ratio at 3.303, and literally every other metallic mean extending to infinity. We just picked one and decided it was magical.
The metallic means are a sequence of mathematical constants that generalize the golden ratio. They're defined by the equation x² = kx + 1, where k is any positive integer. When k equals 1, you get the golden ratio. When k equals 2, you get the silver ratio. When k equals 3, you get bronze, and so on forever. Each metallic mean generates its own set of ratios through successive powers, just like how the golden ratio gives you 0.618, 0.382, 0.236 and so forth. The silver ratio produces a completely different set of retracement levels, as does bronze, as does any arbitrary metallic number you want to choose.
This indicator calculates these metallic means using the standard alpha and beta formulas. For any metallic number k, alpha equals (k + sqrt(k² + 4)) / 2, and we generate retracement ratios by raising alpha to various negative powers. The script algorithmically generates these levels instead of hardcoding them, which is how it should have been done from the start. It's genuinely silly that most fib tools just hardcode the ratios when the math to generate them is straightforward. Even worse, traditional fib retracements use 0.5 as a level, which isn't even a fibonacci ratio. It's just thrown in there because it seems like it should be important.
The indicator works by first detecting swing points using the Sylvain Zig-Zag . The zig-zag identifies significant price swings by combining percentage change with ATR adjustments, filtering out noise and connecting major pivot points. This is what drives the retracement levels. Once a new swing is confirmed, the script calculates the range between the last two pivot points and generates metallic retracement levels from the most recent swing low or high.
You can adjust which metallic number to use (golden, silver, bronze, or any positive integer), control how many power ratios to display above and below the 1.0 level, and set how many complete retracement cycles you want drawn. The levels extend from the swing point and show you where price might react based on whichever metallic mean you've selected. The zig-zag settings let you tune the sensitivity of swing detection through ATR period, ATR multiplier, percentage reversal, and additional absolute or tick-based reversal values.
What this really demonstrates is that retracement analysis is more flexible than most traders realize. There's no mathematical law that says markets must respect the golden ratio over any other metallic mean. They're all valid mathematical constructs with the same kind of recursive properties. By making this tool, I wanted to highlight that using fibonacci retracements involves an arbitrary choice, and maybe that choice should be more deliberate or at least tested against alternatives. You can experiment with different metallic numbers and see which ones seem to work better for your particular market or timeframe, or just use this to understand that the standard fib levels everyone uses aren't as fundamental as they appear.

RPT Position Sizer🎯 Purpose
This indicator is a position sizing and stop-loss calculator designed to help traders instantly determine:
How many shares/contracts to buy,
How much risk (₹) they are taking per trade,
How much capital will be deployed, and
The precise stop-loss price level based on user-defined parameters.
It displays all key values in a compact on-chart table (bottom-left corner) for quick trade planning.
💡 Use Case
Perfect for discretionary swing traders, systematic position traders, and risk managers who want instant visual feedback of trade sizing metrics directly on the chart — eliminating manual calculations and improving discipline.
⚙️ Key Features
Dynamic Inputs
Trading Capital (₹) — total available capital for trading.
RPT % — risk-per-trade as a percentage of total capital.
SL % — stop-loss distance in percent below CMP (Current Market Price).
CMP Source — can be linked to close, hl2, etc.
Rounding Style — round position size to Nearest, Floor, or Ceil.
Decimals Show — control number formatting precision in the table.
Core Calculations
SL Points: CMP × SL%
SL Price: CMP − SL Points
Risk Amount (₹): Capital × RPT%
Position Size: Risk ÷ SL Points
Capital Used: Position Size × CMP
Clean On-Chart Table Display
Displays:
Trading Capital
RPT %
Risk Amount (₹)
Position Size (shares/contracts)
Capital Required (₹)
Stop-Loss % & SL Price
The table uses a minimalistic white-on-black design with clear labeling and rupee formatting for quick reference.
Data Window Integration
Plots hidden values (Position Size, Risk Amount, SL Points, Capital Used) for use in TradingView’s Data Window—ideal for strategy testing and exporting values.

Volatilidad Multi-TF📊 Multi-Timeframe Volatility (ATR%)
Description
Indicator that displays the current asset's volatility across multiple timeframes simultaneously. It uses the ATR (Average True Range) normalized as a percentage of price, allowing for objective volatility comparison across different timeframes.
✨ Key Features
- Multi-Timeframe Analysis: Visualize volatility across 5 different timeframes (1H, 4H, D, W, M)
- Normalized Volatility: ATR expressed as a percentage of price for accurate comparison
- Compact Table: Clean and easy-to-read interface in the corner of your chart
- Auto-Update: Automatically adapts to the asset you're viewing
- No Additional Plots: Only displays essential information in table format
🎯 How to Use
1. Add the indicator to your chart
2. The table will automatically display the current asset's volatility
3. Percentage values allow you to quickly identify:
- Which timeframe has higher/lower volatility
- Divergences between timeframes
- High or low volatility zones to adjust your strategies
⚙️ Configurable Parameters
- ATR Period: Default 14, adjust according to your strategy
📈 Practical Applications
- Risk Management: Adjust position sizing based on current volatility
- Asset Selection: Identify assets with suitable volatility for your profile
- Entry Timing: Detect volatility expansions/contractions
- Timeframe Analysis: Compare volatility across different time periods
💡 Technical Notes
- Normalized ATR allows volatility comparison between assets with different prices
- Useful for both intraday trading (1H, 4H) and swing/positional trading (D, W, M)
- Compatible with any market: cryptocurrencies, forex, stocks, indices
⚠️ Disclaimer
This indicator is a technical analysis tool. It does not constitute financial advice. Conduct your own analysis and risk management before trading.

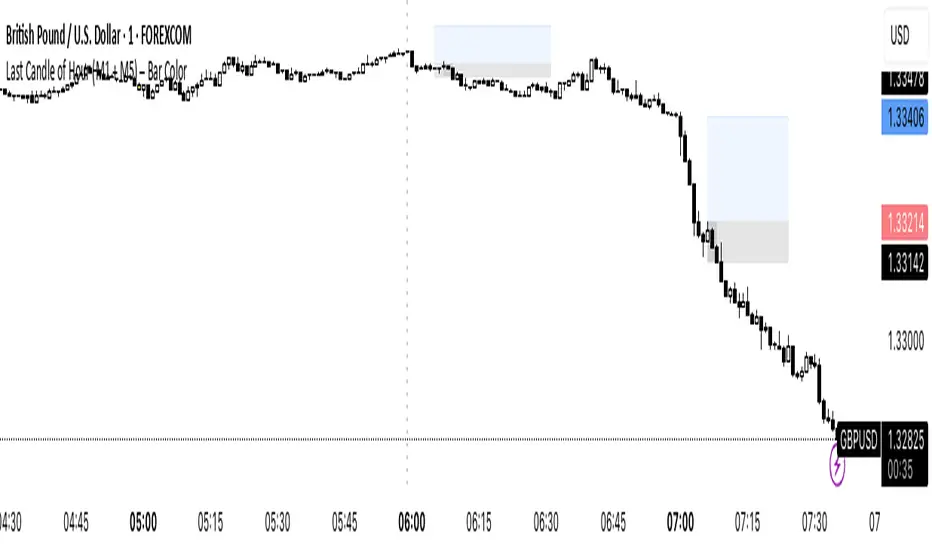
Last Candle of Hour Highlighter (M1 + M5)Highlights the last candle of every hour on 1-minute (M1) and 5-minute (M5) charts, making it easier to spot session closes, breakouts, and end-of-hour price action at a glance.
Detailed Description / How to Use:
This indicator automatically detects the last candle of each hour and changes its colour for quick visual reference. It’s designed for traders who use short-term timeframes (M1, M5) and want a clean visual cue for hourly closes.
Features:
• Automatically detects M1 and M5 timeframes.
• Highlights the last candle of each hour with a customisable colour.
• Optional Bull/Bear mode: colour changes depending on candle direction.
• Simple and lightweight — does not affect chart performance.
Inputs / Settings:
1. Color by Bull/Bear – Toggle on to automatically colour the last candle green (bullish) or red (bearish) based on its close relative to the open.
2. Highlight Colour – Choose a single colour if Bull/Bear mode is off.
3. Bullish Colour – Choose the colour for bullish last candles.
4. Bearish Colour – Choose the colour for bearish last candles.
Usage Tips:
• Works best on 1-minute and 5-minute charts.
• Ideal for spotting end-of-hour reversals, breakout candles, and momentum shifts.
• Can be combined with other indicators like support/resistance or moving averages for more advanced strategies.
Premarket Gapper Swing Filter (Long) – v6here’s a plug-and-play Pine Script v5 “screener” you can drop on any chart to flag pre-market gainers that also meet swing-friendly trend/liquidity filters. It works as a chart-level scanner (since Pine can’t screen the whole market by itself): add it to a watchlist; symbols that qualify will light up and you can set alerts to ping you right at the opening bell.

Event Marking [zidaniee]This is not a technical analysis indicator, but a visual tool designed to mark important global events using vertical lines on your chart.
By placing a single marker at the exact time an event occurred, you can compare how different assets reacted to that global event — before, during, and after it happened.
In the example provided, the marking corresponds to the moment when U.S. President Donald Trump announced a 100% tariff on goods from China, which was immediately reflected in market reactions worldwide.
The indicator includes full customization features for:
• Event label text
• Label size and position
• Line color, style, and width
Enjoy

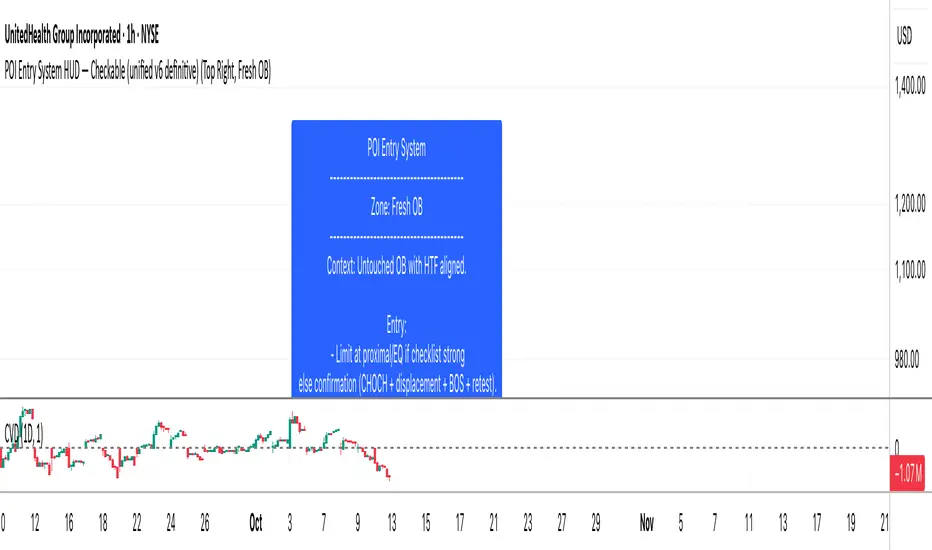
SMC POI Entry System HUDEntry, RR, Exit, of supply and demand zones taught in smart money trading. 12 types of zones and setups around Flips, Order Blocks, High Probability, and Extreme Demand Zones. Includes Checklist for Entry, Exit Rules, Take Profit Targets, Stop Loss spots, and Context

Test for firing alerts on candle openThis fires an alert on every candle open. Nice to use if you need to test the performance of TradingView Alerts.
Premarket & Extended Hours High/LowSnippet to display extended hours (ETH) and premarket graph displays. Once activated, you will see next to the UTC time display at the lower right corner of the graph window a dropdown option of RTH. Click on it and you'll see ETH. RTH: Regular Trading Hours -- ETH: Extended Trading Hours.
Multiverse ORBJust a simple ORB method to help you to decide. Built for Malaysian & US market. Simple tips, when you see the orb, get ready to TEKAN

Risk-Reward Position SizerRisk-Reward Position Sizer – Features Checklist
Purpose:
A visual calculator and position sizing tool for day traders, providing realistic risk, stop-loss, take-profit, and reward-to-risk information based on account size and position constraints.
Features:
Flexible Risk Settings
Set risk as a percentage of your account or a fixed dollar amount per trade.
Automatically calculates position size based on desired risk and stop distance.
Stop Loss Options
Stop distance can be defined as a percent of entry price or a fixed price.
Automatically adjusts stop distance when position is cash-limited to achieve your target risk.
Take Profit Options
TP can be defined as a fixed R multiple (e.g., 2R) or fixed absolute price.
Cash-Limited Position Handling
Optional “Cap Position to Account Size” prevents buying more shares than your cash allows.
Shows actual achievable risk if your cash limits position size.
Realistic Risk / Reward Calculations
Calculates Actual Risk $ based on position size and stop distance.
Calculates Projected Win $ based on take profit and position size.
Calculates Actual Reward-to-Risk (R:R) ratio using actual stop and TP.
Position Metrics
Estimated quantity of shares/contracts to buy.
Estimated position value.
Estimated leverage used relative to account size.
Top-Right Table Display
Clear, compact table showing:
Account size
Target risk $
Actual risk $
Stop distance
Quantity
Position value
Take profit and stop-loss prices
Projected win $ and %
Projected loss %
Actual R:R
Leverage
Trading Decision Aid
Gives traders a realistic snapshot of achievable risk and reward before entering a trade.
Helps avoid the common trap of setting tight stops that don’t actually match desired account risk.
Why It’s Useful:
This indicator turns abstract risk/reward concepts into concrete, actionable numbers, helping day traders size positions safely, plan stops and targets realistically, and maintain consistent risk management across trades.

Forex Session High/Low TrackerThis indicator maps out each Forex session along with their relative highs and lows.
