15m FVG Inversion + Order BlockThe indicator finds the inversion of the FVG 15 minutes and the order block, after which it gives an entry signal.
Titik Pivot
StockAlgo | Alpha v1.1Stock Algo Alpha provides Buy Sell indicators along with automated trading ability.

Tomorrow's Pivot Points [SMH]這個TradingView指標不同於內置的Pivot Point指標,因為它能夠提前顯示明天的Pivot Point。透過預測下一交易日的支撐與阻力位置,交易員可以更早部署策略,為隔日的市場波動做好準備。
This TradingView indicator is different from the built-in Pivot Point tool because it can display tomorrow’s Pivot Points in advance. By forecasting support and resistance levels for the next trading day, traders can position their strategies earlier and be well-prepared for upcoming market movements.

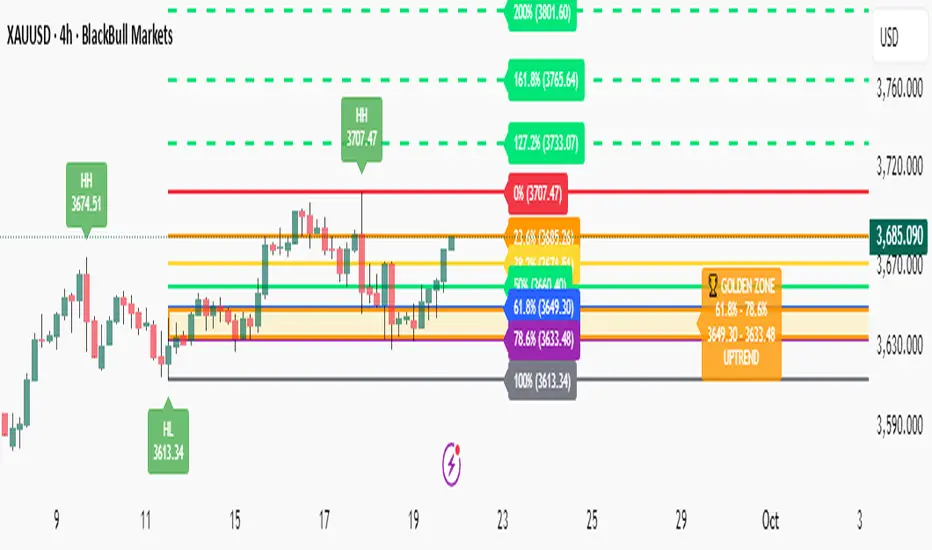
Fibonacci with Golden Zone - Trend Aware🎯 What This Indicator Does:
This advanced Fibonacci tool automatically detects trend direction and adapts Golden Zone calculations accordingly, providing dynamic support/resistance levels with market structure analysis.
✨ Key Features:
🔄 Trend-Aware Golden Zone: Automatically adjusts 61.8%-78.6% zone based on market direction
📈 Market Structure Labels: Shows HH, HL, LH, LL patterns with price levels
🎯 Smart Fibonacci Levels: Retracements (0%, 23.6%, 38.2%, 50%, 61.8%, 78.6%, 100%)
🚀 Extension Targets: 127.2%, 161.8%, 200%, 261.8% projections
📊 Pivot Points: Optional daily/weekly pivot levels
🔔 Smart Alerts: Golden Zone entry and extension target alerts
🧠 How It Works:
Uptrend: Golden Zone acts as support (retracement from swing high)
Downtrend: Golden Zone acts as resistance (retracement from swing low)
Auto-Detection: Uses trend MA to determine market direction
Structure Analysis: Identifies swing patterns for better entries
⚙️ Settings:
Lookback Period: Swing detection sensitivity (5-50)
Trend Period: Moving average for trend detection (20-200)
Golden Zone: Toggle 61.8%-78.6% zone display
Market Structure: Show HH/HL/LH/LL labels
Pivot Points: Optional daily pivot levels
📋 Best Use Cases:
🥇 Gold/Forex Trading: Perfect for XAUUSD analysis
📈 Swing Trading: Identify key reversal zones
🎯 Target Setting: Extension levels for profit taking
📊 Trend Following: Align trades with market direction
🎨 Visual Features:
🟡 Golden Zone Box: Highlighted support/resistance area
🏷️ Price Labels: Exact levels on all Fibonacci lines
🎨 Color Coding: Green for uptrend, Red for downtrend
📱 Clean Interface: Professional, non-cluttered design
🔔 Alert System:
🏆 Price entering Golden Zone
🎯 Approaching extension targets (127.2%, 161.8%)
📊 Includes trend direction in alerts
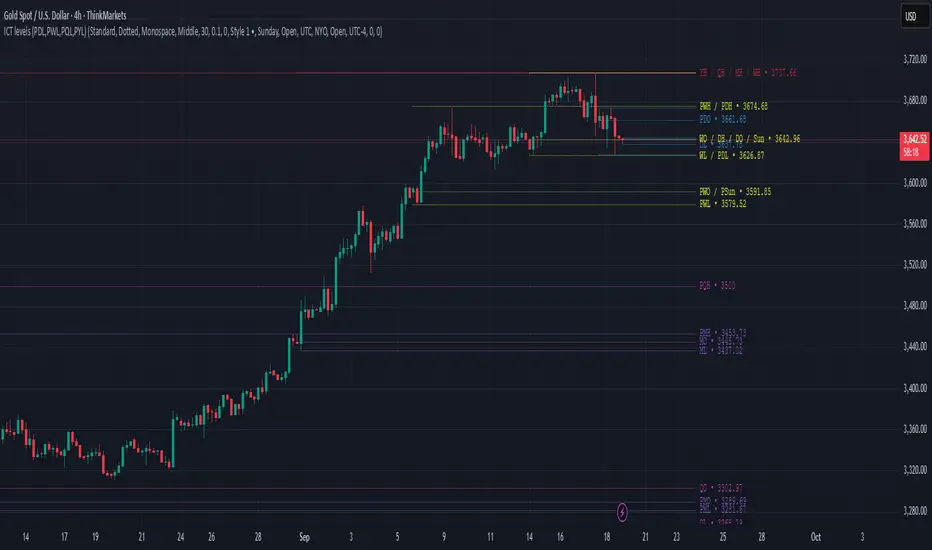
ICT levels (PDL,PWL,PQL,PYL) PDHThis indicator plots ICT reference levels for multiple timeframes, including:
Daily (DO, DH, DL, PDO, PDH, PDL)
Weekly (WO, WH, WL, PWO, PWH, PWL)
Monthly (MO, MH, ML, PMO, PMH, PML)
Quarterly (QO, QH, QL, PQO, PQH, PQL)
Yearly (YO, YH, YL, PYO, PYH, PYL)
🔹 Custom Target (NYO or user-defined):
The script also lets you display a special target level (e.g. New York Open) at a user-defined hour:minute with selectable timezone.
🔹 Day of Week levels (DoW):
You can choose a specific weekday (e.g. Tuesday Open/High/Low/Close) with adjustable timezone, allowing flexible session-based analysis.
🔹 Display & Style Options:
Extend lines (None, Right, Left, Both)
Line style (Solid, Dashed, Dotted)
Font type (Default, Monospace)
Label position (Top or Middle, with spacing adjustment)
Offset bars for labels
Merge labels if levels are too close (threshold % configurable)
🔹 Priority Handling:
Includes High Timeframe Priority (TFP) option so higher-TF levels overwrite lower ones when overlapping.
🔹 Customization:
Global text and line colors
Individual colors for Day, Week, Month, Quarter, Year, DoW, and Target
Option to show/hide prices next to labels in different styles
Previous OHLC D/W/M (Anchored - fixed)Open, close, high and low of previous month, week and day with right extension.

EMA Support & ResistanceEducational Purpose only
This indicator combines VWAP, multiple Exponential Moving Averages (EMA 20,/VWAP ), Support and Resistance
VWAP (Volume Weighted Average Price) helps identify fair value and intraday bias.
EMA 20 act as dynamic support and resistance levels for short, medium, and long-term trends.
CPR (Central Pivot Range) is calculated from the previous day’s High, Low, and Close. It provides intraday reference zones S1/S2/S3 & R1/R2/R3 that traders use to gauge market direction and trend strength.
This tool is built for educational purposes only — to help visualize common support & resistance zones and learn how VWAP + EMAs + S/R interact in live markets. It is not financial advice and should not be used as a standalone trading system.

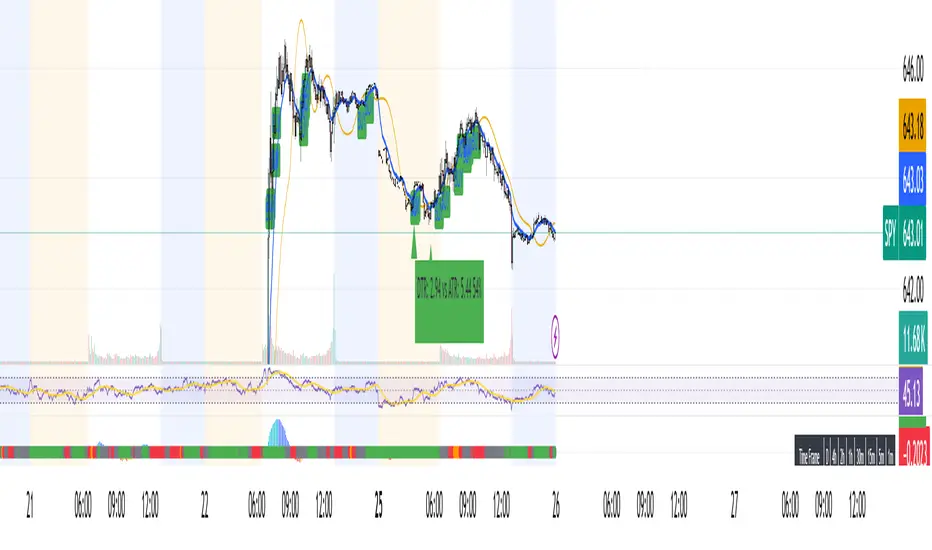
Weekly/Monthly Golden ATR LevelsWeekly/Monthly Golden ATR Levels
This indicator is designed to give traders a clear, rule-based framework for identifying support and resistance zones anchored to prior period ranges and the market’s own volatility. It uses the Average True Range (ATR) as a measure of how far price can realistically stretch, then projects fixed levels from the midpoint of the prior week and prior month.
Rather than “moving targets” that repaint, these levels are frozen at the start of each new week and month and stay fixed until the next period begins. This makes them reliable rails for both intraday and swing trading.
What It Plots
Weekly Midpoint (last week’s High + Low ÷ 2)
From this mid, the script projects:
Weekly +1 / −1 ATR
Weekly +2 / −2 ATR
Monthly Midpoint (last month’s High + Low ÷ 2)
From this mid, the script projects:
Monthly +1 / −1 ATR
Monthly +2 / −2 ATR
Customization
Set ATR length & timeframe (default: 14 ATR on Daily bars).
Adjust multipliers for Level 1 (±1 ATR) and Level 2 (±2 ATR).
Choose line color, style, and width separately for weekly and monthly bands.
Toggle labels on/off.
How to Use
Context at the Open
If price opens above last week’s midpoint, bias favors upside toward +1 / +2.
If price opens below the midpoint, bias favors downside toward −1 / −2.
Weekly Bands = Short-Term Rails
+1 / −1 ATR: Rotation pivots. Expect intraday reaction.
+2 / −2 ATR: Extreme stretch zones. Reversals or breakouts often occur here.
Monthly Bands = Big Picture Rails
Use these for swing positioning, or as “outer guardrails” on intraday charts.
When weekly and monthly bands cluster → high-confluence zone.
Trade Playbook
Trend Day: Hold above +1 → target +2. Break below −1 → target −2.
Range Day: Fade first test of ±2, scalp toward ±1 or midpoint.
Catalyst/News Day: Use with caution—levels provide context, not barriers.
Risk Management
Place stops just outside the band you’re trading against.
Scale profits at the next inner level (e.g., short from +2, cover partial at +1).
Runners can trail to the midpoint or opposite side.
Why It Works
ATR measures volatility—how far price tends to travel in a given period.
Anchoring to prior highs and lows captures where real supply/demand last clashed.
Combining the two gives levels that are statistically relevant, widely observed, and psychologically sticky.
Trading books from Mark Douglas (Trading in the Zone), Jared Tendler (The Mental Game of Trading), and Oliver Kell (Victory in Stock Trading) all stress the importance of having objective, repeatable reference points. These levels deliver that discipline—removing guesswork and reducing emotional trading

Interval Highlighter with High/Low AlertsInterval Highlighter with High/Low Alerts
Overview:
This Pine Script indicator enhances chart analysis by highlighting specific time intervals and marking the highest and lowest prices within those periods. It supports three customizable modes:
Date Range: Highlight a user-defined period with background shading and plot the highest and lowest prices.
Days of the Week: Highlight specific weekdays with background colors and plot the highest and lowest prices for each day.
Intraday Interval: Highlight a specific intraday time range (e.g., 12:30 PM to 4:30 PM) with background shading and plot the highest and lowest prices within that interval.
Alerts are triggered when the price touches any of the highlighted high or low levels, providing real-time notifications for potential trading opportunities.
High and low lines extend to the right and remain visible after the interval ends. This ensures they act as actionable reference points for alerts between intervals, allowing users to monitor critical levels until a new interval of the same category forms.
Features:
Customizable Time Intervals: Define specific date ranges, weekdays, or intraday intervals to highlight on the chart.
High/Low Tracking: Automatically plots the highest and lowest prices within the defined intervals.
Real-Time Alerts: Set up alerts to notify when the price touches any of the highlighted high or low levels.
Actionable Lines: High/low lines remain visible after interval completion to serve as reference points for alerts.
Visual Enhancements: Customize background colors and line styles for each interval type.
Usage:
Apply the indicator to your chart.
Configure the desired modes (Date Range, Days of the Week, Intraday Interval) in the settings.
Customize the appearance settings to match your preferences.
Set up alerts based on the highlighted high/low levels.
Disclaimer:
This indicator is designed to assist in identifying potential areas of interest based on historical high and low levels within specified intervals. It is not intended as a standalone trading signal. Users should employ additional technical analysis tools and conduct thorough research before making trading decisions.

TrenVantage LITE TrenVantage LITE - Smart Trend Detector
"Professional ZigZag trend detection with real-time alerts and market structure analysis. Clean interface shows trend direction, price changes, and swing data."
TrenVantage LITE delivers professional-grade trend detection using advanced ZigZag analysis to identify market structure and trend changes in real-time. Built with a logic that goes beyond basic pivot detection, this free version provides essential trend analysis tools with a clean, intuitive interface designed for traders of all experience levels.
Key Features:
Advanced Trend Detection
Smart ZigZag Algorithm: Proprietary trend foundation model based on market structure principles
Customizable Sensitivity: Choose between Points or Percentage-based deviation settings
Real-Time Updates: Calculate on bar close or tick-by-tick for immediate trend changes
Flexible Analysis: 15-25 bar lookback range with 20-bar default setting
Visual Analysis Tools
Clean Trend Lines: Customizable color and width for optimal chart visibility
Professional Interface: Modern status box showing current trend and price metrics
Multiple Positioning: Place status box in any corner to match your chart layout
Market Structure: Clear visualization of swing highs and lows
Smart Alerts System
Trend Change Notifications: Instant alerts when market transitions between uptrend and downtrend
Reliable Detection: Confirmed trend changes based on significant price movements
Multiple Alert Options: Compatible with TradingView's alert system
How It Works
TrenVantage LITE uses a sophisticated ZigZag algorithm that goes beyond simple pivot detection. Our proprietary "trend-start model" identifies meaningful market structure changes by:
Analyzing Price Action: Uses high/low or close prices based on your preference
Filtering Noise: Customizable deviation thresholds eliminate false signals
Confirming Trends: Only signals trend changes after significant price movement
Tracking Structure: Maintains swing history for comprehensive analysis
Status Box Information
The integrated status box provides at-a-glance market information.
Current Trend Direction: Clear uptrend/downtrend identification with visual indicators
Live Price Data: Current price with session change and percentage movement
Swing Analysis: Number of detected swings with trend-only limitation indicator
Clean Design: Professional appearance that doesn't clutter your chart
Settings & Customization
ZigZag Parameters:
Deviation Type: Points (fixed price difference) or Percent (percentage change)
Deviation Value: Minimum price movement required to create new swing
Use High Low: Toggle between high/low prices vs close prices for analysis
Calculate Mode: Choose bar close confirmation or real-time tick updates
Lookback Range: Adjust historical analysis from 15-25 bars
Visual Controls
Trend Line Color: Customize line color to match your chart theme
Line Width: Adjust thickness from 1-4 pixels for optimal visibility
Status Box: Toggle display and choose corner positioning
Best Practices:
Timeframe Selection
Scalping (1-5min): Use 0.3-0.8 Points deviation with tick calculation
Day Trading (15-60min): Use 1-3 Points or 0.2-0.5% deviation
Swing Trading (4H-Daily): Use 0.5-1.5% deviation with bar close calculation
Getting Started
Add to Chart: Apply TrenVantage LITE to your preferred timeframe
Adjust Settings: Configure deviation and visual preferences
Set Alerts: Enable trend change notifications for your trading strategy
Analyze Trends: Use the status box and visual lines to identify market direction
Upgrade When Ready: Explore RETAIL version for Support/Resistance levels
Ready to Level Up? Upgrade to TrenVantage RETAIL
While TrenVantage LITE provides solid trend analysis, TrenVantage RETAIL transforms your trading with professional-grade market structure tools:
What You're Missing in LITE:
Support and Resistance level detection - automatically identifies key price levels where markets react
Price labels on levels - see exact values instantly without hovering or zooming
Enhanced status box - shows distance to nearest support/resistance for timing entries and exits
Up to 5 key levels - comprehensive coverage of important price zones
Level strength indicators - understand which levels are most likely to hold
Professional workflow - combines trend analysis with key level identification
TrenVantage RETAIL takes the solid trend foundation you see in LITE and adds the critical support/resistance analysis that serious traders rely on daily.
Disclaimer: Trading involves risk of loss. This indicator is for educational and analysis purposes. Past performance does not guarantee future results. Always use proper risk management and never risk more than you can afford to lose.

Pivots + EMAIndicators Pivot points and 2 EMAs combined. It can be used to find support and resistance levels and shows Exponential Moving Average lines


Draw Trend LinesSometimes the simplest indicators help traders make better decisions. This indicator draws simple trend lines, the same lines you would draw manually.
To trade with an edge, traders need to interpret the recent price action, whether it's noisy or choppy, or it's trending. Trend Lines will help traders with that interpretation.
The lines drawn are:
1. lower tops
2. higher bottoms
Because trends are defined as higher lows, or lower highs.
When you see "Wedges", formed by prices chopping between top and bottom trend lines, that's noisy environment not to be traded. When you learn to "stop yourself", you already have an edge.
Often when you see a trend, it's still not too late. Trend will continue until it doesn't. But the caveat is a very steep trend is unlikely to continue, because buying volume is extremely unbalanced to cause the steep trend, and that volume will run out of energy. (Same on the sell side of course)
Trends can reverse, and when price action breaks the trend line, Breakout/Breakdown traders can take this as an entry signal.
Enjoy, and good trading!

Volume Profile + Pivot Levels [ChartPrime]⯁ OVERVIEW
Volume Profile + Pivot Levels combines a rolling volume profile with price pivots to surface the most meaningful levels in your selected lookback window. It builds a left-side profile from traded volume, highlights the session’s Point of Control (PoC) , and then filters pivot highs/lows so only those aligned with significant profile volume are promoted to chart levels. Each promoted level extends forward until price retests it—so your chart stays focused on levels that actually matter.
⯁ KEY FEATURES
Rolling Volume Profile (Period & Resolution)
Calculates a profile over the last Period bars (default 200). The profile is discretized into Volume Profile Resolution bins (default 50) between the highest high and lowest low inside the window. Each bin accumulates traded volume and is drawn as a smooth left-side polyline for compact, lightweight rendering.
HL = array.new()
// collect highs/lows over 'start' bars to define profile range
for i = 0 to start - 1
HL.push(high ), HL.push(low )
H = HL.max(), L = HL.min()
bin_size = (H - L) / bins
// accumulate per-bin volume
for i = 0 to bins - 1
for j = 0 to start - 1
if close >= (L + bin_sizei) - bin_size and close < (L + bin_size*(i+1)) + bin_size
Bins += volume
Delta-Aware Coloring
The script tracks up-minus-down volume across all period to compute a net Delta . The profile, PoC line, and PoC label adopt a teal tone when net positive, and maroon when net negative—an immediate read on buyer/seller dominance inside the window.
Point of Control (PoC) + Volume Label
Automatically marks the highest-volume bin as the PoC . A horizontal PoC line extends to the last bar, and a label shows the absolute volume at the PoC. Toggle visibility via PoC input.
Pivot Detection with Volume Filter
Identifies raw pivots using Length (default 10) on both sides of the bar. Each candidate pivot is then validated against the profile: only pivots that land within their bin and meet or exceed the Filter % threshold (percentage of PoC volume) are promoted to chart levels. This removes weak, low-participation pivots.
// pivot promotion when volume% >= pivotFilter
if abs(mid - p.value) <= bin_size and volPercent >= pivotFilter
// draw labeled pivot level
line.new(p.index - pivotLength, p.value, p.index + pivotLength, p.value, width = 2)
Forward-Extending, Self-Stopping Levels
Promoted pivot levels extend forward as dotted rays. As soon as price intersects a level (high/low straddles it), that level stops extending—so your chart doesn’t clutter with stale zones.
Concise Level Labels (Volume + %)
Each promoted pivot prints a compact label at the pivot bar with its bin’s absolute volume and percentage of PoC volume (ordering flips for highs vs. lows for quick read).
Lightweight Visuals
The volume profile is rendered as a smooth polyline rather than dozens of boxes, keeping charts responsive even at higher resolutions.
⯁ SETTINGS
Volume Profile → Period : Lookback window used to compute the profile (max 500).
Volume Profile → Resolution : Number of bins; higher = finer structure.
Volume Profile → PoC : Toggle PoC line and volume label.
Pivots → Display : Show/hide volume-validated pivot levels.
Pivots → Length : Pivot detection left/right bars.
Pivots → Filter % 0–100 : Minimum bin strength (as % of PoC) required to promote a pivot level.
⯁ USAGE
Read PoC direction/color for a quick net-flow bias within your window.
Prioritize promoted pivot levels —they’re backed by meaningful participation.
Watch for first retests of promoted levels; the line will stop extending once tested.
Adjust Period / Resolution to match your timeframe (scalps → higher resolution, shorter period; swings → lower resolution, longer period).
Tighten or loosen Filter % to control how selective the level promotion is.
⯁ WHY IT’S UNIQUE
Instead of plotting every pivot or every profile bar, this tool cross-checks pivots against the profile’s internal volume weighting . You only see levels where price structure and liquidity overlap—clean, data-driven levels that self-retire after interaction, so you can focus on what the market actually defends.

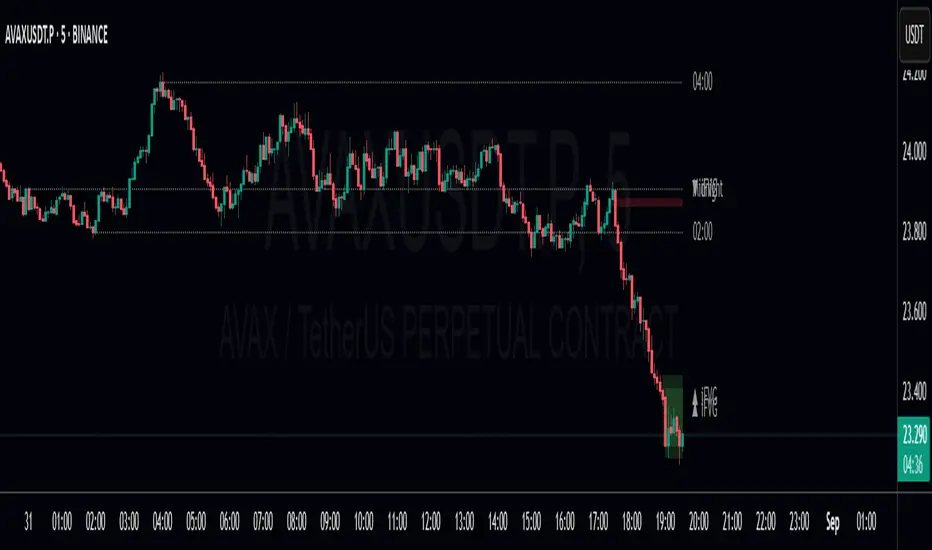
Candle Opening Price & FVG/iFVGIndicator Description: Candle Opening Price & Fair Value Gaps w/(iFVGs)
This powerful, multi-purpose indicator combines two essential trading concepts into one comprehensive tool, designed to provide traders with key price levels and areas of market imbalance.
What It Does
1. Customizable Candle Open Lines: This feature allows you to mark the opening price of specific candles from key trading sessions throughout the day.
Up to 7 Custom Time Inputs: You can define up to seven different times (e.g., "08:30" for London Open, "09:30" for New York Open).
Automatic Horizontal Lines: The script automatically draws a persistent horizontal line at the opening price of the candle corresponding to your set time.
Full Customization: Each line can be independently enabled or disabled and styled with a unique color, width, and line style (solid, dashed, dotted), allowing for a clean and personalized chart setup.
Use Cases: Ideal for marking session opens, news event candles, or any other time-based level that you consider significant for support, resistance, or directional bias.
2. Dynamic Fair Value Gaps (FVG) & Inversions (iFVG): This part of the indicator automatically identifies, draws, and manages Fair Value Gaps, a core concept in modern price action trading.
Automatic FVG Detection: The script identifies both Bullish FVGs (areas of buying inefficiency) and Bearish FVGs (areas of selling inefficiency) based on the classic three-bar pattern.
Clear Visualization: Discovered FVGs are drawn as colored boxes on the chart, extending into the future until they are mitigated. Colors for Bullish and Bearish FVGs are fully customizable.
Inversion Logic: When price wicks into an FVG, the box changes color to signify an "inversion." A Bullish FVG that gets tapped becomes potential resistance (Bearish Inversion), and a Bearish FVG becomes potential support (Bullish Inversion). This dynamic shift helps you track how the market is interacting with these zones.
Zone Mitigation: Once an inverted FVG is fully reclaimed by a candle close, the zone is considered "mitigated" and the box is automatically removed from the chart, keeping your view focused on relevant, active zones.
Disclaimer
This indicator is for educational and informational purposes only and should not be construed as financial advice. Trading in financial markets involves substantial risk, and there is always the potential for loss. Past performance is not indicative of future results.
The signals, levels, and zones generated by this tool are based on historical price data and mathematical formulas; they do not predict the future with certainty. You should always conduct your own research, practice sound risk management, and consult with a qualified financial advisor before making any trading decisions. The author and TradingView are not responsible for any financial losses you may incur by using this script. Use at your own risk.
Auto Pivot Entry SL TPDescription:
The Auto Pivot Entry SL TP indicator automatically detects Pivot Highs and Pivot Lows to generate precise BUY and SELL trade setups.
When a Pivot Low forms, a BUY setup is displayed with Entry, Stop Loss, and multiple Take Profit (TP1–TP3) levels.
When a Pivot High forms, a SELL setup is displayed with Entry, Stop Loss, and multiple Take Profit (TP1–TP3) levels.
Key Features:
Automatic detection of pivots for trade entries.
Clear visualization of Entry, SL, and TP levels directly on the chart.
Flexible Risk-Reward ratio settings for customizable targets.
Works on all symbols and timeframes.
This tool is designed for traders who want a simple yet effective method to plan trades using price action pivot points combined with predefined risk management (SL & TP levels).

Market Reversal Time HighlightsThis indicator marks the times when the market has an inflection or reversal.
This script is customizable and free to use

MTF Last Closed Highs & LowsThis indicator plots the most recent closed high and low levels from multiple timeframes (4H, Daily, Weekly, Monthly, etc.) directly on your chart. It helps traders quickly spot key support and resistance zones, track market structure across different timeframes, and identify breakout or reversal opportunities.

The Perfect Timing IndicatorFlashes a green arrow on your screen when bullish momentum is starting to build.
Better Pivot Points [LuminoAlgo]Overview
The Better Pivot Points indicator is an advanced trend analysis tool that combines Supertrend methodology with automated pivot point identification and zigzag visualization. This indicator helps traders identify significant price turning points and visualize market structure through dynamic pivot labeling and connecting lines.
How It Works
This indicator utilizes a Supertrend-based algorithm to detect meaningful pivot points in price action. Unlike traditional pivot point indicators that rely on fixed time periods, this tool dynamically identifies pivots based on trend changes, providing more relevant and timely signals.
The algorithm tracks trend changes using ATR-based Supertrend crossovers to determine when significant highs and lows have formed. When a trend reversal is detected, the indicator marks the pivot point and draws connecting lines to visualize price flow and market structure progression.
Key Features
• Dynamic Pivot Detection: Automatically identifies high and low pivot points using Supertrend crossovers
• Market Structure Labeling: Labels pivots as HH (Higher High), LH (Lower High), HL (Higher Low), or LL (Lower Low)
• Zigzag Visualization: Connects pivot points with customizable lines to clearly show price flow and market structure
• Color-Coded Analysis: Uses distinct colors to indicate bullish trends (green), bearish trends (red), and neutral conditions (yellow)
• Customizable Parameters: Adjustable ATR period, factor, line width, and line style
Input Settings
• ATR Length: Controls the sensitivity of the Supertrend calculation (default: 21)
• Factor: Multiplier for the ATR-based Supertrend bands (default: 2.0)
• Zigzag Line Width: Customize the thickness of connecting lines (1-4)
• Zigzag Line Style: Choose between Solid, Dashed, or Dotted line styles
What Makes This Original
This indicator combines several analytical concepts into a cohesive tool that differentiates it from standard pivot point indicators:
1. Uses Supertrend crossovers as the trigger for pivot detection rather than traditional high/low lookback periods
2. Automatically categorizes market structure using HH/LH/HL/LL labeling system based on pivot relationships
3. Provides real-time zigzag visualization with intelligent color coding that reflects trend direction
4. Integrates trend direction analysis with structural pivot identification in a single comprehensive tool
The underlying calculations use custom logic for tracking trend states, validating pivot points, and determining appropriate color coding based on market structure analysis.
How to Use
1. Trend Identification: Green lines indicate bullish market structure, red lines show bearish structure, yellow indicates transitional periods
2. Support/Resistance: Pivot points often act as future support and resistance levels for price action
3. Market Structure Analysis: HH and HL patterns suggest uptrends, while LH and LL patterns indicate downtrends
4. Entry/Exit Planning: Use pivot points and trend changes to plan potential trade entries and exits
Important Limitations and Warnings
• This indicator is a technical analysis tool and should not be used as the sole basis for trading decisions
• Pivot points are identified after price moves occur, meaning this indicator has inherent lag and cannot predict future pivots
• False signals can occur during ranging or choppy market conditions where trends are unclear
• Past performance of any indicator does not guarantee future results or trading success
• The indicator works best in clearly trending markets and may produce less reliable signals in sideways price action
• This tool requires interpretation and should be combined with other forms of analysis
• Always use proper risk management and position sizing strategies when trading
Why This Script Is Protected
This indicator uses proprietary algorithms for pivot detection timing, trend state management, and market structure analysis that represent original research and development. The specific logic for pivot validation, color-coding methodology, and structural relationship calculations contains unique approaches that differentiate it from standard pivot point indicators available in the public library.
Disclaimer
This indicator is for educational and analysis purposes only and does not constitute investment advice. Trading involves substantial risk and is not suitable for all investors. Past results are not indicative of future performance. The future is fundamentally unknowable and past results in no way guarantee future performance. Always conduct your own research and consider your risk tolerance before making any trading decisions.

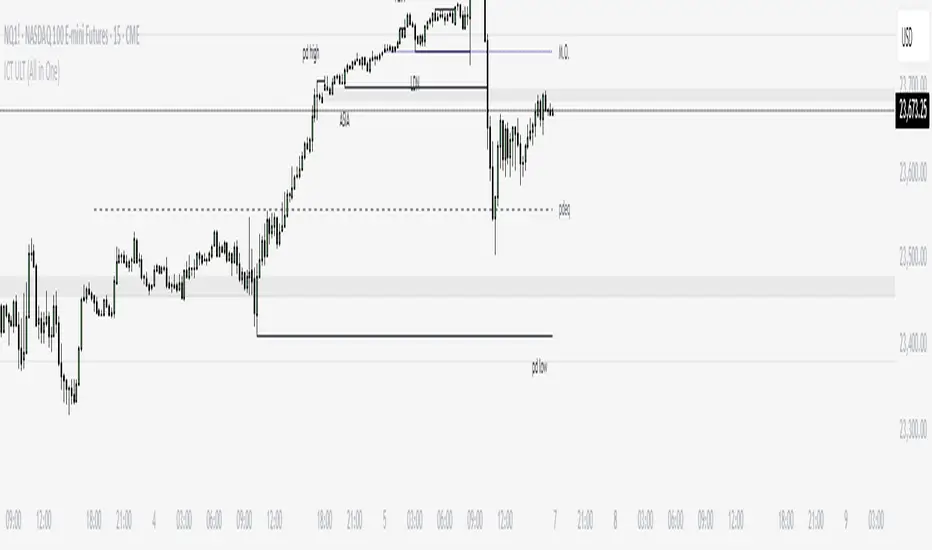
ICT ULT
This indicator is for lazy people like me who want to automate the process of marking certain ICT key levels using the indicator's features, such as:
Custom Killzone/Session Liquidity Levels in form of Highs and Lows
Killzone Drawings (Boxes)
Previous Day High/Low (PDH/PDL)
Previous Day Equlibrium (PDEQ)
Previous Week High/Low
New Day/Week Opening Gaps (NDOG/NWOG)
Custom Opening Prices (horizontal) (e.g. Midnight Open)
Custom Timestamps (vertical)
*Note: All features are completely customizable
inspired by: @tradeforopp
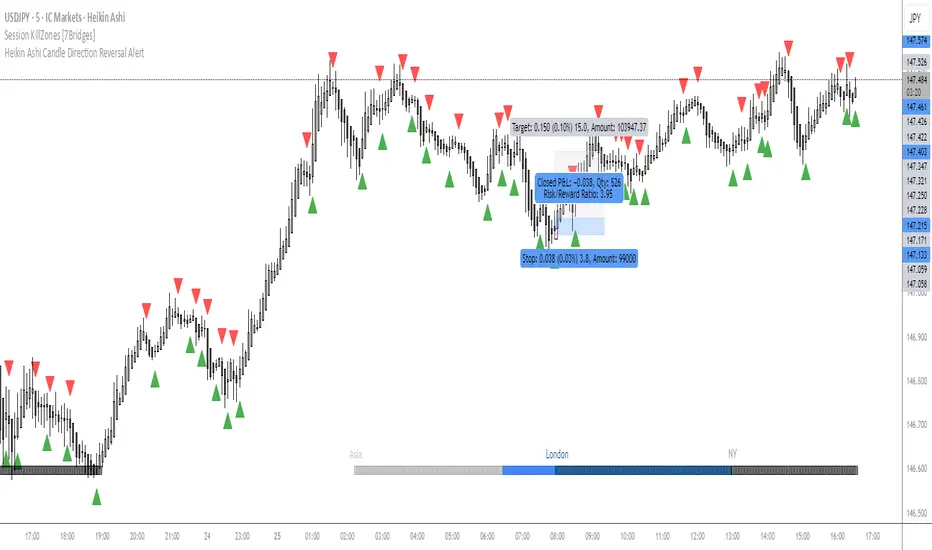
OMN Heikin Ashi Candle Direction Reversal AlertThis is a indicator to let you know once Heikin Ashi candle has changed direction compared to the candle before it. Set an alert on the indicator to get an audible alert.
Dynamic Value Zone Oscillator (DVZO) - @CRYPTIK1Dynamic Value Zone Oscillator (DVZO) @CRYPTIK1
Introduction: What is the DVZO?
The Dynamic Value Zone Oscillator (DVZO) is a powerful momentum indicator that reframes the classic "overbought" and "oversold" concept. Instead of relying on a fixed lookback period like a standard RSI or Stochastics, the DVZO measures the current price relative to a significant, higher-timeframe Value Zone (e.g., the previous week's entire price range).
This gives you a more contextual and structural understanding of price. The core question it answers is not just "Is the price moving up or down quickly?" but rather, "Where is the current price in relation to its recently established area of value?"
This allows traders to identify true "premium" (overbought) and "discount" (oversold) levels with greater accuracy, leading to higher-probability reversal and trend-following signals.
The Core Concept: Price vs. Value
The market is constantly trying to find equilibrium or "fair value." The DVZO is built on the principle that the high and low of a significant prior period (like the previous day, week, or month) create a powerful area of perceived value.
The Value Zone: The range between the high and low of the selected higher timeframe. The midpoint of this zone is the equilibrium (0 line on the oscillator).
Premium Territory (Distribution Zone): When price breaks above the Value Zone High (+100 line), it is trading at a premium. This is an area where sellers are more likely to become active and buyers may be over-extending.
Discount Territory (Accumulation Zone): When price breaks below the Value Zone Low (-100 line), it is trading at a discount. This is an area where buyers are more likely to see value and sellers may be exhausted.
By anchoring its analysis to these significant structural levels, the DVZO filters out much of the noise from lower-timeframe price fluctuations.
Key Features
The Oscillator:
The main blue line visualizes exactly where the current price is within the context of the Value Zone.
+100: The high of the Value Zone.
0: The midpoint/equilibrium of the Value Zone.
-100: The low of the Value Zone.
Automatic Divergence Detection:
The DVZO automatically identifies and plots bullish and bearish divergences on both the price chart and the oscillator itself.
Bullish Divergence: Price makes a new low, but the DVZO makes a higher low. This is a strong signal that downside momentum is fading and a reversal to the upside is likely.
Bearish Divergence: Price makes a new high, but the DVZO makes a lower high. This indicates that upside momentum is waning and a pullback is probable.
Value Migration Histogram:
The purple histogram in the background visualizes the width of the Value Zone.
Expanding Histogram: Volatility is increasing, and the accepted value range is getting wider.
Contracting Histogram: Volatility is decreasing, and the price is coiling in a tight range, often in anticipation of a major breakout.
How to Use the DVZO: Trading Strategies
1. Reversion Trading
This is the most direct way to use the indicator.
Look for Buys: When the DVZO line drops below -100, the price is in the "Accumulation Zone." Wait for the price to show signs of strength (e.g., a bullish candle pattern) and the DVZO line to start turning back up towards the -100 level. This is a high-probability mean reversion setup.
Look for Sells: When the DVZO line moves above +100, the price is in the "Distribution Zone." Look for signs of weakness (e.g., a bearish engulfing candle) and the DVZO line to start turning back down towards the +100 level.
2. Divergence Trading
Divergences are powerful confirmation signals.
Entry Signal: When a Bullish Divergence appears, it provides a strong entry signal for a long position, especially if it occurs within the Accumulation Zone (below -100).
Exit/Short Signal: When a Bearish Divergence appears, it can serve as a signal to take profit on long positions or to look for a short entry, especially if it occurs in the Distribution Zone (above +100).
3. Best Practices & Settings
Timeframe Synergy: The DVZO is most effective when your chart timeframe is lower than your selected Value Zone Source.
For Day Trading (e.g., 1H, 4H chart): Use the "Previous Day" Value Zone.
For Swing Trading (e.g., 1D, 12H chart): Use the "Previous Week" or "Previous Month" Value Zone.
Confirmation is Key: The DVZO is a powerful tool, but it should not be used in isolation. Always combine its signals with other forms of analysis, such as market structure, support/resistance levels, and candlestick patterns, for confirmation.