Gann Dynamic Levels [SmartFoxy]# 🌌 Gann Dynamic Levels
Gann Dynamic Levels is a dynamic Gann-based framework that calculates proportional and exponential levels using customizable methods — including planetary ratios.
Perfect for traders focused on cycles , ratios , and harmonic structures .
Inspired by the geometric and harmonic principles of W.D. Gann , this multifunctional tool automatically plots time–price projection levels based on user-defined anchor points.
It combines multiple calculation techniques to capture both linear and exponentia l market symmetries.
The indicator adapts dynamically to price movement, helping traders identify potential reversal zones , time clusters , and harmonic expansions derived from proportional and planetary relationships.
---
## ⚙️ Core Features
Five Calculation Methods — Linear, ratio-based, geometric, and exponential spacing for multi-perspective analysis.
Planetary Scaling Mode — Optional mode based on astronomical distances (Titius–Bode Law), adding an astronomical dimension to level spacing.
Adaptive Offset Control — Shifts all projected levels left or right proportionally without changing their internal spacing.
Automatic Label Management — Dynamically updates or reuses labels for better clarity and improved chart performance.
Custom Styling — Full control over colors, widths, label positions, and line styles for each method.
---
## 🌐 Purpose
Designed for traders who combine Gann theory , harmonic ratios , and cyclical timing to visualize equilibrium zones and future market symmetry.
Whether used for short-term timing or long-term structural projections, Gann Dynamic Levels provides an adaptive, geometry-based framework for interpreting market behavior.
---
## 📘 How to Use
When first applied, the indicator prompts you to place two points on the chart — for example, at the start and end of a significant price range.
The indicator calculates the number of bars between these two points, known as Delta .
Delta serves as the base unit for all calculations in Methods #1–#5 .
The computed results are displayed in Table 1 , which can be toggled using the parameter “📱 Show Gann Levels Table”.
You can reset or reposition the initial points in two ways:
Drag the existing points to new positions on the chart.
Hover over the indicator name, click ⦁⦁⦁ (More) → select “ Reset Points ”, then set new reference points.
---
## ⚙️ Method Logic
Classic – Evenly spaced levels based on the base Delta value. Ideal for identifying key support and resistance zones.
Coefficient (Coeff) – Scales Delta by fractional or whole-number coefficients for proportional level spacing.
Rounded – Rounds each calculated level to the nearest significant price value to align with major zones.
Subtractive – Generates levels by subtracting multiples of Delta from a reference point, emphasizing retracement-type structures.
Exponential – Applies an exponential growth model (10a = 4 + 3×2ⁿ) to project dynamic, non-linear level expansion.
Planetary – Uses the average distances of planets from the Sun (in Astronomical Units, AU ) as ratio multipliers to create harmonic projections.
Planetary distances can be customized in the user settings.
Data for Method #6 (Planetary) is displayed in Table 2 , toggled via “ 🪐 Show Planetary Table. ”
---
## ➡️ Additional Feature
Offset – Shifts all Gann levels horizontally (left or right) without changing their spacing.
Useful for visually aligning levels with key market structures.
---
### 🧭 Summary
A multi-method Gann framework combining geometric, harmonic, and planetary ratios for dynamic level projection and cycle analysis.
Planetarycycle

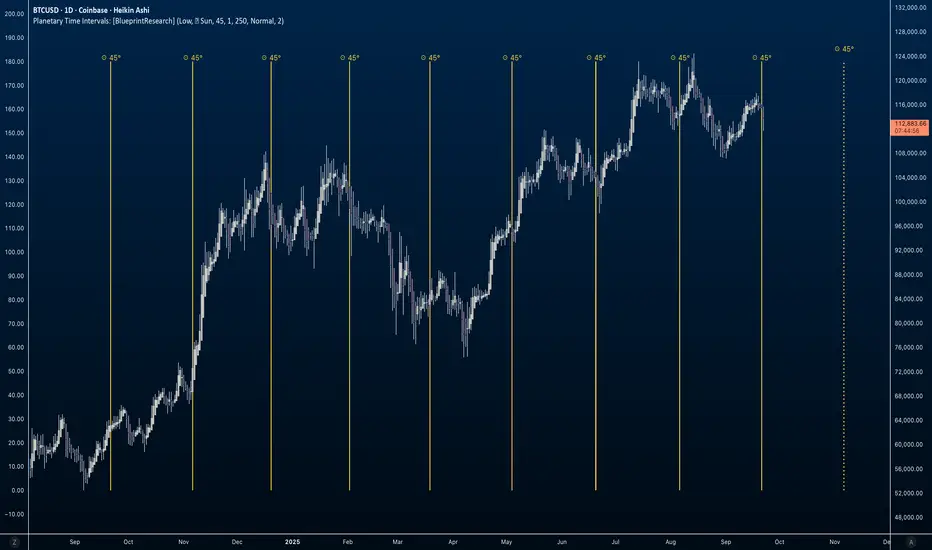
Planetary Time Intervals [Javonnii]🪐 Planetary Time Intervals Indicator 🪐
This innovative planetary time-based market timing indicator enables traders to analyze and project planetary degree intervals directly onto any chart with exceptional accuracy. Built on a custom planetary framework, it calculates planetary positions down to the arc-second across all timeframes, accommodating up to 500 future bars. This capability allows for both clean intraday analysis and long-term market timing.
The framework operates autonomously and requires no external data or updates. It reliably computes planetary positions across centuries and supports seamless analysis across all markets—whether 24/7 assets like crypto or session-based instruments like stocks—with smooth, gap-free planetary data on any ticker or timeframe. Perfect for time-based market studies on deep historical datasets such as the Dow Jones.
🔶 FEATURES
Key planetary timing tools include:
- Standard Degree Interval Plotting (Fixed Increments)
- Price-to-Planetary Degree Conversions (360 Units Reduction & 1/10 Price Method) for Direct Price-to-Time Harmonics
- Geocentric & Heliocentric Models (Including Moon for Lunar Cycles)
- Absolute Degree Handling for Retrogrades
- Visual Projections: Background Highlights, Vertical Lines, and Degree Labels
- Math Display for Calculation Transparency
- Scaling Adjustments for Volatile Assets (e.g., Crypto, Indices)
- Multi-Timeframe Support Up to 500 Bars
- Alert Conditions for Interval Projections
- Customizable Interval Logic and Styling
- + More (Check changelog for updates)
🔶 BASIC DEMONSTRATION
On a daily stock chart, select a key low as your reference point (datetime and price). Choose a 30° interval for Mercury, and the indicator projects vertical lines forward at each degree milestone, with shaded backgrounds indicating potential cycle zones. Labels display traversed degrees, highlighting alignments in real-time.
For the 360 Conversion, input a price like $5,000—it reduces to 320° via modular arithmetic (5000 mod 360 = 320°), converting the price directly into a planetary time interval that may sync with numerological patterns or past turns.
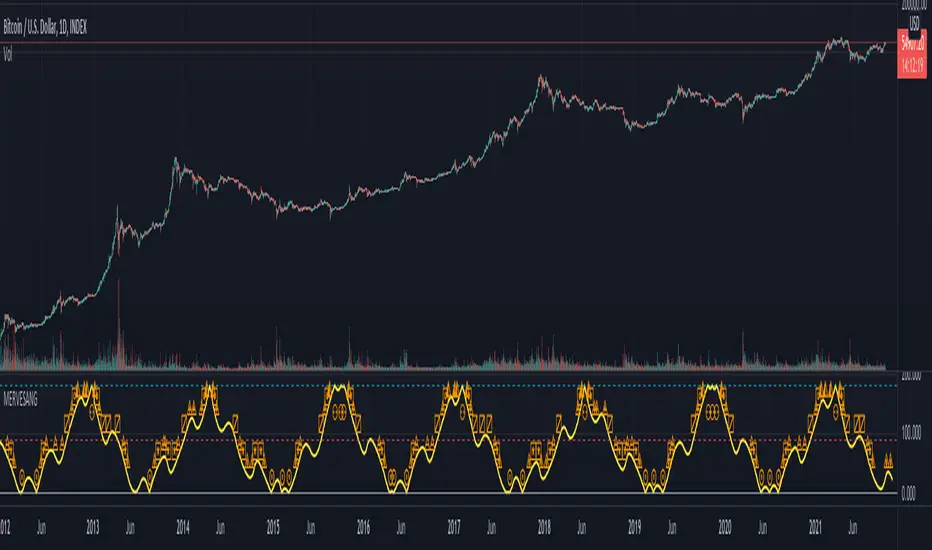
🔶 USAGE & EXAMPLES
In the image below, the indicator is applied to a long-term weekly BTCUSD chart from 2015 to 2026. Selecting a historical low point (price = 198.02) as the reference, the 360 Conversion method derives the interval directly from the price. Since 198.02 is already under 360, the interval is simply 198.02° (no further reduction needed). Vertical yellow lines project these Sun-based intervals forward, aligning with a few key market turns, bull runs, and corrections. The math is displayed in the label "198.02° Low = 198.02° 360 Conversion 198.02°", illustrating the price-to-planetary time conversion process. Numerology enthusiasts might reduce 198.02° further (1+9+8+0+2=20, then 2+0=2) for symbolic insights into market balance or duality.
Supported planets: Sun, Moon, Mercury, Venus, Mars, Jupiter, Saturn, Uranus, Neptune, Pluto.
🔶 SETTINGS
- Timing Method: Select Standard Interval, 360 Conversion, or 1/10 Price.
- Planetary View: Geocentric/Heliocentric; Toggle Moon Inclusion.
- Interval Setup: Enter degrees (e.g., 45°); Enable Absolute for Retrogrades.
- Base Reference: Input datetime and price from high/low.
- Visuals: Toggle highlights, lines, math labels; Set colors/styles.
- Scaling: Adjust for asset ranges (e.g., multipliers for high or low prices).
- Limits: Bar count (up to 500)
- Styling: Label formats, projection options.
🔶 CONCLUSION
Planetary and numerological timing offers a unique lens on market rhythms, blending celestial mechanics with number-based insights for deeper analysis. This indicator is an original creation providing precise, flexible tools to explore these concepts, with a strong focus on converting price data into actionable planetary time intervals. As with all trading, past patterns aren't guarantees—pair with sound risk management and your overall approach.
🔶 HOW TO GET ACCESS
This public invite-only script is for planetary traders, market analysts, numerology enthusiasts, and anyone interested in harmonic degree-based timing. Reach out to the author for access details to this indicator and related resources.
ORB Inner Planet Ingress/Retrograde 2020-22(G-Tropical)In astrology, "planetary ingress" refers to the moment a planet enters a new astrological sign or house.
These planetary ingress brings in directional change in scripts.
This scripts also plots Retrograde Planets which also changes trends of stocks on most occasions.
This scripts will work for the period 2020 to 2022.

ORB Aspect-Nodes 2020-22(G-T)In astrology, the Moon's Node refers to the two points where the Moon's orbit intersects the ecliptic (the plane of the Earth's orbit around the Sun). The North Node, or Rahu, is the ascending point of the Moon's orbit whle the South Node, or Ketu, is the descending point of the Moon's orbit.
Whenever a planet hits these Nodes, extreme volatility is seen in stocks and temporary tops and bottoms are observed.
This indicator plots these periods and also shows upcoming dates if it falls in the next 7 days.
This indicator is for the period 2020-22.

ORB Aspect-Nodes 2023-25(G-T)In astrology, the Moon's Node refers to the two points where the Moon's orbit intersects the ecliptic (the plane of the Earth's orbit around the Sun). The North Node, or Rahu, is the ascending point of the Moon's orbit whle the South Node, or Ketu, is the descending point of the Moon's orbit.
Whenever a planet hits these Nodes, extreme volatility is seen in stocks and temporary tops and bottoms are observed.
This indicator plots these periods and also shows upcoming dates if it falls in the next 7 days.
This indicator is for the period 2023-25.

Financial Astrology Pluto HarmonicsPluto Harmonics indicator represent the tropical zodiac energy forces that develop through the course of Pluto in the tropical zodiac wheel. The waves indicates the strength of cardinal energy (initiator) and this forces seems to correlate well with the most relevant pivot points. In Financial Astrology, Pluto rules the transformations, intense actions (no limits), issues with control and power, excess, destruction.
Note: The Pluto Harmonics indicator is based on an ephemeris array that covers years 2010 to 2030, prior or after this years the data is not available, this daily ephemeris are based on UTC time so in order to align properly with the price bars times you should set UTC as your chart timezone.

Financial Astrology Neptune HarmonicsNeptune Harmonics indicator represent the tropical zodiac energy forces that develop through the course of Neptune in the tropical zodiac wheel. The waves indicates the strength of cardinal energy (initiator) and this forces seems to correlate well with the most relevant pivot points. In Financial Astrology, Neptune rules charity, confusion, imagination, waste, crime, intuition, occult, scandal, illusion, financial bubbles, scams, and dreams.
Note: The Neptune Harmonics indicator is based on an ephemeris array that covers years 2010 to 2030, prior or after this years the data is not available, this daily ephemeris are based on UTC time so in order to align properly with the price bars times you should set UTC as your chart timezone.

Financial Astrology Vesta HarmonicsVesta (asteroid) Harmonics indicator represent the tropical zodiac energy forces that develop through the course of Vesta in the tropical zodiac wheel. The waves indicates the strength of cardinal energy (initiator) and this forces seems to correlate well with the most relevant pivot points. In Financial Astrology, Vesta rules the creative energy, aspirations, goals and security business
Note: The Vesta Harmonics indicator is based on an ephemeris array that covers years 2010 to 2030, prior or after this years the data is not available, this daily ephemeris are based on UTC time so in order to align properly with the price bars times you should set UTC as your chart timezone.

Financial Astrology Uranus HarmonicsUranus Harmonics indicator represent the tropical zodiac energy forces that develop through the course of Uranus in the tropical zodiac wheel. The waves indicates the strength of cardinal energy (initiator) and this forces seems to correlate well with the most relevant pivot points. In Financial Astrology, Uranus rules change, innovation, disruption, inventions, revolutions and technology.
Note: The Uranus Harmonics indicator is based on an ephemeris array that covers years 2010 to 2030, prior or after this years the data is not available, this daily ephemeris are based on UTC time so in order to align properly with the price bars times you should set UTC as your chart timezone.

Financial Astrology Saturn HarmonicsSaturn Harmonics indicator represent the tropical zodiac energy forces that develop through the course of Saturn in the tropical zodiac wheel. The waves indicates the strength of cardinal energy (initiator) and this forces seems to correlate well with the most relevant pivot points. In Financial Astrology, Saturn rules temperance, rectitude, constancy, greed, fear and pessimism.
Note: The Saturn Harmonics indicator is based on an ephemeris array that covers years 2010 to 2030, prior or after this years the data is not available, this daily ephemeris are based on UTC time so in order to align properly with the price bars times you should set UTC as your chart timezone.

Financial Astrology Jupiter HarmonicsJupiter Harmonics indicator represent the tropical zodiac energy forces that develop through the course of Jupiter in the tropical zodiac wheel. The waves indicates the strength of cardinal energy (initiator) and this forces seems to correlate well with the most relevant pivot points . In Financial Astrology, Jupiter rules expansion, optimism, enthusiasm, joviality and devotion.
Note: The Jupiter Harmonics indicator is based on an ephemeris array that covers years 2010 to 2030, prior or after this years the data is not available, this daily ephemeris are based on UTC time so in order to align properly with the price bars times you should set UTC as your chart timezone.

Financial Astrology Mars HarmonicsMars Harmonics indicator represent the tropical zodiac energy forces that develop through the course of Mars in the tropical zodiac wheel. The waves indicates the strength of cardinal energy (initiator) and this forces seems to correlate well with the most relevant pivot points. In Financial Astrology, Mars rules impulsive/risky action, entrepreneurship, aggression, explosion and passion. Observe carefully the waves cycles in your favourite instruments.
Note: The Mars Harmonics indicator is based on an ephemeris array that covers years 2010 to 2030, prior or after this years the data is not available, this daily ephemeris are based on UTC time so in order to align properly with the price bars times you should set UTC as your chart timezone.
Financial Astrology Moon HarmonicsMoon Harmonics indicator represent the tropical zodiac energy forces that develop through the course of Moon in the tropical zodiac wheel. The waves indicates the strength of cardinal energy (initiator) and this forces seems to correlate well with the most relevant pivot points. Consider that Moon rules the emotions, instinctive reactions, the flow of the energy from our inner to the outer world.
Note: The Moon Harmonics indicator is based on an ephemeris array that covers years 2010 to 2030, prior or after this years the data is not available, this daily ephemeris are based on UTC time so in order to align properly with the price bars times you should set UTC as your chart timezone.

Financial Astrology Mercury-Pluto Longitude AngleMercury-Pluto angle indicator represent the geocentric longitude angular distance between Mercury and Pluto with labels on the angles that indicate the astrological aspects used by financial astrologers to determine the energy trigger points. In financial astrology, Mercury rules trading, market transactions, commerce and negotiation. Pluto rules the transformations, intense actions (no limits), issues with control and power, excess, destruction.
For any Mercury aspects indicator we recommend to use 4H resolution to locate the exact aspect culmination, this is because Mercury moves at an average geocentric speed of 1.6 degrees per day.
Due to the limited UTF (Unicode Transformation Format) support of classical astrology aspects symbols, we needed to use a custom subset to represent the aspects:
⊚ = 0 degrees angle (conjuction)
⧌ = 30 degrees angle (semi-sextile)
⧆ = 45 degrees angle (semi-square)
⨺ = 60 degrees angle (sextile)
⧄ = 90 degrees angle (square)
⨹ = 120 degrees angle (trine)
⧇ = 135 degrees angle (sesqui-square)
◭ = 150 degrees angle (quincunx or inconjunct)
⚇ = 180 degrees angle (opposition)
Note: The Mercury-Pluto longitude angle indicator is based on an ephemeris array that covers years 2010 to 2030, prior or after this years the data is not available, this daily ephemeris are based on UTC time so in order to align properly with the price bars times you should set UTC as your chart timezone.

Financial Astrology Mercury-Uranus Longitude AngleMercury-Uranus angle indicator represent the geocentric longitude angular distance between Mercury and Uranus with labels on the angles that indicate the astrological aspects used by financial astrologers to determine the energy trigger points. In financial astrology, Mercury rules trading, market transactions, commerce and negotiation. Uranus rules change, innovation, disruption, inventions, revolutions and technology.
For any Mercury aspects indicator we recommend to use 4H resolution to locate the exact aspect culmination, this is because Mercury moves at an average geocentric speed of 1.6 degrees per day.
Due to the limited UTF (Unicode Transformation Format) support of classical astrology aspects symbols, we needed to use a custom subset to represent the aspects:
⊚ = 0 degrees angle (conjuction)
⧌ = 30 degrees angle (semi-sextile)
⧆ = 45 degrees angle (semi-square)
⨺ = 60 degrees angle (sextile)
⧄ = 90 degrees angle (square)
⨹ = 120 degrees angle (trine)
⧇ = 135 degrees angle (sesqui-square)
◭ = 150 degrees angle (quincunx or inconjunct)
⚇ = 180 degrees angle (opposition)
Note: The Mercury-Uranus longitude angle indicator is based on an ephemeris array that covers years 2010 to 2030, prior or after this years the data is not available, this daily ephemeris are based on UTC time so in order to align properly with the price bars times you should set UTC as your chart timezone.

Financial Astrology Mercury-Saturn Longitude AngleMercury-Saturn angle indicator represent the geocentric longitude angular distance between Mercury and Saturn with labels on the angles that indicate the astrological aspects used by financial astrologers to determine the energy trigger points. In financial astrology, Mercury rules trading, market transactions, commerce and negotiation. Saturn rules temperance, rectitude, constancy, greed, fear and pessimism.
For any Mercury aspects indicator we recommend to use 4H resolution to locate the exact aspect culmination, this is because Mercury moves at an average geocentric speed of 1.6 degrees per day.
Due to the limited UTF (Unicode Transformation Format) support of classical astrology aspects symbols, we needed to use a custom subset to represent the aspects:
⊚ = 0 degrees angle (conjuction)
⧌ = 30 degrees angle (semi-sextile)
⧆ = 45 degrees angle (semi-square)
⨺ = 60 degrees angle (sextile)
⧄ = 90 degrees angle (square)
⨹ = 120 degrees angle (trine)
⧇ = 135 degrees angle (sesqui-square)
◭ = 150 degrees angle (quincunx or inconjunct)
⚇ = 180 degrees angle (opposition)
Note: The Mercury-Saturn longitude angle indicator is based on an ephemeris array that covers years 2010 to 2030, prior or after this years the data is not available, this daily ephemeris are based on UTC time so in order to align properly with the price bars times you should set UTC as your chart timezone.

Financial Astrology Mercury-Jupiter Longitude AngleMercury-Jupiter angle indicator represent the geocentric longitude angular distance between Mercury and Jupiter with labels on the angles that indicate the astrological aspects used by financial astrologers to determine the energy trigger points. In financial astrology, Mercury rules trading, market transactions, commerce and negotiation. Jupiter rules expansion, optimism, enthusiasm, joviality and devotion.
For any Mercury aspects indicator we recommend to use 4H resolution to locate the exact aspect culmination, this is because Mercury moves at an average geocentric speed of 1.6 degrees per day.
Due to the limited UTF (Unicode Transformation Format) support of classical astrology aspects symbols, we needed to use a custom subset to represent the aspects:
⊚ = 0 degrees angle (conjuction)
⧌ = 30 degrees angle (semi-sextile)
⧆ = 45 degrees angle (semi-square)
⨺ = 60 degrees angle (sextile)
⧄ = 90 degrees angle (square)
⨹ = 120 degrees angle (trine)
⧇ = 135 degrees angle (sesqui-square)
◭ = 150 degrees angle (quincunx or inconjunct)
⚇ = 180 degrees angle (opposition)
Note: The Mercury-Jupiter longitude angle indicator is based on an ephemeris array that covers years 2010 to 2030, prior or after this years the data is not available, this daily ephemeris are based on UTC time so in order to align properly with the price bars times you should set UTC as your chart timezone.

Financial Astrology Mercury-Vesta Longitude AngleMercury-Vesta angle indicator represent the geocentric longitude angular distance between Mercury and Vesta with labels on the angles that indicate the astrological aspects used by financial astrologers to determine the energy trigger points. In financial astrology, Mercury rules trading, market transactions, commerce and negotiation. Vesta rules the creative energy, aspirations, goals and security business.
For any Mercury aspects indicator we recommend to use 4H resolution to locate the exact aspect culmination, this is because Mercury moves at an average geocentric speed of 1.6 degrees per day.
Due to the limited UTF (Unicode Transformation Format) support of classical astrology aspects symbols, we needed to use a custom subset to represent the aspects:
⊚ = 0 degrees angle (conjuction)
⧌ = 30 degrees angle (semi-sextile)
⧆ = 45 degrees angle (semi-square)
⨺ = 60 degrees angle (sextile)
⧄ = 90 degrees angle (square)
⨹ = 120 degrees angle (trine)
⧇ = 135 degrees angle (sesqui-square)
◭ = 150 degrees angle (quincunx or inconjunct)
⚇ = 180 degrees angle (opposition)
Note: The Mercury-Vesta longitude angle indicator is based on an ephemeris array that covers years 2010 to 2030, prior or after this years the data is not available, this daily ephemeris are based on UTC time so in order to align properly with the price bars times you should set UTC as your chart timezone.
Financial Astrology Mercury-Ceres Longitude AngleMercury-Ceres angle indicator represent the geocentric longitude angular distance between Mercury and Ceres with labels on the angles that indicate the astrological aspects used by financial astrologers to determine the energy trigger points. In financial astrology, Mercury rules trading, market transactions, commerce and negotiation. Ceres rules growing, nutrition, food, farming and prosperity.
For any Mercury aspects indicator we recommend to use 4H resolution to locate the exact aspect culmination, this is because Mercury moves at an average geocentric speed of 1.6 degrees per day.
Due to the limited UTF (Unicode Transformation Format) support of classical astrology aspects symbols, we needed to use a custom subset to represent the aspects:
⊚ = 0 degrees angle (conjuction)
⧌ = 30 degrees angle (semi-sextile)
⧆ = 45 degrees angle (semi-square)
⨺ = 60 degrees angle (sextile)
⧄ = 90 degrees angle (square)
⨹ = 120 degrees angle (trine)
⧇ = 135 degrees angle (sesqui-square)
◭ = 150 degrees angle (quincunx or inconjunct)
⚇ = 180 degrees angle (opposition)
Note: The Mercury-Ceres longitude angle indicator is based on an ephemeris array that covers years 2010 to 2030, prior or after this years the data is not available, this daily ephemeris are based on UTC time so in order to align properly with the price bars times you should set UTC as your chart timezone.

Financial Astrology Mercury-Mars Longitude AngleMercury-Mars angle indicator represent the geocentric longitude angular distance between Mercury and Mars with labels on the angles that indicate the astrological aspects used by financial astrologers to determine the energy trigger points. In financial astrology, Mercury rules trading, market transactions, commerce and negotiation. Mars rules impulsive/risky action, entrepreneurship, aggression, explosion and passion.
For any Mercury aspects indicator we recommend to use 4H resolution to locate the exact aspect culmination, this is because Mercury moves at an average geocentric speed of 1.6 degrees per day.
Due to the limited UTF (Unicode Transformation Format) support of classical astrology aspects symbols, we needed to use a custom subset to represent the aspects:
⊚ = 0 degrees angle (conjuction)
⧌ = 30 degrees angle (semi-sextile)
⧆ = 45 degrees angle (semi-square)
⨺ = 60 degrees angle (sextile)
⧄ = 90 degrees angle (square)
⨹ = 120 degrees angle (trine)
⧇ = 135 degrees angle (sesqui-square)
◭ = 150 degrees angle (quincunx or inconjunct)
⚇ = 180 degrees angle (opposition)
Note: The Mercury-Mars longitude angle indicator is based on an ephemeris array that covers years 2010 to 2030, prior or after this years the data is not available, this daily ephemeris are based on UTC time so in order to align properly with the price bars times you should set UTC as your chart timezone.

Financial Astrology Mercury-Sun Longitude AngleMercury-Sun angle indicator represent the geocentric longitude angular distance between Mercury and Sun with labels on the angles that indicate the astrological aspects used by financial astrologers to determine the energy trigger points. In financial astrology, Mercury rules trading, market transactions, commerce and negotiation. The Sun rules life, conscious mind, will, creative force, ego and purpose.
The greater geocentric longitude distance experienced by this planets is 28 degrees, therefore, not all the astrological aspects can be formed, the aspects that can occur are: conjuction and semi-sextile. However, the semi-sextile will never reach the exact 30 degree angle but quite close at 28 degrees, 2 degrees of orb from exact.
For any Mercury aspects indicator we recommend to use 4H resolution to locate the exact aspect culmination, this is because Mercury moves at an average geocentric speed of 1.6 degrees per day.
Due to the limited UTF (Unicode Transformation Format) support of classical astrology aspects symbols, we needed to use a custom subset to represent the aspects:
⊚ = 0 degrees angle (conjuction)
⧌ = 30 degrees angle (semi-sextile) - Note that this is never labeled due the fact that is never formed exact
Note: The Mercury-Sun longitude angle indicator is based on an ephemeris array that covers years 2010 to 2030, prior or after this years the data is not available, this daily ephemeris are based on UTC time so in order to align properly with the price bars times you should set UTC as your chart timezone.

Financial Astrology Mercury-Venus Longitude AngleMercury-Venus angle indicator represent the longitude angular distance between Mercury and Venus with labels on the angles that indicate the astrological aspects used by financial astrologers to determine the energy trigger points. In financial astrology, Mercury rules trading, market transactions, commerce and negotiation. Venus rules speculation, bets, entertainment (gamblers traders) and fashion. The aspects of this planets will mark the periods of intense speculation driven by gambler traders. Watch closely when semi-sextiles and sextiles are activated because those aspects produce strong and more predictable price action.
The greater geocentric longitude distance experienced by this planets is 74 degrees, therefore, not all the astrological aspects can be formed.
For any Mercury aspects indicator we recommend to use 4H resolution to locate the exact aspect culmination, this is because Mercury moves at an average geocentric speed of 1.6 degrees per day.
Due to the limited UTF (Unicode Transformation Format) support of classical astrology aspects symbols, we needed to use a custom subset to represent the aspects:
⊚ = 0 degrees angle (conjuction)
⧌ = 30 degrees angle (semi-sextile)
⧆ = 45 degrees angle (semi-square)
⨺ = 60 degrees angle (sextile)
Note: The Mercury-Venus longitude angle indicator is based on an ephemeris array that covers years 2010 to 2030, prior or after this years the data is not available, this daily ephemeris are based on UTC time so in order to align properly with the price bars times you should set UTC as your chart timezone.

Financial Astrology Moon-Ceres Longitude AngleMoon-Ceres indicator show the angular distance in longitude between Moon and Ceres (dwarf planet) and labels the angles that represent the astrological aspects used by financial astrologers to determine the energy trigger points. In financial astrology, Ceres rules growing, nutrition, food, farming and prosperity. The Moon is the strengthen/weakening emotion that trigger the desire of prosperity and grow your investment.
For any Moon aspects indicator we recommend to use 1H or 2H resolution to locate the exact aspect angle, this is because Moon moves very fast at average of 13 degrees per day.
Due to the limited UTF (Unicode Transformation Format) support of classical astrology aspects symbols, we needed to use a custom subset to represent the aspects:
⊚ = 0 degrees angle (conjuction)
⧌ = 30 degrees angle (semi-sextile)
⧆ = 45 degrees angle (semi-square)
⨺ = 60 degrees angle (sextile)
⧄ = 90 degrees angle (square)
⨹ = 120 degrees angle (trine)
⧇ = 135 degrees angle (sesqui-square)
◭ = 150 degrees angle (quincunx or inconjunct)
⚇ = 180 degrees angle (opposition)
Note: The Moon-Ceres longitude angle indicator is based on an ephemeris array that covers years 2010 to 2030, prior or after this years the data is not available, this daily ephemeris are based on UTC time so in order to align properly with the price bars times you should set UTC as your chart timezone.
