🧪 Yuri Garcia Smart Money Strategy FULL (Slope Divergence))📣 Yuri Garcia – Smart Money Strategy FULL
This is my private Smart Money Concept strategy, designed for my family and community to learn, trade, and grow sustainably.
🔑 How it works:
✅ Volume Cluster Zones: Automatically detects areas where strong buyers or sellers concentrate, acting as dynamic S/R levels.
✅ HTF Institutional Zones (4H): Higher timeframe trend filter ensures you’re always trading in the direction of major flows.
✅ Wick Pullback Filter: Confirms price rejects the zone, catching smart money traps and reversals.
✅ Cumulative Delta (CVD): Confirms whether buyers or sellers are truly in control.
✅ Slope-Based Divergence: Optional hidden divergence between price & CVD to spot reversals others miss.
✅ ATR Dynamic SL/TP: Adapts stop loss and take profit to live volatility with adjustable risk/reward.
🧩 Visual Markers Explained:
🟦 Blue X: Price inside HTF zone
🟨 Yellow X: Price inside Volume Cluster zone
🟧 Orange Circle: Wick pullback detected
🟥 Red Square: CVD confirms order flow strength
🔼 Aqua Triangle Up: Bullish slope divergence
🔽 Purple Triangle Down: Bearish slope divergence
🟢 Green Triangle Up: Final Long Entry confirmed
🔴 Red Triangle Down: Final Short Entry confirmed
⚡ Who is this for?
This strategy is best suited for traders who understand smart money concepts, order flow, and want an adaptive framework to trade major assets like BTC, Gold, SP500, NASDAQ, or FX pairs.
🔒 Important
Use responsibly, backtest extensively, and combine with solid risk management. This is for educational purposes only.
✨ Credits
Built with ❤️ by Yuri Garcia – dedicated to my family & community.
✅ How to use it
1️⃣ Add to chart
2️⃣ Adjust inputs for your asset & timeframe
3️⃣ Enable/disable slope divergence filter to match your style
4️⃣ Set your alerts with built-in conditions
Portfolio

Portfolio Performance - Effects of RebalancingFunction:
- Can be used to evaluate the performance of a portfolio containing 2 assets over a set time interval
- Shows the % return of the portfolio over the time interval defined by the user
- Includes a threshold rebalancing algorithm to show the effects that rebalancing has on the portfolio over the long term
- Created to evaluate of the performance of portfolios containing different weightings of stocks and bonds over time assuming that the user would rebalance the portfolio when asset weights crossed a threshold
Instructions:
- To be used with dividends adjustments turned on
- Add this script to a symbol. e.g. AMEX:SPY
- Click the chart to define the entry time and the exit time. i.e. the time interval
- Define the initial investment of the portfolio. Default setting is $100,000
- Define the second asset to be included in the portfolio. e.g. BATS:AGG
- The strategy comes pre-populated with a portfolio that has a weight of 80% asset 1 and 20% asset 2. i.e. 80% AMEX:SPY and 20% BATS:AGG if the symbols mentioned above were chosen
- The 7 lines show the weighted % return of each portfolio over the time period defined by the user
- Each line (except the blue) is the return based on a different rebalancing threshold. The default settings are 1%, 2.5%, 5%, 10%, 15%, 20%, 30%
- The blue line is the % return of a portfolio that was made up of 100% asset 1 over the time interval. i.e. 100% AMEX:SPY
- Asset weights and rebalancing thresholds are adjustable via the settings
- Each plot can be turned on and turned off via a tick box in the settings

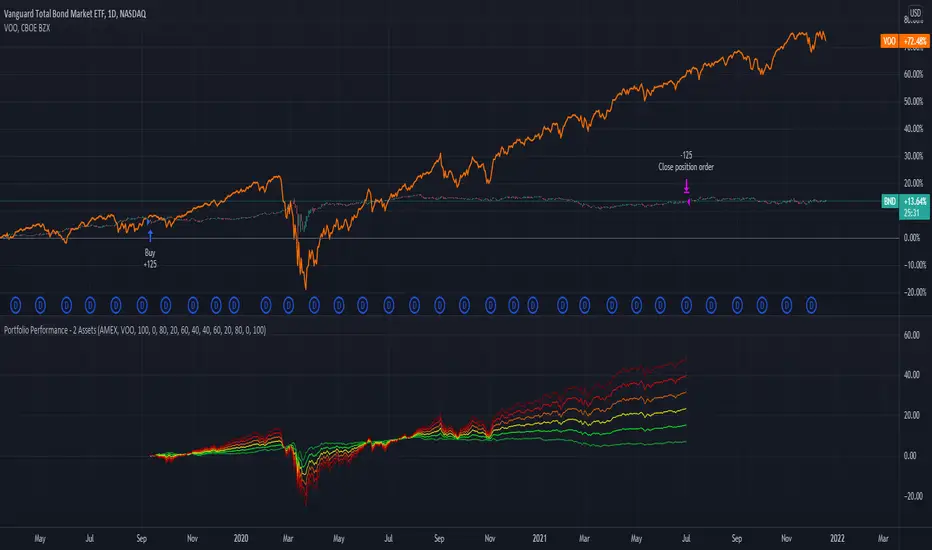
Portfolio Performance - 2 AssetsFunction:
- Can be used to evaluate the performance of portfolios containing 2 assets over a set time interval
- Created to evaluate of the performance of portfolios containing different weightings of stocks and bonds over time
- Shows the % return of each portfolio over the time interval defined by the user
- Capable of showing the risk adjusted % return of each portfolio over the time interval defined by the user (setting turned off by default)
Instructions:
- To be used with dividends adjustments turned on
- Add this script to a symbol. e.g. NASDAQ:BND
- Click the chart to define the entry time and the exit time. i.e. the time interval
- Define the second asset to be included in the portfolio. e.g. AMEX:VOO
- The strategy comes pre-populated with 6 portfolios with the most common stock/bond weightings (100% stocks/0% bonds, 80% stocks/20% bonds, 60% stocks/40% bonds, et cetera)
- The 6 lines show the weighted % return of each portfolio over the time period defined by the user
- All asset weights are adjustable via the settings
- Each plot can be turned on and turned off via a tick box in the settings
- There are 6 plots that show the risk adjusted returns of each portfolio (setting turned off by default)
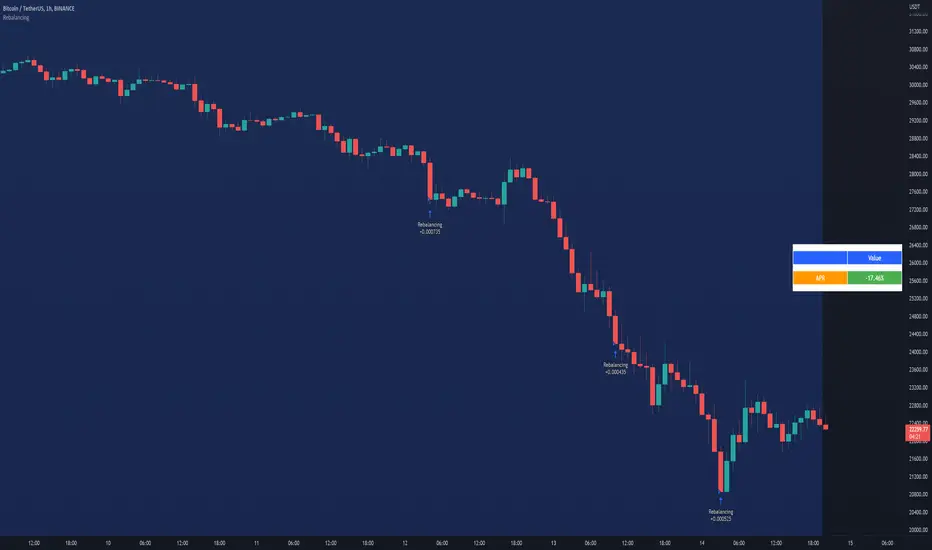
RebalancingThis script gives you an approximation of the APR you can get when using the technique of Rebalancing.
Further discription are embeded in the script.
HOW TO USE:
- Start date: Choose start date
- Settings: Change settings to your own needs
- Base currency: Select Base currency
- Portfolio: Select the coins (MAX 9 pcs.) you want to use in your portfolio for the rebalancing algoritm
- Click "Data Window" to see the APR (appr.)
Markets:
It can be used to all markets.
NOTE:
Some Exchanges don't go very far back in the past and for this reason this may have impact on this Indicator.
Make sure the coins you selected are available at the Exchange you select in the settings section. If you dont do this, the script generates an error.
Investing - Weekly EMA's mapped to Daily ChartWhen there isn't enough time in your day to day-trade, yet you want to utilise all the technical analysis skills you have... why not make a long term investing or swing trading indicator set to help you along the way!
So I did....
When it comes to long term investing and swing trading, I often find the weekly 12/26/52 EMA's do a great job in capturing the main market swings from bull to bear.
However, I like to use the Daily chart to see the candle patterns and shapes with more detail and divergences often show up better on the daily chart.
So I have decided to combine the two!
I have basically taken the EMA 12/26/52 from the weekly and transferred them over to the daily (mathematically they are not exact, but for me they are close enough).
I have also developed a simple scale in / scale out strategy for using these exponential moving averages. It isn't as simple as buying in on each signal, however I use my own special strategy to take advantage of the alerts.
Enjoy!
