Cipher Twister - Long and ShortINTRO / NOTES:
This script is based on Market Cipher B Oscillator by Falcon
The difference in this script is that only the useful points are printed on the indicator, namely Long and Short Trade Execution signals to be used by a bot, namely the PT Bot.
The script also differs from the original that it has been upgraded to Pinescript v4
This oscillator can be used with ALL time frames, but generally works the best on 15 minute and 1 hour charts on ANY market, no matter, stock, forex, crypto, spot, futures, derivatives, Nasdaq etc...
DEFINITIONS:
This oscillator forms the foundation of Buy and Exit of Long and Short Trades.
There are 2 'Red' Lines at the top of the channel and 2 Green Lines at the bottom of the channel.
These two channels are set at default to be +53 / -53 and +60 / -60 respectively. These two lines will serve as the threshold point if one is to make cautious trades only.
There is a center line which divides the Oscillator into two parts. Above the center line, the market is in over bought territory and Below the center line is in over sold territory.
'Red' dots are drawn by the indicator to represent a potential Short (or a signal to exit from a Long position)
'Green' dots are drawn by the indicator to represent a potential Long (or a signal to exit from a Short position)
The 'Red' and 'Green' dots are draw when a Cross between both wt1 & wt2 cross, thus providing a fantastic indication of potential trend reversal and entry/exit of a position.
STRATEGY NOTES:
The strategy to use this indicator with for realistic and proper results would be to use it with an automated Trading Bot such as Profit Trailer (PT-BOT)
You could use this strategy manually, however it would mean you would need to sit in front of the screen all day and night long and activate the trades immediately after the 'red'/'green' dots are drawn. Usually this will result in non-optimal entries and exits as well as loss on various instances when a 'red' and 'green' dot are printed close together (which is usually when the market goes into correction/consolidation) and slow entries/exits will result in a loss rather than a small profit or exit at BE (Break Even)
ACTUAL STRATEGY (For use with automated bot)
To be used in conjunction with Heikin Ashi Candles for added cautionary measures
For LONGs ONLY
--------------------
1/ When 'Green' dot is drawn, ACTIVATE Long Position
(Use 1.5% Risk Management for each trade)
(Use Lot size based on 1.5% risk management and xLeverage (if any))
2/ Make sure bot Opens an SL (Stop Loss) value based on 1.5% Risk Management
3/ When 'Red' dot is drawn, CLOSE Long Position.
*If you want to add extra caution to your trade, only activate the trade if the 'Green' dot is BELOW the 'Green' Markers
*For added caution, use color coded Heikin Ashi candles to 'confirm' Activation and Closing of a trade in the bot configuration
---------------------------------------------------------------------------------------------------
For SHORTs ONLY
--------------------
1/ When 'Red' dot is drawn, ACTIVATE Short Position
(Use 1.5% Risk Management for each trade)
(Use Lot size based on 1.5% risk management and xLeverage (if any))
2/ Make sure bot Opens an SL (Stop Loss) value based on 1.5% Risk Management
3/ When 'Green' dot is drawn, CLOSE Short Position
*If you want to add extra caution to your trade, only activate the trade if the 'Red' dot is Above the Red Markers
*For added caution, use color coded Heikin Ashi candles to 'confirm' Activation and Closing of a trade in the bot configuration
---------------------------------------------------------------------------------------------------
Supplementary Notes:
Make sure that your bot configuration will only activate ONE TRADE when the 'Green'/'Red' dot appears.
Occasionally during high volatility , 'red'/'green' dots will appear intermittently before remaining drawn, thus the oscillator 'redraws' the dots during market movement.
There will be times where occasionally a 'green' dot or a 'red' dot will appear, the trade will be opened, but the trade will fail due to the market manipulation (algorithm/market maker bots/fake volume etc), to wipe out those trading on derivatives and futures markets using leverage. Do not worry about this, no bot can make 100% wins, no strategy will achieve 100% win ratio and one necessarily doesn't need a high win ratio when using strict money management practices with your trading for SL and lot size.
If you use this method, you will see great results, but again I must stress, using this method with a fully automated bot is the only way to achieve proper results.
Position

crypto Position Size CalculatorCrypto Position Size Calculator
this indicator helps you to figure out the position size your trade . and its only used for crypto
the indicator needs to fill the input section in order to give you the information table that includes position size .
The input section consists two section the first section you will give the trade info like entry , stop loss and take profit .
then the next section its about your account balance and risk per trade . then you can get your position size .
you can have also option where you can display your table like bottom right , bottom left or top right its your choice.
special thanks : Ahmed busury
special thanks : Aj group family

"Swap" - Bool/Position/Value : Array / Matrix / Var AutoswapLibrary "swap"
Side / Boundary Based All Types Swapper
- three automagical types for Arrays, Matrixes, and Variables
-- no signal : Long/ Short position autoswap
-- true / false : Boolean based side choice
-- Src / Thresh : if source is above or below the threshold
- two operating modes for variables, Holding mode only for arrays/matrixes
-- with two items, will automatically change between the two caveat is it does not delete table/box/line(fill VAR items automatically)
-- with three items, a neutral is available for NA input or neutral
- one function name for all of them. One import name that's easy to type/remember
-- make life easy for your conditional items.
side(source, thresh, _a, _b, _c)
side Change outputs based on position or a crossing level
Parameters:
source : (float) OPTIONAL value input
thresh : (float) OPTIONAL boundary line to cross
_a : (any) if Long/True/Above
_b : (any) if Short/False/Below
_c : (any) OPTIONAL NOT FOR MTX OR ARR... Neutral Item, if var/varip on a/b it will leave behind, ie, a table or box or line will not erase , if it's a varip you're sending in.
Returns: first, second, or third items based on input conditions
Please notify if bugs found.
Thanks.

[TTI] Position Sizing Calculatorb]HISTORY AND CREDITS –––––––––––––––––––––––––––––––––––––––––––––––––––––––
"Perhaps the greatest secret to top trading and investing success is appropriate money management or what we now call POSITION SIZING" - Dr. Van Tharp, Definite Guide to Position Sizing (Market Wizard Book #1)
For those of you who have studied position sizing you know the power it can have to the bottom line of your portfolio.
WHAT IT DOES ––––––––––––––––––––––––––––––––––––––––––––––––––––––––––––––
The indicator allows you to quickly determine your position size after you decide to open a trading or investing position. Additionally, it gives you targets in terms of R-multiples (R) that tell you at what price level you achieve 2R or 200% return to a given risk.
The indicator also has the option to print these levels on chart for you.
You can use the calculator for the loaded ticker or other ticker that you wish.
1️⃣ Percent Calculator
👉 Choose position size (%) of total trading portfolio. General guideline here is 25% to be maximum (as per Mark Minervini criteria)
👉 Choose stop loss (%) of total position. This means that if you have 100k portfolio and your position size is 25% (25k), how much of that 25k are you willing to lose in order to asses you are wrong.
OR
2️⃣ Dollar Value Calculator
👉 Choose Stop Price ($) - general guidance is to use technical stop price.
👉 Choose Amount to risk ($) - this is the absolute amount of money you are willing to risk on a position
Both 1️⃣ & 2️⃣ calculate the targets and the target prices in order to determine where to take profits
Additionally, you get instant information for:
👉 How many shares you ought to buy
👉 What is the total size of the position to open
👉 What is your stop amount (either in $ terms or in $ of portfolio)
👉 What is the Risk to Total Equity with the current parameters.
HOW TO USE IT –––––––––––––––––––––––––––––––––––––––––––––––––––––––––––––
✅ STEP 1
Choose ticker and input the price at which you open a position
✅ STEP 2
Choose 1️⃣ Percent Calculator OR 2️⃣ Dollar Value Calculator
Depending on the parameters you use to open a position
✅ STEP 3
Review the table and the Additional data section to see how much Shares you ought to buy and what is the Risk To Total Equity
✅ STEP 4
Put Alerts for Stop Loss and Take Profits

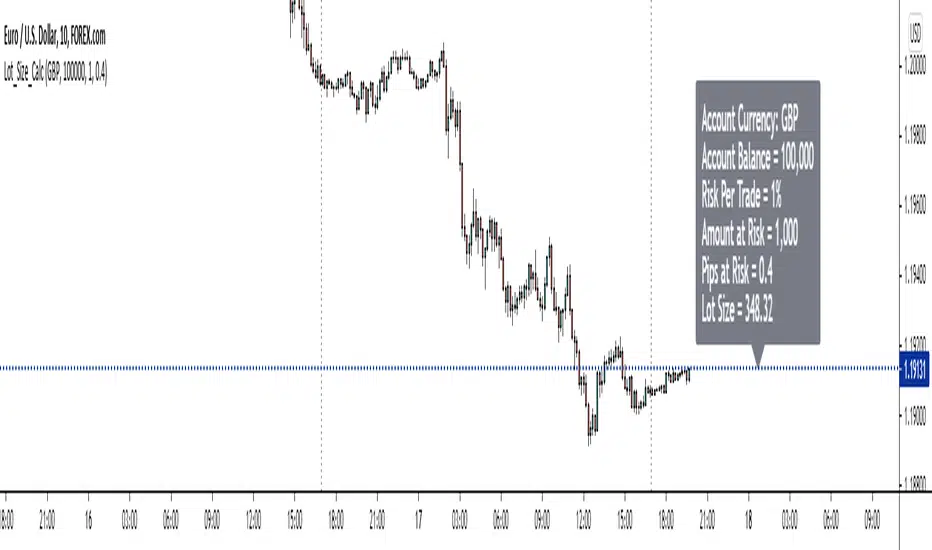
Position Size CalculatorPosition size calculator!
Lotsize is calculated by using properties described below.
Properties:
- Show position size: Will only be visible on 5m - 15m - 60m chart
- Account Currency:
- Account Size: Between 0 and 10 000 000 units of currency
- Risk: Between 0 and 100%
- Stoploss: Between 0 and 200 pips
- Textcolor
- Contract sizes for different assets:
- Indices: SPXUSD, DE30, NAS100, US30
- Bonds: ZB, ZN, ZF
- Gold: XAUUSD
- Oil: XTIUSD
- Currency futures: 6A, 6B, 6C, 6E, 6J, 6N, 6S
Other symbols can be added by request.
Enjoy!

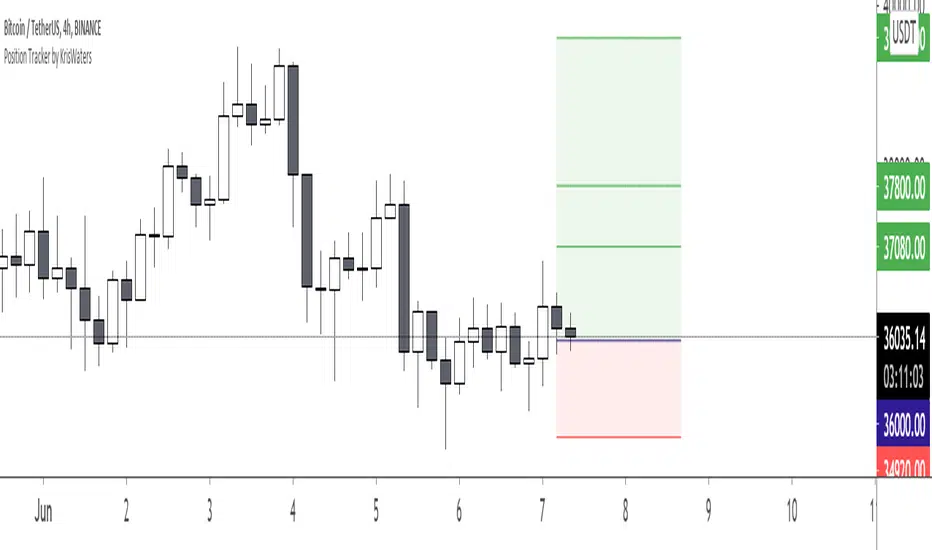
SignalsThis script allows you to calculate position size, and future profit, loses.
- You can add 3 target values and 1 stop loss
- Optionally you can display table, position it as you like, and see risk ratio
Plans:
- add profit loss to the labels

Position size FX and CryptoThis indicator I am using to calculate the position size to order for Forex and Crypto Future

Risk Management Tool [LuxAlgo]Good money management is one of the fundamental pillars of successful trading. With this indicator, we propose a simple way to manage trading positions. This tool shows Profit & Loss (P&L), suggests position size given a certain risk, sets stop losses and take profit levels using fixed price value/percentage/ATR/Range, and can also determine entries from crosses with technical indicators which is particularly handy if you don't want to set an entry manually.
1. Settings
Position Type: Determines if the position should be a "Long" or "Short".
Account Size: Determines the total capital of the trading account.
Risk: The maximum risk amount for a trade. Can be set as a percentage of the account size or as a fixed amount.
Entry Price: Determines the entry price of the position.
Entry From Cross: When enabled, allows to set the entry price where a cross with an external source was produced.
1.1 Stop Loss/Take Profit
Take Profit: Determines the take profit level, which can be determined by a value or percentage.
Stop Loss: Determines the stop loss level, which can be determined by a value or percentage.
2. Usage
One of the main usages of position management tools is to determine the position size to allocate given a specific risk amount and stop-loss. 2% of your capital is often recommended as a risk amount.
Our tool allows setting stop losses and take profits with different methods.
The ATR method sets the stop loss/take profit one ATR away from the entry price, with the ATR period being determined in the drop-down menu next to the selected methods. The range method works similarly but instead of using the ATR, we use a rolling range with a period determined in the drop-down menu next to the selected methods as well.
Unlike the available position management tool on TradingView, the entry can be determined from a cross between the price an an external source. The image above shows entries from the Volatility Stop indicator. This is particularly useful if you set positions based on trailing stops.

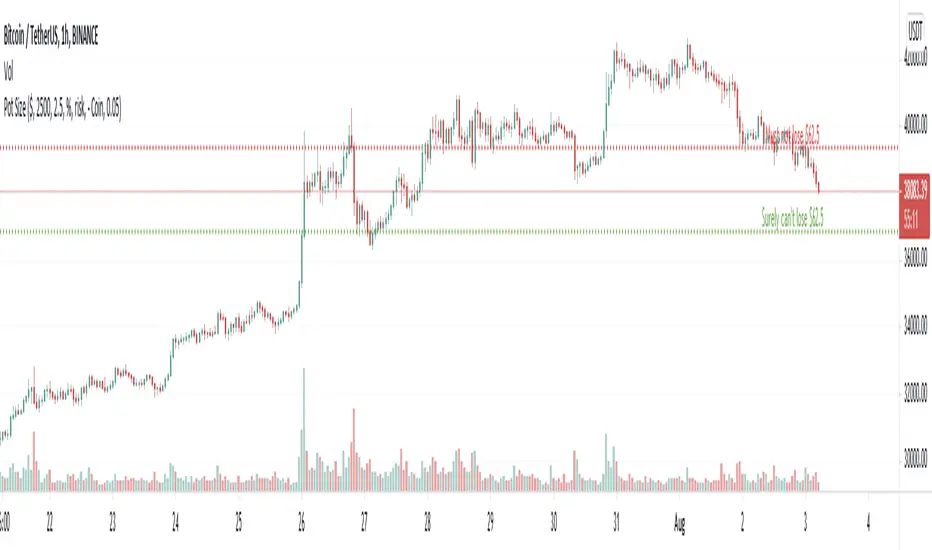
Pot SizeA little FREE script - which may help people set their trade size and stop levels for bitcoin trades.
NOTE :- This script conveys information that requires "indicator arguments" to be turned on.
TO USE :- To adjust to your requirements, click the cog wheel next to the indicator, and adjust "POT SIZE" (how much dollar you have), "RISK %" (the percentage of your dollar portfolio you would like to risk on this trade) and "BITCOIN AMOUNT" - until the short and long 'stop' lines are in the right place in your estimation, for a stop loss that represents the risk you want in relation to the current price for this trade.
The script takes its reference from the closing price; and doesn't include calculations for spread, fees, true range, and volatility etc. That is left open for anyone to add that if they wish. Anyone using this has to make their own adjustments for such considerations not being in this script and therefore make their own compensations.
Anyone wanting to change anything (because values don't go far enough for you) but doesn't know pinescript, can change the numbers next to "defval", "minval", "maxval", and "step" to their suiting in the script itself.
If you use this, you have to work out for yourself if it is useful for you or not. If you depend on it, you must have your own confidence that the calculations in it are acceptable and correct for your use, and you should check yourself and seek advice before trusting it. I convey no confidence in these calculations or this script, and they must be assumed to be acceptable by you if you use it.
Thanks
M
Trade Calculator by RealmixA clean Trade Calculator for any Asset, which calculates everything you need to know.
This script is a modified version of the Position Calculator by Mysteriown. Link:
I try to make it a bit better for Futures Trading.
Position size optimizer RNR_0// 1. When market volatility is severe, the use of equal weight systems is eliminated.
// 2. It is a bad strategy to concentrate bets since they drive the short position, which ultimately influences the whole book of trade.
// 3. Expect your short positions to get squeezed by at least 10% during the next five trading days.
// 4. When there are bear markets, the correlation goes to 1. Allow for the fact that both Longs and Shorts will go against you at the same time.
// 5. Unprofitable trades increase in magnitude rapidly.
// 6. Unlike in an up-trending market, there are no 2-3 wins. Winners shrink and contribute less. So, there is an opposite tendency toward oversized positions.
// 7. In contrast to a bull market, in contrast to the long. The winners shrink in size and contribute less. As a result, there is an inverse trend toward oversized positions.
// 9. The winners shrink in size, while the losers grow exponentially The challenge is to size positions in such a manner that they contribute favorably when successful but do not completely obliterate performance when unsuccessful.
Randomly select enter and exit
```
longCondition = bar_index % 33 == 0
if (longCondition and afterStartDate )
strategy.entry("buy", strategy.long, qty = qty)
shortCondition = bar_index % 44 == 0
if (shortCondition)
strategy.close("buy")
```

Forex Position Size CalculatorThe purpose of this position size calculator is to assist fellow traders in their position size calculations straight from tradingview without having to rely on other apps or websites.
Account balance in the 8 major currency pairs are also available as an input option (i.e. if the account balance is based in pounds, dollars, euros, it can be selected).
Right now this only works on the 28 forex cross currency pairs. At a later date, the indicator will be updated to handle exotic pairs, commodities, and gold.
Position Tracker by KrisWatersPosition tracker helps you to know "Stop" and "Take Profit" prices with provided "Entry Price" data. You can use on Long and Short setups.
Forex Position Size CalculatorPosition size calculator for FOREX only!
Lotsize is calculated by using properties described below.
Properties:
- Show position size: Will only be visible on 5m - 15m - 60m chart
- Account Currency:
- Account Size: Between 0 and 10 000 000 units of currency
- Risk: Between 0 and 100%
- Stoploss: Between 0 and 200 pips
- Textcolor

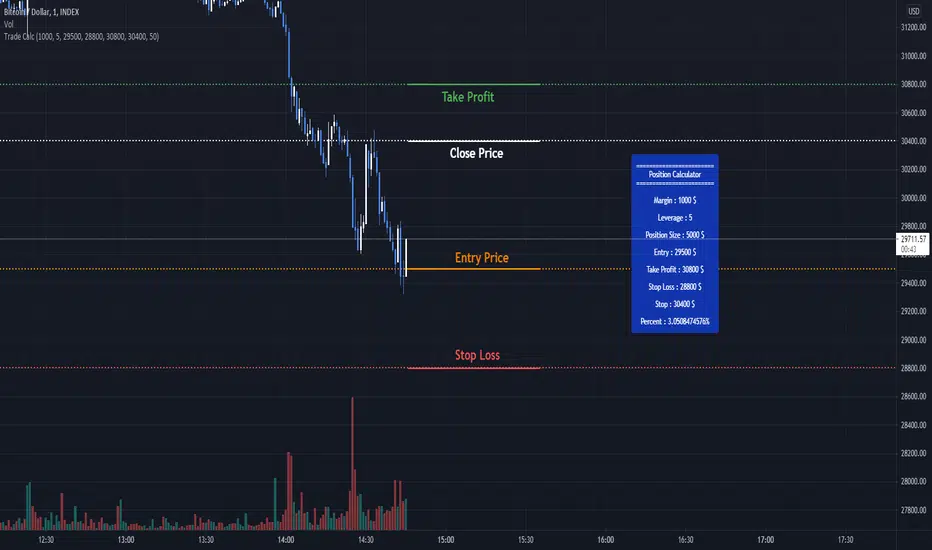
Position calcCurrent script was created to help faster calculate possible gain or loss from a furure trade. Making money management a bit simpler, by changing values you can adjust proper trade leverage and see possible target values

@ Investoz Position CalculatorPosition Calculator
This is how the position calculator works:
To use “Position Calculator” it is required that you know how much capital you want to risk (R). In other words, your R is the total amount you are willing to risk. You also need to know at what price you intend to buy the shares and where you had intended to put your stop loss.
Once you have filled in this information, you will find out how many shares you are allowed to buy and how much you have to invest.
A more detailed explanation can be found below.
Risk Capital (R) = This is the amount you are willing to risk. And by risk, I mean the total amount you are willing to lose completely. If you do not know your (R), you can calculate it in the Risk Calculator here
Buy Level = The price level where you intend to invest.
Stop Loss Level = The price at which you want to put your stop loss level on.
Difference between purchase price and stop loss level = Shows the percentage difference between your buy level and your stop loss level.
Number of shares to buy = Shows how many shares you should buy, considering the risk you have chosen.
Invested Capital = Shows how much you are allowed to invest.


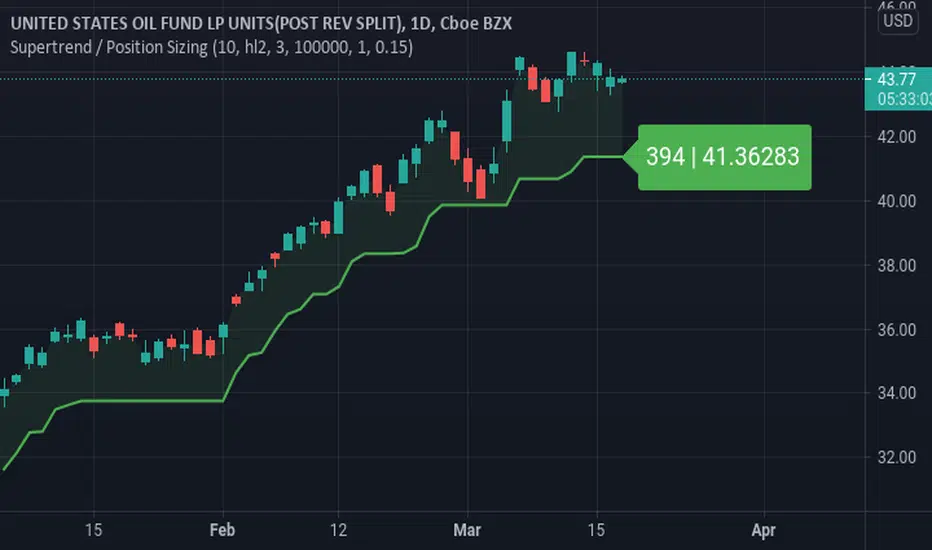
Supertrend / Position SizingSuperTrend with position sizing calculator.
This is based on SuperTrend by Kivanc. I only added the position size calculation and displaying the result.
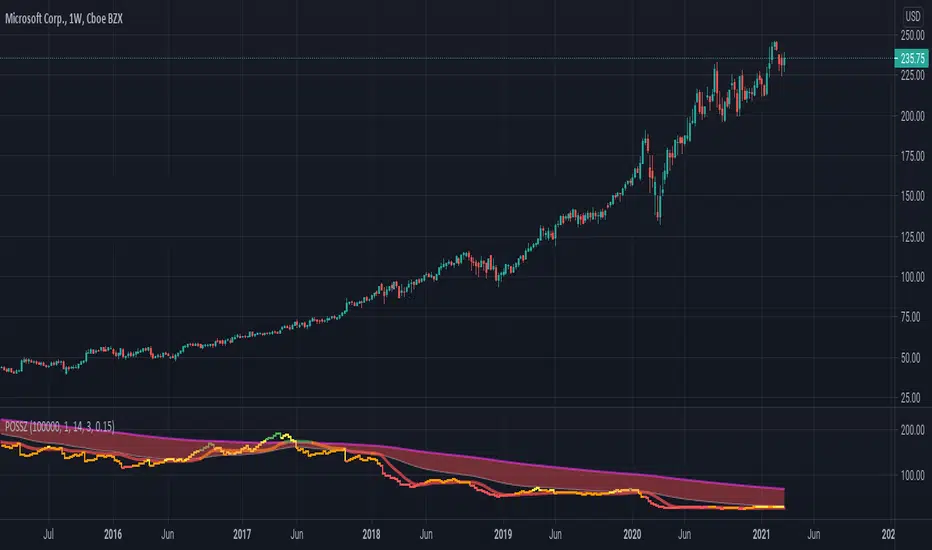
Position SizingATR based position sizing calculator that takes into account the capital, risk percentage and commissions to be paid. Color changes to green as the affordable position size significantly increases relative to recent history.
Position Size Calculator - Fixed Dollar amount, point value ATRHello Traders,
A very simple code aiming to help you size your position, according to the amount you're accepting to lose AND the current volatility ATR.
Why is it important to use ATR size ? Markets move, and having fixed stoploss values will lead to getting stopped out in case of volatility increase.
You also need to size down your trades in case of more volatily, as more points can be taken or lost.
Hope it helps!
Kudos to Racer9 who inspired me :

海龟头寸 (turtle position)Determine the position of the product to purchase according to:
1. max loss that you could tolerate
2. max volatility that you could tolerate (defined as the multiple of the current ATR)
For example:
current ATR = $5
max loss = $1000
volatility multiple = 2
The position will be
p = $1000 / $5 / 2 = 100 (shares)

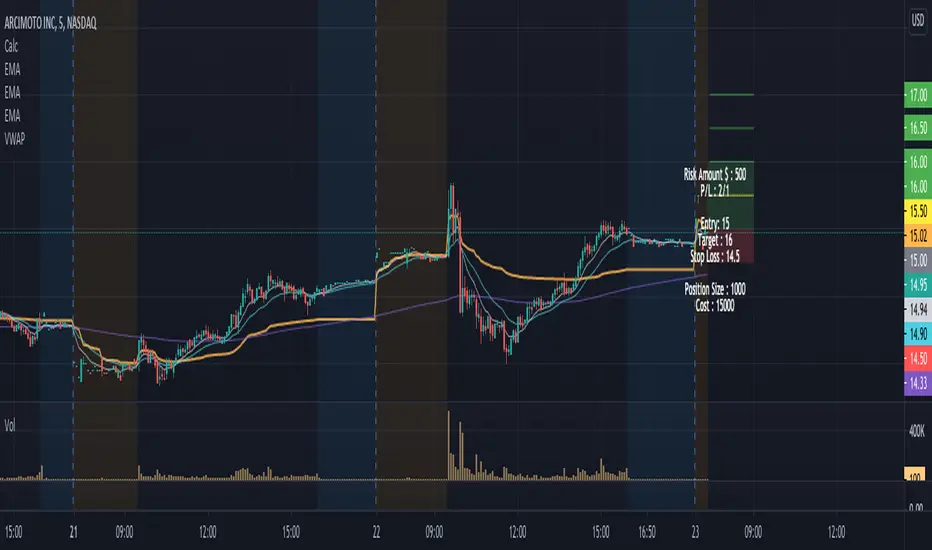
Position Size Calculator w/ profit targetsThis script helps the user visualize profit targets and calculates position size based on the input risk amount.
Input variables:
- Risk amount
- Entry price
- Stop loss amount
- Profit target amount
Calculated variables:
- Profit loss ratio
- Position size
- Postion cost
Plotted variables:
- shaded: entry price --> price target (green filled)
- shaded: entry price --> stop loss target (red filled)
- 1:1 p/l ratio --> yellow line
- 2:1, 3:1, 4:1 p/l ratios --> green lines
Overlay text can be toggled on/off in parameter input section