The Chartless TraderThe Chartless Trader
The chartless trader is a trade management system designed to remove the randomness from the market. It is loosely based on the martingales betting system, but takes advantage of position sizing, minimum profit targets, dollar cost averaging, and trailing take profit.
The chart can be traded with or without a signal. There is a built in signal based on SB Master Chart's Buy the Dip algorithm.
The configurable settings include:
Account Value
Starting Account Value - This is the value of the account when you start using this system.
Current Cash - This is the amount of cash you have available to trade. This setting needs to be updated each time a trade is made.
TP/TTP Algo Settings
Take Profit % - This setting is otherwise known as minimum profit target. This algo will not advise you to sell or increase your trailing stop until this minimum profit target is met.
Trailing Stop % - This is the trailing stop. The default setting is 75%. As a basic example, if the stock is up 10%, the trailing stop would be set to 7.5% (10% * 75%). The algo may override and advise an alternative trailing stop should an overbought condition be detected.
DCA/BTD Algo
DCA/BTD Algo Time Frame - Default is 120 (2hrs). This algo looks for oversold periods on the 2h chart by default.
DCA % - The default for this setting is 5%. This is a trigger for the BTD Algo. The BTD algo will start looking for trades when the stock is 5% below your cost basis. This is to help you average down making it easier to turn a profit when the stock starts making gains.
Position #
The Chartless Trader supports a maximum of 20 symbols. This is a limitation of the security() function as a maximum of 40 calls are allowed and the script calls the security() function twice per symbol.
S# QTY - The number of open positions of the symbol. This has to be manually updated by the user after each buy/sell of the stock.
S# CB - This is the cost basis of the stock. Your broker should give you this after each buy/sell and it has to be updated here on the chart after each buy/sell.
S# TTP - The script will advise you to increase your Trailing Take Profit in your broker when its necessary. This should be updated manually after you update your order in your broker. This should be configured manually in your broker as a Stop Order.
Now that I have covered the configurable options, its important to understand the basis of this system. The martingales betting system is a system that seeks to double its position size each time you enter a losing trade. Eventually when you make a winning trade, it will be enough to cover the previous losses and net you one winning position.
Bet 1, lose 1, down 1.
Bet 2, lose 2, down 3.
Bet 4, lose 4, down 7.
Bet 8, lost 8, down 15.
Bet 16, win 16, up 1.
So the theory goes, if you have deep enough pockets, its a 100% win rate. Such a system is flawed and proven to cause an account to blow up given enough time. You can search Google/YouTube for others that have back tested the martingales system with stocks.
I advise that "The Chartless Trading" system be traded with a similar system, but instead of doubling your position, you simply increase your position size by 1%.
Bet 1%, lose 1%, down 1%
Bet 1%, lose 1%, down 2%
Bet 1%, lose 1%, down 3%.
In such a manner, your risk of ruin is significantly reduced. Lets say you lose 10 times in a row betting on a stock. You now have 10% of your account value in this particular stock. Because you only invested at times where you were more than 5% down and when an oversold position occurred, because of dollar cost averaging and buying during oversold periods, you may only be down 2-3% on your invested value. Eventually when the stock turns positive, you will have met your minimum profit target and the script will alert you to set a trailing stop. You log into your broker, set a stop loss and wait for it to either trigger or inform you to increase it again. Once the trailing stop is triggered, you deleverage the position by closing it and starting a single new position in either the same stock or a different one and the cycle repeats.
The key is to follow the stock down, follow it back up, and not back down. We repeat this cycle with many positions in many stocks to minimize risk and compound our balance sheet.
This is " The Chartless Trader ".
1920x1080p Monitor Required if using all 20 symbols.
The more symbols loaded, the longer the initial processing to load the table. Please be patient.
Positionsizing
MM ATR Risk CalculatorBased on the NNFX Lot size position calculations MoneyMovesInvestments would like to provide to you the Free MM Atr Risk calculator
Directions are simple
Tells you the Atr value
Stop loss in pips
You can enter your account size
Based on your account size, enter the percent you want to risk
then the calculator will tell you your stop loss in pips based on current market and your lot size based on the account size and percent you want to risk
Check us out for your other trading needs
Link below or PM us for access to our other indicators
Happy Trading
Forex Position Size CalculatorPosition size calculator for FOREX only!
Lotsize is calculated by using properties described below.
Properties:
- Show position size: Will only be visible on 5m - 15m - 60m chart
- Account Currency:
- Account Size: Between 0 and 10 000 000 units of currency
- Risk: Between 0 and 100%
- Stoploss: Between 0 and 200 pips
- Textcolor
Position Sizing w/ ADR&ATR TrackingScript to use for position sizing based on portfolio size, max position, and max loss inputs. The option to use custom entry and stop are available, but default to last price for entry, and Low of Day (LoD) for stop. The ATR % is a measure of the low of day to current price as a percentage move.
Credit to LonesomeTheBlue for the base code on position sizing and TheScrutiniser/GlinckEastwoot for ADR formula
-Nelgoth, best of luck
Position Sizing Calculator for StocksThis position sizing calculator uses moving averages to calculate position size.
Here's what you can do:
Set the moving average value
Calculate the moving average as simple or exponential
Set your risk % per trade
Set your account value
Use a custom stop instead of the moving average value
You can also set the maximum % of capital to risk per trade.
The number of shares and percentage of account value will display as a label above the last bar price. It will work on multiple timeframes, but you will need to adjust the moving average length based on your current chart settings. Position sizing and risk management are important aspects of trading which should not be overlooked.
An example of setting your risk % per trade:
The current default is .50% which means that a $100,000 portfolio is willing to lose $500 per trade. The same account using a 1% risk model would be willing lose $1,000.
An example of how position size is calculated:
Portfolio Value=$100,000 Risk %= .50 Entry =$50 Moving Avg Value=$45 Amount I'm willing to lose is $100,000 x.50%=$500 so $500/(50-45) is equal to 100 shares. 100 shares x 50=$5000 or 5% of my total portfolio value.
Best of luck!
Risk Management: Position Size & Risk RewardHere is a Risk Management Indicator that calculates stop loss and position sizing based on the volatility of the stock. Most traders use a basic 1 or 2% Risk Rule, where they will not risk more than 1 or 2% of their capital on any one trade. I went further and applied four levels of risk: 0.25%, 0.50%, 1% and 2%. How you apply these different levels of risk is what makes this indicator extremely useful. Here are some common ways to apply this script:
• If the stock is extremely volatile and has a better than 50% chance of hitting the stop loss, then risk only 0.25% of your capital on that trade.
• If a stock has low volatility and has less than 20% change of hitting the stop loss, then risk 2% of your capital on that trade.
• Risking anywhere between 0.25% and 2% is purely based on your intuition and assessment of the market.
• If you are on a losing streak and you want to cut back on your position sizing, then lowering the Risk % can help you weather the storm.
• If you are on a winning streak and your entries are experiencing a higher level of success, then gradually increase the Risk % to reap bigger profits.
• If you want to trade outside the noise of the market or take on more noise/risk, you can adjust the ATR Factor.
• … and whatever else you can imagine using it to benefit your trading.
The position size is calculated using the Capital and Risk % fields, which is the percentage of your total trading capital (a.k.a net liquidity or Capital at Risk). If you instead want to calculate the position size based on a specific amount of money, then enter the amount in the Custom Risk Amt input box. Any amount greater than 0 in the Custom Risk Amt field will override the values in the Capital and Risk % fields.
The stop loss is calculated by using the ATR. The default setting is the 14 RMA, but you can change the length and smoothing of the true range moving average to your liking. Selecting a different length and smoothing affects the stop loss and position size, so choose these values very carefully.
The ATR Factor is a multiplier of the ATR. The ATR Factor can be used to adjust the stop loss and move it outside of the market noise. For the more volatile stock, increase the factor to lower the stop loss and reduce the chance of getting stopped out. For stocks with less volatility , you can lower the factor to raise the stop loss and increase position size. Adjusting the ATR Factor can also be useful when you want the stop loss to be at or below key levels of support.
The Market Session is the hours the market is open. The Market Session only affects the Opening Range Breakout (ORB) option, so it’s important to change these values if you’re trading the ORB and you’re outside of Eastern Standard Time or you’re trading in a foreign exchange.
The ORB is a bonus to the script. When enabled, the indicator will only appear in the first green candle of the day (09:30:00 or 09:30 AM EST or the start time specified in Market Session). When using the ORB, the stop loss is based on the spread of the first candle at the Open. The spread is the difference between the High and Low of the green candle. On 1-day or higher timeframes, the indicator will be the spread of the last (or current) candle.
The output of the indicator is a label overlaying the chart:
1. ATR (14 RMA x2) – This indicated that the stop loss is determined by the ATR. The x2 is the ATR Factor. If ORB is selected, then the first line will show SPREAD, instead of ATR.
2. Capital – This is your total capital or capital at risk.
3. Risk X% of Capital – The amount you’re risking on a % of the Capital. If a Custom Risk Amt is entered, then Risk Amount will be shown in place of Capital and Risk % of Capital.
4. Entry – The current price.
5. Stop Loss – The stop loss price.
6. -1R – The stop loss price and the amount that will be lost of the stop loss is hit.
7. – These are the target prices, or levels where you will want to take profit.
This script is primarily meant for people who are new to active trading and who are looking for a sound risk management strategy based on market volatility . This script can also be used by the more experienced trader who is using a similar system, but also wants to see it applied as an indicator on TradingView. I’m looking forward to maintaining this script and making it better in future revisions. If you want to include or change anything you believe will be a good change or feature, then please contact me in TradingView.
Auto Position Sizing Risk RewardThe Auto Position Sizing Risk Reward indicator shows different Risk levels 1, 1.5, 2 and 3 based on your risk amount and uses an auto Stoploss level based on the ATR.
You can set the values for the "Note or Title", "Risk Amount", "Entry", "Target Price", "Stop Loss Distance", "Default Risk/Reward" and ATR settings.
The "auto" part comes into play when you haven't yet set an Entry value, which will make everything update according to the latest Closing price of the asset.
Once you set the Entry price, the Risk/Reward levels will stop updating their positions and stay in place. This allows you to dynamically see your potential Risk/Reward as the market progresses, as well as locking in your Risk/Reward levels once you are ready to enter a position.
Your Position Size as well as actual Stoploss level and Cost is displayed along with the other values in the textbox that floats next to the R/R levels.
This indicator was inspired by and relies heavily on the work done by zzzcrypto123 and NXT2017 in their indicators, but I felt that this version is unique enough to hopefully be of use to the general community.
I hope this helps you to trade better! Please feel free to improve it and provide suggestions.
MoneyMoves Strategy V1 The MoneyMoves Strategy V1 is one piece of the it is Hekin Ashi turned into a smooth Moving average for better visual of price trend.
By taking the average of the open, close, high and low of price this indicator will help with seeing short and long term price trend on any timeframe of your liking.
With added buy and sell alarms you can set so you don't miss a trade, also make for a good exit alarm if already in a trade.
In the settings you can change the type of moving average you want to use between sma, ema, wma, hma, vwma, and rma at different sources for your liking. (open/close/high/low)
You can also change the Length of the MA to better fit your liking both open and close prices to make it more precise
When you get A Buy Signal and the Moving Average IS Green= Buy
When you get A Sell Signal and the Moving Average IS Red =Sell
You can also change the colors of the Moving average in the settings tab
Use link below or PM us for access you this indicator. Happy Trading
Position CalculatorThis script calculates how much cryptos or dollars you have to bet with 4 variables : Risk Loss , Leverage, Entry and Stop Loss.
When you want to open a position, just complete the parameters and the script will tell you how much you have to bet in dollars or cryptos units, depending the way you're trading.
Note : don't foreget that you have to pay fees on exchanges whose are not included here, specially with high leverage trades.
Position SizingHello All,
This script can be used for Position Sizing.
After you entered Capital you have, how much you can Risk per Trade, Profit and Stoploss Levels, it calculates Number of Buys/Sells, Position Size and Reward/Risk ratio. you need to choose one of "Long" or "Short" position you will take.
Number of Buys formula = Capital * RiskPerTrade / Loss
Position Size = NumberOfBuys * EntryPrice
Reward / Risk rate = (TargetPrice - EntryPrice) / (EntryPrice - StoplossPrice)
Enjoy!
KiraKira : Position Sizing Bursa MalaysiaPosition Sizing Calculator :
1. Only for Bursa Malaysia
2. User Input :
- Capital
- Entry (EP)
- Stop (SL)
- % Risk
- Risk Reward Ratio
* Overall - still "work in progress"
* Profit value only Gross Profit ( not included brokerage fees etc)
-------------------------------------
- * harap boleh cuba dan boleh bagi feedback utk sy improve - TQ :)
Cracking Cryptocurrency - QuadrigoCracking Cryptocurrency - Quadrigo
An objective method of determining an initial Take Profit and Stop Loss, based on true market volatility and not arbitrary price levels. This indicator gives the user a powerful range of input variation, from Average to Median True Range and a myriad permutations of smoothing and look back lengths, to build an objective value from which to measure profit and stop levels.
This indicator also automatically calculates a recommended position size based on our position sizing methodology. Simply input your capital amount and desired risk level. This indicator will display your optimum position size in USD or BTC, even giving you the flexibility to select your desired exchange for BTC/USD conversion calculations.
Features & Functions
Set custom multipliers for Take Profit and Stop Loss Levels.
Select between Average or Median True Range Calculations.
Select smoothing type and look back length for True Range.
Input custom True Range Level for dialing in precise measurements.
Position Size Calculator.
Aesthetically pleasing display of Take Profit and Stop Loss Levels.
Aesthetically pleasing dashboard display of all relevant trade information including Potential Loss, Distance to Stop Loss, and TR Percentage, among other data.
Indicator displays quantity of position to be removed at each take profit for convenient order setting flow.
---
Purpose
To give clear objective stop losses and take profit levels based off price volatility rather than arbitrary price levels, percentage points, ticks, pips, etc.
Position Size CalculatorPosition Size Calculator
To calculate stop loss in pips, you can use my other indicator ATR pips
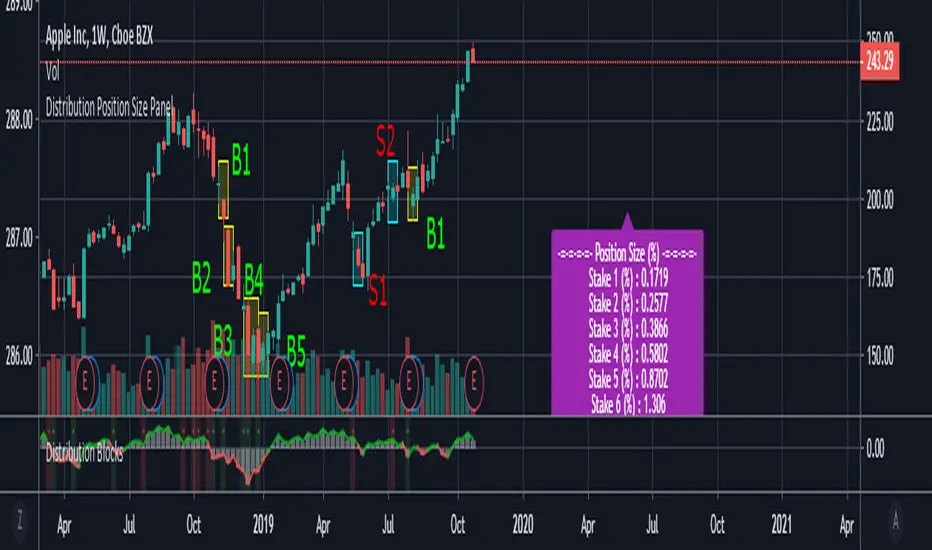
Distribution Position Size Panel
This panel is an example position size panel that I prepared and I consider the rates reasonable.
I have prepared this panel so that the money allocated to the investment ends 14 consecutive signals.
The sum of the ratios is 100 units.
You can adjust your positions according to this panel.
The first steps are low rates.
If the phrases are strong, you can specify a position size from the lower digits.
Likewise, when you make a big profit, you can empty your profits in the lower steps.
In the event of a color change, you can return to the beginning or lower limit.
NOTE: This script is an auxiliary command to the distribution blocks script,
if you want to use another script, you can add distribution days to yours.
14 th stake does not appear in the preview, you need to reduce the size of the distribution blocks indicator slightly.
Rafael Zioni's examples of the panels helped a lot, thanks to him.
Stay tuned ! Regards , Noldo.
Custom position sizerThis is a simple script to aid with determining position size.
Inputs are the intended entry price, desired risk (expressed as % of account at risk), account value, and leverage factor.
To use the script;
1. Identify and update the entry price (yellow line on the chart)
2. Update with desired risk
3. Update with account size
4. Adjust the leverage value until the stop loss (red line on chart for long positions, green line for short positions) reaches the desired value/location on the chart
The label will then update to show the required position size for the trade.
ATRPositionSizerThe ATR Position sizer allows the trader to size Forex and Equity positions based on how much % movement in equity is allowed within a predefined ATR range period.
Current default settings are:
The calculated trade size = N*ATR Movement = % Up/Down Movement in Equity = 1 Unit
N is an ATR multpile.
ATR time frame is defaulted to weekly and can be changed.
% Unit Risk is set to 0.5 and can be changed.
The ATR position sizer plots the recommended trade size (green) and equity line (blue).
A maximum allowed capital allotment to any given trade can also be specified in terms of %. If trade size exceeds max capital allocation, the trade size line turns red.
This type of sizing approach is useful when managing a portfolio of assets.
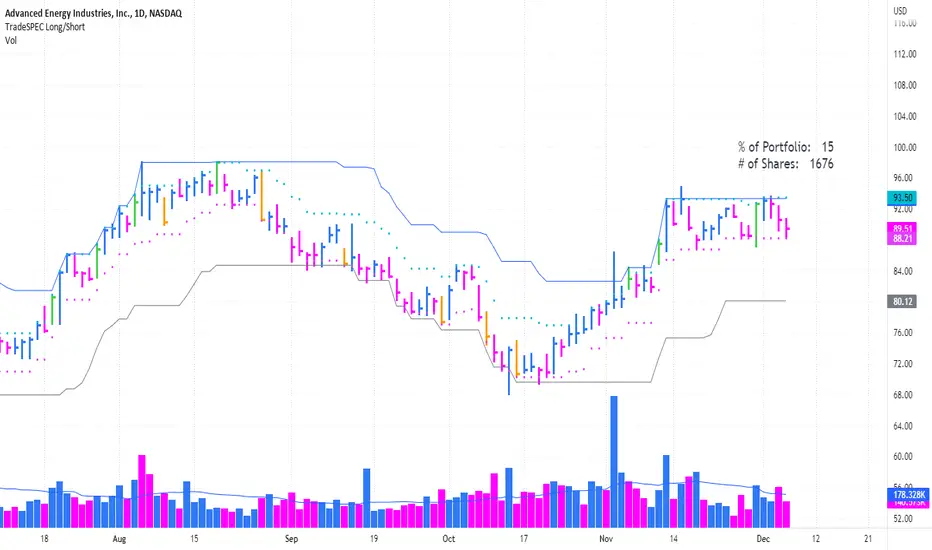
TradeSpec-Designed for Crypto, Stocks, Currencies and Futures TradeSpec- Overview
1. Main Trend (gray line) lets you see your trailing stop as the the trend progresses and provide a definitive point to know where to execute your sell and lock in your profits. Also, you have the ability to adjust the indicator value based on your trading time frame and objective.
2. Initial stop value (pink dotted line) can be used to determine position size.
3. Specific price bars ( yellow or green) are highlighted to show potential starting points for new or continued trends.
4. Price Alerts Indicator (orange or green crosses above price) looks to highlight areas of importance during a trend. Become aware when the trend could be ready to plateau for a while or when a top could be forming. The alert markers can be used to tighten your trailing stop, remove a portion of the trade, or be used as an indication to remove the position entirely.