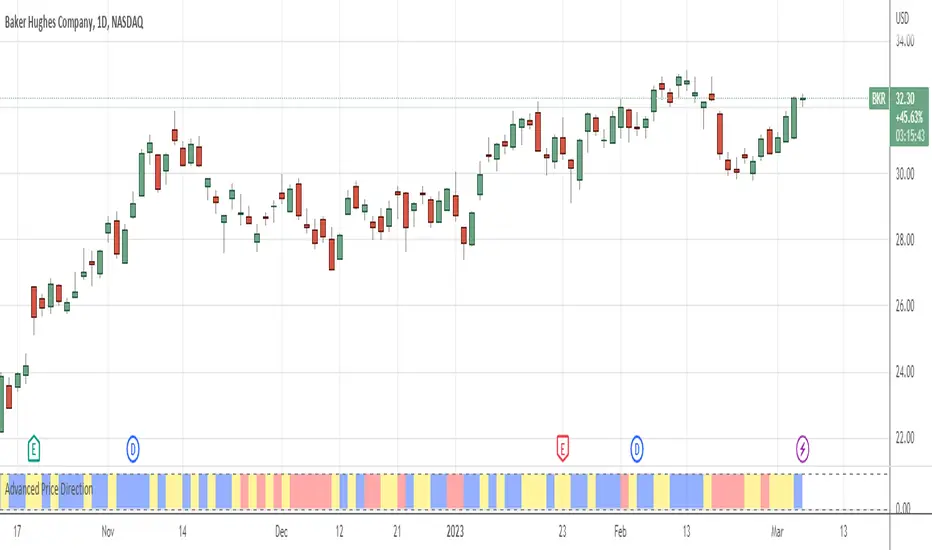
Elephant Bar by Oliver VelezThis script detects an event created by Oliver Velez, basically it is a wide-range candle, its range is noticeably larger than the previous candles, this event indicates a possible continuation of the movement, or the beginning of an extended movement. The candle has to be of good body, as a rule it can be taken that the body must be more than 70%. The stop goes below the minimum of the candle and the signal is given when the next candle followed by the elephant candle exceeds its body, this condition is not programmed so that the alert indicates that an elephant candle was generated and the trader has some time to visualize the graph and wait for the signal. Example below:
NOTE: IT IS VERY IMPORTANT THAT THE TRADER ANALYZE THE CONTEXT OF THE MARKET WHERE THE ELEPHANT BAR IS GENERATED AND DETERMINE ACCORDING TO ITS EXPERIENCE IF THE EVENT HAS A GOOD PROBABILITY OF PROJECTION, YOU MUST NOT TAKE AN ENTRY ONLY BY THIS EVENT, IF YOU DO YOU WILL LOSE ALL YOUR MONEY
.
One of the problems of the elephant bar is that it generates a fairly wide risk unit with respect to other narrow range events, so the risk / benefit ratio is not very large, but it is an event that deserves attention when it occurs in a good location since it generally generates continuation.
If you want to have a lower risk unit and improve the risk / benefit ratio, you can play the “Gift Zone”, when detecting an elephant bar you can wait for a step back inside the elephant bar area and take a position, this will give you a less distance to the stop, but this can lead to the event escaping if there is no recoil.
- The size of the candle is determined by comparing a range of previous candles (you can set the amount at your discretion)
- Search factor: by default 1.3, this means that all bars that have a range greater than the average range of previous candles + 30%, are considered elephant candles (can be configured at your discretion)
- Possibility to configure the percentage of the body that the elephant candle must have.
- Possibility of filtering up to 2 means with direction detection and color change (fully configurable)
- Possibility of filtering by mobile averages
- Alerts
- Additional features
Thumb up if you liked me ..
Priceaction
Bull Bear 180 by Oliver VelezThis script detects an event created by Oliver Velez is called Bull / Bear 180, in the following images the event is detailed:
- The size of the control bar can be set compared to a number of previous bars
- The minimum % of the control bar body can be set
- You can filter by trend
- Possibility of seeing fast and slow media with direction detection and color change
- Various graphic settings
- Event alerts
To enjoy!
A thumbs up if you like me!
The Fantastic Four of Oliver VelezThis script graphics the "fantastic 4" area, was created by oliver velez and is used in the opening of the american stock market, determined by:
1- ma200 at the closure of the previous day
2- ma20 at the closure of the previous day
3- price of previous day closure
4- activity of the last 30/60 min prior to the closure of the previous day (search the maximum and minimum)
Basically it is a very important support / resistance area the first hour from the opening, the trap area is an area in which it should be avoided to operate if the price opens within the same. In advance of being used as a support / resistance area if the price opens above the 4f is looking for longer opportunities (many more aspects should be evaluated) and if it is below.
Configuration:
- possibility to modify the amount of minutes of the activity of the previous day.
- possibility of hidding the "trap area" label.
- possibility of hidding the "change to temporary frame of 2 min" label.
Note: the temporary framework used is the 2 min, in the event of being in another temporary framework the indicator will not work and will be alerted with a label
Kay-Rules: Candlestick PatternsThis indicator will mark 5 different candlestick patterns:
(1) bullish & bearish engulfing
(2) hammer & shooting star doji
(3) dragonfly & gravestone doji
(4) morning & evening star doji
(5) bottom & top tweezer
You may follow candlestick trading strategy by Rayner Teo here
Keltner ZonesThis is an indicator that draws support and resistance zones / levels based on price action in and around Keltner Channels.
There are 3 different modes;
Draw zones based on price breaking the upper band
Draw zones based on price breaking the lower band
Draw zones if price stays within the bands for a prolonged period of time.
You can also decide if you want the indicator to paint zones or levels. The Zones can grow rather large if there is a volatility shock since they are drawn using the true range around the trigger price.
Upper Band Zones
Lower Band Zones
Congestion Zone
Wick Delta Buy/Sell PressureIf you think of a perfect doji candle, where the wicks on top and bottom are exactly the same, that's a candle with a delta of 0. What this indicator does is show the delta/difference between wicks, if the top wick is longer than the bottom wick it show's sell pressure/bear interest, which is displayed as a red bar and vice versa for buy/bull pressure, which is shown as green bars. I added arrows for clarity.
It's a different way of visualising wicks, which can clarify sentiment and be a useful way to understand wicks better in general. One way to use it is to look for clusters of 3/4 larger bars in a row, which generally helps to determine future direction especially when seen at important levels.
RSI LabelAdds a purple label to the right of price if RSI is overbought or oversold, otherwise it doesn't show anything at all, nada. Handy for people (like me) who often focus on price action and forget to watch the RSI
IO_Volatility Quality Zero LineThis is the Volatility Quality Zero Line Indicator. This indicator measures volatility strength.
Highs & LowsHigh and Lows Script.
For all the price action lovers out there.
Hope you all enjoy.
Thanks
Grimes Modified MACD Supply DemandA follower of mine asked me if I could make a version of my www.tradingview.com script using the MACD. Well it just so happens I was making a few modifications to my MACD script: just as this question came up so I went ahead and threw this together.
The MACD that triggers the SR zones is pictured below, with key trigger points encircled to illustrate how it works.
The Center..some measure of “center” or average price is useful.
- Adam H. Grimes
This line off Adams blog inspired me to cook up a very simple indicator that just takes the High and Low of the time given (input in minutes), adds them together and divides it in half. This way we get a center based on the higher timeframe. Not only does it inform you of the dominating trend, but also works as a sort of momentum indicator if you measure the distance price is from the center.
Got the daily high/low calculations off www.tradingview.com
Swing PointsThis indicator gives a clear indication of price action swing-points as well as an indication of whether it is a higher, lower, or equal swing point relative to the last high/low.
4Hours optimized CARHey!
I have been working on this script the lasts days, it's a collaboration with an uruguayan mate.
#####IMPORTANT#####
* It has been optimized for 4h charts, use it on other at your own risk.
* Always use Stop Loss, since it might give false signals after a long trend.
* I'm still working on it, I'm going to add candlestick pattern filtering.
Thanks for your support, greetings.
ZEC/ETH/XMR/DASH PORTFOLIO KRAKENPortfolio chart with total value.
I will try to optimize it, maybe add % option if I findout how ;p
Or maybe a normalization would be good, idk.
Cheers!
Range Filter [DW]This is an experimental study designed to filter out minor price action for a clearer view of trends.
Inspired by the QQE's volatility filter, this filter applies the process directly to price rather than to a smoothed RSI.
First, a smooth average price range is calculated for the basis of the filter and multiplied by a specified amount.
Next, the filter is calculated by gating price movements that do not exceed the specified range.
Lastly the target ranges are plotted to display the prices that will trigger filter movement.
Custom bar colors are included. The color scheme is based on the filtered price trend.
Percentile Trend Channel [DW]This is an experimental study designed to identify the trend of price action over a specified period using percentiles.
First, the 50th percentile is calculated over the sampling period using the nearest rank method. I've found that this calculation is useful as a proxy for moving averages and other filters of that class.
Next, the channel levels are calculated. In this study, there are three channel methods to choose from:
-Percentile Donchian, which calculates Donchian Channels using the 100th and 0th percentile ranks
-Percentile Keltner, which calculates the 50th percentile true range multiplied by a specified amount, then adds it to and subtracts it from the 50th percentile
-Percentile Bollinger, which calculates 50th percentile standard deviation multiplied by a specified amount, then adds it to and subtracts it from the 50th percentile
I also included a squeeze box option within this script, which is derived from my original Squeeze Box tool.
This option detects squeezes in the specified channel's range by a specific percentage, and plots the channel values where the squeeze begins.
The box also has a range multiplier, which can be used to expand or contract its range.
Custom bar colors are included. The color scheme is based on the perceived trend over the specified sampling period.
ULTIMATE ICHIMOKU TRADING SUITEThis is an update of "Uncle Mo's Ultimate Ichimoku V1"
Main features:
2 x Ichimoku Cloud
5 x EMA
2 x MA
1 x HullMA
Williams Fractal
Bollinger Bands - ***NEW***
ATR - ***NEW***
PSAR - ***NEW***
Candlestick Patterns - ***NEW***
Price Action Bars- ***NEW***
List of credits:
@br0qn for the Ichimoku
@RicardoSantos for the Bill Williams Fractal
@EmilianoMesa for the EMAs/MAs
@mohamed982 for the HullMA
@ymaheshreddy4u for the Bollinger Bands
@ChrisMoody for the Price Action Bars and PSAR
@HPotter for the ATR
@repo32 for the Candlestick Patterns
The script is open source and free to use. Feel free to change it around to suit your needs.
***If you copy & paste code from other traders to make your own script, please do remember to give them credit for their amazing work.***
Happy trading!
AGHYAD_Renko+Sniper+PAB+TZ+ICHIMOKU_V21. MUST: RENKO ATR 2 YELOOW
2. STRONG: SNIPER 8,8 BUY SIGNAL
3. WEAK: TZ 6,6 BUY SIGNAL
========= SELL =========
1. STRONG: SNIPER 8,8 SELL SIGNAL
2. WEAK: TZ 6,6 SELL SIGNAL
3. WEAK: RENKO ATR 2 RED
=========NOTE=========
RENKO > SNIPER > TZ
6 minutes ago
the sniper buy signal is now based on renko
YTC - Swing Highs & LowsThis Indicator Plots Swing Highs & Swing Lows based on Lance Beggs of (Your Trading Coach) definition:
A Swing High (SH) is a price bar high preceed by two lower highs (LH) and followed by two lower highs (LH)
In the event of multiple candles forming equal highs, this will still be defined as a swing high, provided that there are two candles with lower highs both preceding and following the multiple candle formation.
[Tutorial] RSIwings (swings) for find pyramiding entries ->hh,llThis indicator show higher high + higher low and lower high + lower low -> based on RSI modification.
HOW I USE
On a longsetup I set a buyorder on the high, if the RSI swings show red the first time. My stoploss I choose on the lowest price from the red swing before.
After every ending bar without tradeentry I move the buyorder step by step on the last high till the price move up and the longtrade start.
The same game I use for sellorder with the green swings, if I want a shortsetup. Best times for this are retracements from a trendchannel i.e.
HOW I PYRAMIDING
From swing to swing with the same color I move my stoploss. If my risk are 100 USD and with the next moving stoploss are only 60 USD in risk, then I have 40 USD for my next pyramiding trade in the same trendsetup.
WHEN I MOVE MY STOPLOSS
If I have choose a stoploss, than this is fixed till the last highest/lowest price from the other swing is broken.
Any questions? Ask me!
Candlestick Patterns [DW]This is a simple study designed to track multiple candlestick patterns. Custom alerts included.