Price Change IndicatorPrice Change Indicator (PCI)
Version: 1.0
Author: LazyTrader 🚀
🔍 Overview
The Price Change Indicator (PCI) helps traders visualize and compare price changes between the current bar and the previous bar. It provides a customizable display of price changes in two formats:
Percentage (%) Change – Relative price movement.
Natural Change – Absolute difference in price units.
⚙️ Key Features
✅ Customizable Calculation Method: Choose how the price change is calculated:
Opening Price
Closing Price
High
Low
✅ Flexible Display Format:
Show Percentage (%) Change.
Show Natural (Absolute) Change in price.
✅ Adjustable Sensitivity with Multiplier:
100 (Standard Change)
1000 (Small Change)
10000 (Tiny Change)
✅ Intuitive Labeling:
Green label (above bar) for increase.
Red label (below bar) for decrease.
No label if no change.
Large, easy-to-read labels for better visibility.
✅ Perfect for Any Market:
Stocks 📈
Forex 💱
Crypto 🚀
Commodities 🛢️
📊 How It Works
The indicator calculates the difference between the current and previous bar’s price based on your chosen method.
The result is displayed as either a percentage (%) or a natural price change.
If the price has increased, a green label is displayed above the bar.
If the price has decreased, a red label is displayed below the bar.
⚡ How to Use
Add the indicator to your chart.
Go to settings and customize:
Select calculation method (Open, Close, High, Low).
Choose display format (% or Natural Change).
Adjust multiplier for more sensitivity.
Analyze the labels to see price movements easily!
🔧 Settings Explained
Setting Description
Price Calculation Method: Choose Open, Close, High, or Low price for comparison.
Display Format: Show either % Change or Natural Change.
Multiplier: Apply 100, 1000, or 10000 to scale small price changes.
Show Labels: Toggle labels on/off.
🎯 Best Use Cases
🔹 Identifying strong price movements
🔹 Spotting trends and momentum shifts
🔹 Comparing price movement intensity
🔹 Works for scalping, swing trading, and long-term analysis
Pricechange

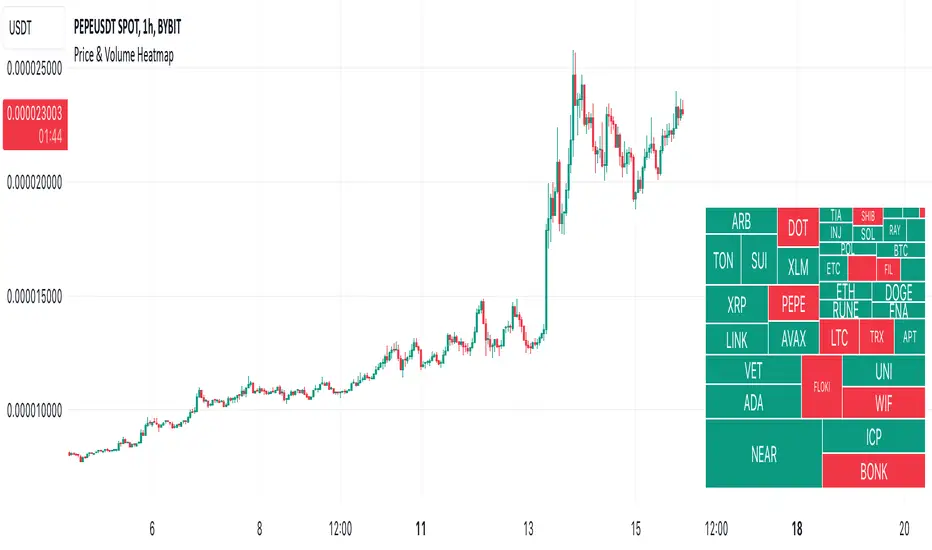
Price & Volume HeatmapDescription:
Displays a heatmap (like TV's Stock Heatmap) for up to 40 symbols (either from 3 presets, or custom). It can show Price Change, Volume Change and Volume (in $). The text size for each symbol can auto-change based on whether it fits into the cell. Each cell shows the name of the symbol, and when hovered - it shows the value.
Inputs:
- Symbols -> which symbols to use (Custom, or predefined list of Stocks/Crypto/Forex)
- Data -> show Price Change (%), Volume Change (%) or Volume ($)
- Custom -> put your custom list of symbols here (comma separated without spaces, up to 40 symbols)
- Position -> heatmap position
- Height / Width -> height / width of the heatmap (% of indicator's space)
- Text Size -> can be constant (Tiny/Normal/etc) or automatically change based on the text of each cell (Auto/Auto (Smaller))
- Color -> text color
Notes:
It is not recommended to use the script on timeframes below 30 seconds, because it may be too slow there (since it's based on a table object, it might be slow).
Outlier changes alertAn indicator that calculates click (price change), percentage change, and Z-score changes while displaying outliers based on defined ranges.
Outlier Detection:
Mark outliers (for price, percentage, Z-score) based on user-defined thresholds. For example, any price movement exceeding a certain Z-score or percentage change could be marked as an outlier and displayed on chart.
Indicator Overview:
1. Click (Price Change):
Calculate the absolute price change from one period to another (e.g., from the current closing price to the previous closing price).
2. Percentage Change:
Calculate the percentage price change over a specific period, showing how much the price has changed in relative terms compared to the previous price.
3. Z-Score:
Compute the Z-score to standardize the price change relative to its historical average and standard deviation. The Z-score helps in detecting whether a price movement is an outlier or falls within a normal range of volatility.

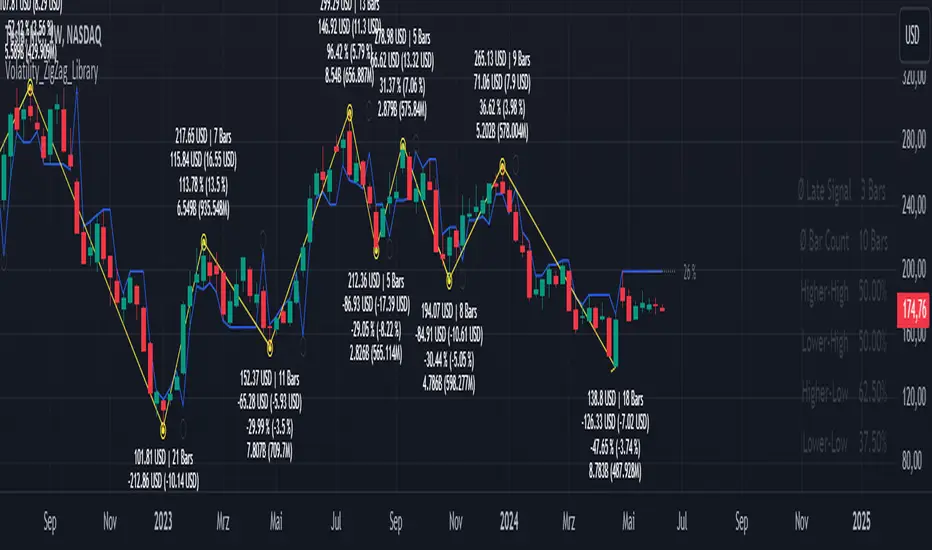
Volatility_ZigZag_LibraryThis is a Pine Script library for the public indicator "Volatility ZigZag" by brettkind. For further description, please refer to the information available on the original indicator page.
Library "Volatility_ZigZag_Library"
getValues_andStyling_VolatilityZigZag_byBrettkind(hl_src, SOURCE, length, min_dev_input, stdev_fctr, ZigZag, zz_color, zz_width, zz_devline, zz_points, zz_alert_sign, ZZ_Label, ZZ_Label_clr, rev_text, zz_bars_text, pcabs_text, avg_pcabs_text, pcrel_text, avg_pcrel_text, vol_text, avg_vol_text, input_currency)
Parameters:
hl_src (bool)
SOURCE (float)
length (int)
min_dev_input (float)
stdev_fctr (float)
ZigZag (bool)
zz_color (color)
zz_width (int)
zz_devline (bool)
zz_points (bool)
zz_alert_sign (bool)
ZZ_Label (bool)
ZZ_Label_clr (color)
rev_text (bool)
zz_bars_text (bool)
pcabs_text (bool)
avg_pcabs_text (bool)
pcrel_text (bool)
avg_pcrel_text (bool)
vol_text (bool)
avg_vol_text (bool)
input_currency (string)
getStatisticTable_VolatilityZigZag_byBrettkind(x1, Y1_array, draw_tbl)
Parameters:
x1 (int)
Y1_array (array)
draw_tbl (bool)
Trade-o-Scope: Multi-Asset Price TrackerTrade-o-Scope team presents the "Multi-Asset Price Tracker" indicator.
"Multi-Asset Price Tracker" is designed to help analyze price changes across multiple assets within time intervals you define.
Motivation:
Most screeners on the market track price changes over predefined periods, like 1H\4H\12H\1D\3D\7D\etc. Typically, they compare initial and current prices.
But what if you want to analyze assets' performance over arbitrary historical intervals?
Perhaps you want to spot which assets dropped most within 7 hours after a specific industry announcement? Or do you want to check which asset grew the most in January last year?
This is where the "Multi-Asset Price Tracker" shines. It lets you define arbitrary intervals and track price changes for selected assets.
Overview and functionality:
Define arbitrary time intervals in history for analyzing price changes.
Create up to 10 lists, each with up to 40 symbols to track. Populate lists with data from text files, Excel, or CSV. Lists are just multiline text strings, each line representing an individual symbol.
Switch between lists, with one active list at a time.
Specify up to 3 fixed symbols for additional analysis alongside active list symbols. You may use them as reference points to compare price changes of the symbols in the List.
Customize table appearance and position.
Set sorting criteria and direction for displayed values.
View the results in a table on the chart.
How it works:
"Multi-Asset Price Tracker" will track the symbol's price during the interval you define.
The indicator identifies each symbol's Start, Max, Min, and End prices during the interval. It then calculates relative changes: Start-to-Max, Start-to-Min, and Start-to-End.
The list of relative changes is ordered by the column chosen in settings and displayed on the chart.
List example (up to 10 Lists):
BINANCE:WLDUSDT.P
BINANCE:WOOUSDT.P
BINANCE:XEMUSDT.P
...
...
(up to 40 symbols per List)
Calculation example:
Symbol Start-price = $100
Symbol Max-price = $150
Symbol Min-price = $75
Symbol End-price = $110
Start-to-Max = 100% * (Max-price - Start-price) / Start-price = 100% * ($150 - $100) / $100 = 50%
Start-to-Min = 100% * (Min-price - Start-price) / Start-price = 100% * ($75 - $100) / $100 = -25%
Start-to-End = 100% * (End-price - Start-price) / Start-price = 100% * ($110 - $100) / $100 = 10%
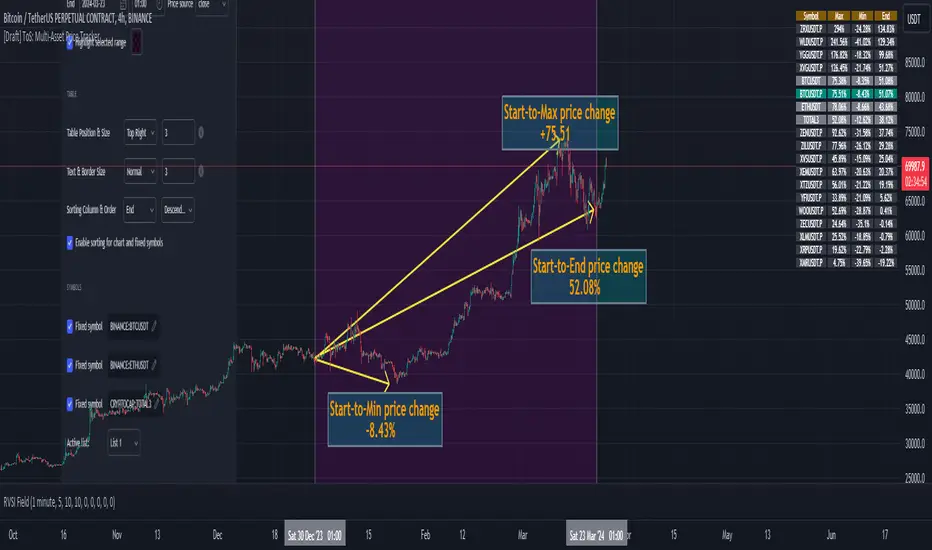
Chart example:
In the provided chart, you can observe an example with a table generated by the indicator, along with manually added arrows and labels explaining the calculation process for an individual symbol from the list.
How to use:
1) Add "Multi-Asset Price Tracker" indicator to the chart
2) The indicator will ask you to define the start and the end of the interval using the mouse on the chart.
Voila! You'll see the table with sorted relative price changes based on default list values and settings.
3) Customize the indicator's settings:
Define the interval Start and End datetime.
Optionally, change the interval Start and End by clicking on the indicator name and dragging the vertical mark at the edges of the interval to a new position.
Define the Start and End price sources.
Choose a color to highlight the interval on the chart's background.
Set the table position, size, text size, and border size.
Specify the column for sorting and its direction.
Choose whether to sort chart symbols and fixed symbols together with list symbols or display them at the top of the table irrespective of their relative price change.
Enable fixed symbols if needed, and define up to 3 fixed symbols.
Define symbol lists, with up to 10 lists and 40 symbols each.
Select which List to make active - symbols from the active list will be calculated and displayed.
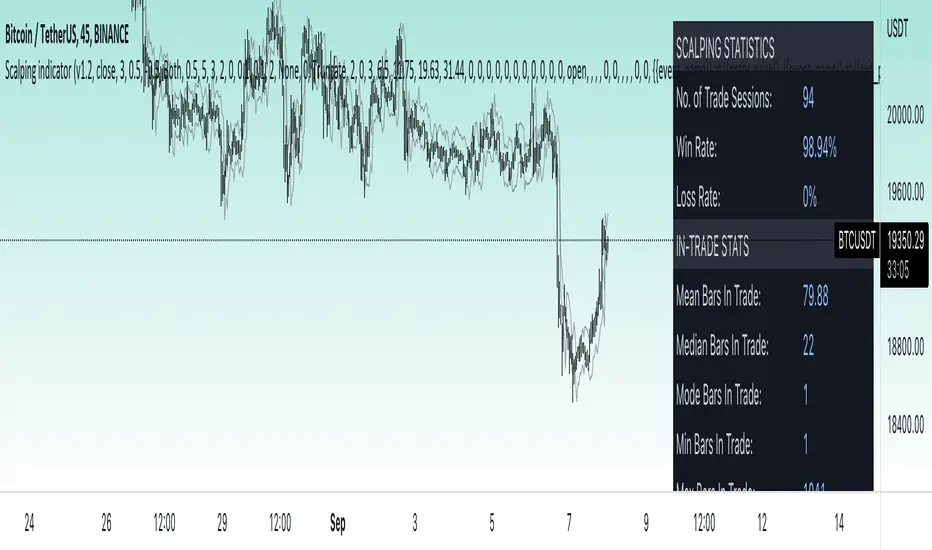
Price change scalping short and long strategy indicatorPrice change scalping Short and Long indicator uses a rate of change momentum oscillator to calculate the percent change in price between a period of time. Rate of change calculation takes the current price and compares it to a price of "n" periods while the period of time can be defined by a user. The calculated rate of change value is then compared to the upper threshold and the lower threshold values to determine if a position should be opened. If the threshold is crossed and filtering conditions are met a strategy position will be triggered. Entry, take profit, and stop loss prices are calculated and displayed on the chart as well as positions directions. Once the entry price is crossed, a long or short position is created and once the take profit price is crossed, the stop loss price will begin to trail behind the price action using the close of the previous bar. Once the trailing stop price is crossed, the position is closed. If the entry price is not crossed and the price action crosses the stop level, the trade setup is cancelled. The indicator is enhanced by DCA algorithm which allows to average entry price with safety orders. The script also allows to use Martingale coefficient to increase averaging power
Advantages of this script:
The indicator has custom alert settings for each strategy action
The indicator can be used with 3Commas, Cryptohopper, Alertatron or Zignaly bots
High frequency and low duration of trades
Can be used with short-term timeframes ranging from 5 to 60 minutes
Indicator is sustainable to market slumps due to DCA implementation
Can be used for short and long positions (can be adjusted to long only, short only or both)
Can be applied to any market and quote currency
Easy to configure user interface settings
Built in detailed statistic menu
How to use?
1. Apply the indicator to a trading pair your are interested in using 5 to 60 minutes timeframe chart
2. Configure the indicator: change layer values, order size multiple and take profit/stop loss values according to current market cycle stage
3. Set up a TradingView custom alert using the indicator settings to trigger on a condition you are interested in
4. indicator will send alerts when to enter and when to exit positions which can be applied to your portfolio using external trading platforms
5. Update settings once market conditions are changed using backtests on a monthly period
Price change scalping short and long strategyPrice change scalping Short and Long strategy uses a rate of change momentum oscillator to calculate the percent change in price between a period of time. Rate of change calculation takes the current price and compares it to a price of "n" periods while the period of time can be defined by a user. The calculated rate of change value is then compared to the upper threshold and the lower threshold values to determine if a position should be opened. If the threshold is crossed and filtering conditions are met a strategy position will be triggered. Entry, take profit, and stop loss prices are calculated and displayed on the chart as well as positions directions. Once the entry price is crossed, a long or short position is created and once the take profit price is crossed, the stop loss price will begin to trail behind the price action using the close of the previous bar. Once the trailing stop price is crossed, the position is closed. If the entry price is not crossed and the price action crosses the stop level, the trade setup is cancelled. The strategy is enhanced by DCA algorithm which allows to average entry price with safety orders. The script also allows to use Martingale coefficient to increase averaging power
Advantages of this script:
Strategy has high net profit of 293% at backtests
Backtests show high accuracy around 71%
High frequency and low duration of trades
Can be used with short-term timeframes ranging from 5 to 60 minutes
Strategy is sustainable to market slumps due to DCA implementation
Can be used for short and long positions (can be adjusted to long only, short only or both)
Can be applied to any market and quote currency
Easy to configure user interface settings
Built in detailed statistic menu
How to use?
1. Apply the strategy to a trading pair your are interested in using 5 to 60 minutes timeframe chart
2. Configure the strategy: change layer values, order size multiple and take profit/stop loss values according to current market cycle stage
3. Set up a TradingView alert to trigger when strategy conditions are met
4. Strategy will send alerts when to enter and when to exit positions which can be applied to your portfolio using external trading platforms
5. Update settings once market conditions are changed using backtests on a monthly period

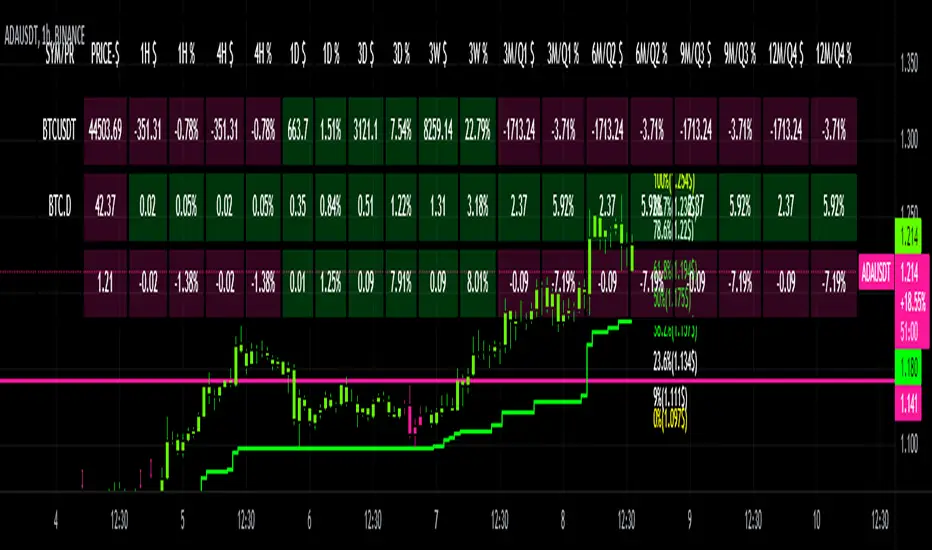
CRYPTO DASHBOARD Gs₿A Simple Crypto Dashboard/Screener which indicates the Price and percentage changes for the Given Period of time i.e for 1 Hr ,4 Hrs, 1 Day, 3 Days, 3 Weeks and 3 - 12 Months. By Default it displays #BTC and its Dominance and current trading pair Price and % changes.
BankNifty Multi-TimeFrames Price Panel [MaestroTrader]█ OVERVIEW
Price Panel provides Nifty /BankNifty Index comprehensive Price Insights on different time intervals. It helps to determine the trend of Index using top Index Heavy Weights along with Dow, India VIX & Index Spot Prices. It helps to determine the price behavior of the underlying Index/stock to make informed decisions while trading.
█ FEATURES
a) Displays Price in Multi Time Frames for Multi time frame analysis
b) Displays Weighted Securities price for Weighted INDEX price analysis.
c) Displays INDIA VIX and DOW for Combined INDIX VOLATALITY Analysis
█ MUTLI TIME FRAME ANALYSIS
How to use Multiple time frame analysis?
Multiple time frame analysis follows a top-down approach when trading and allows traders to gauge the longer-term trend while spotting ideal entries on a smaller time frame. Traders can then conduct technical analysis using multiple time frames to confirm or reject their trading bias.
Multiple time frame analysis, is the process of viewing the same symbols under different time frames. Usually, the larger time frame is used to establish a longer-term trend, while a shorter time frame is used to spot ideal entries into the market.
Let’s Say 75 & 15 TF’s Trend is up, then shorter time 5M is used to spot ideal entries on long side.
█ WEIGHTED INDEXS PRICE ANALYSIS
How to use Weighted Index Price Movement in Multi timeframes?
The index future trading price is based on the trading prices of the individual securities (stocks) that comprise the index basket. In other words, the stocks with higher weights will have more impact on the movement of the index. Price Panel provides the insights of these heavy weight stock price movement in different time frames, that can help you confirm or reject your trading bias.
HDFC Bank (28% Weight) will have more impact on the BankNifty Movement. By looking the top 4 bank's price movement in different timeframes, you can derive the BankNifty price trend.
█ VOLATALITY ANALYSIS
India VIX is a short form for India Volatility Index. It is the volatility index that measures the market’s expectation of volatility over the near term.
A lower VIX level usually implies that the market is confident about the movement and is expecting lower volatility and a stable range.
A higher VIX level usually signals high volatility and lower trader confidence about the current range of the market. A major directional move can be expected in the market and a quick broadening of range can be expected.
█ SETTINGS
• Time Frame Settings: Configure Time Frames 5 Min, 15 Min, 75 Min
• Table Settings: Configure Table Styles- Position- Font Color
• Symbol Settings: Configure Securities. Toggle (on/Off) Securities display.
• Index Settings: Display Bank Nifty or Nifty Heavy Weights.
█ PANEL DISPLAY VARIATIONS
BANK NIFTY VIEW
NIFTY VIEW
WITHOUT STOCKS - ONLY INDEX, VIX, DOW
█ THANKS
Thanks to Pine Team for this new great feature tables & Thanks to PineCoders for the `f_strRightOf` function.
█ DISCLIAMER
Indicator is built for educational purposes. Test it before use.
Hope - These features help you get quick insights of the price movement to take informed trades.
You are free to use the code, please share the credit for reuse.
Happy Trading !!

Volatility InfoThis indicator is an information panel. It shows 4 hours, daily and weekly price changes.
Lookback period and all three resolutions can be change in indicator settings.
It is very easy to add more symbols in the script.
Happy trading.

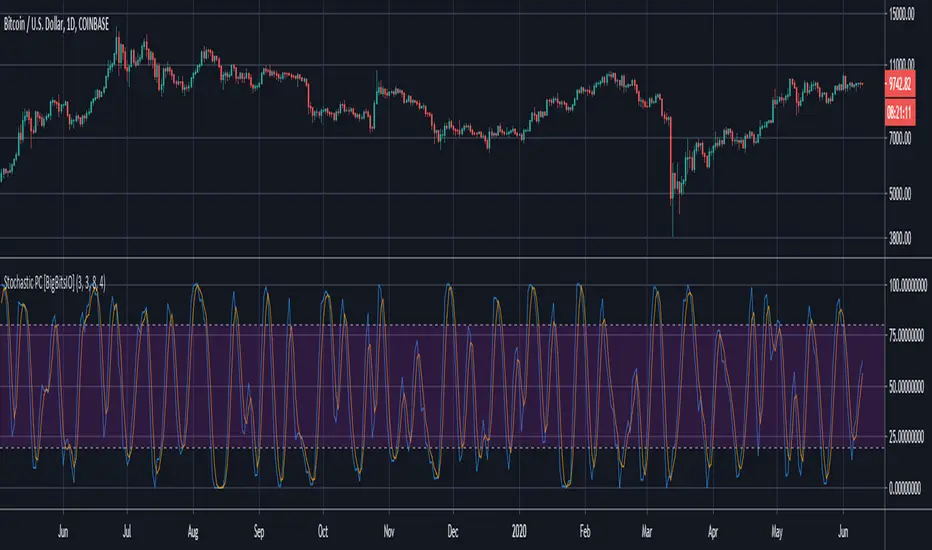
Stochastic PC [BigBitsIO]This script is a very simple stochastic calculation similar to Stochastic RSI that calculates a stochastic value of a moving average of the percentage price change. The purpose of the indicator is to find positive and negative volatility momentum peaks which might be able to help identify changes in trends. Like other stochastic indicators, it may be best used in combination with other indicators.
Explained:
- First gets the % change for the candle from open to close. Green candles produce positive values, red candles produce negative values.
- Then it creates a moving average of that number to try and reduce impacts of very large moves, although this can be changed with the super-fast smoothed length setting. Set it to 1 to remove all smoothing.
- After that, it creates a K value using a stochastic calculation based on the range of the price change moving average we created in the previous step. Set the smoothK to one to use a fast stochastic calculation, it is a slow stochastic calculation by default (3-period SMA of stochastic)
- Finally, to create the D value it calculates a 3-period SMA of the K value.
FAQ:
- Why is this script useful?
- This script can help identify the peaks and valleys of volatility momentum
DISCLAIMER: For educational and entertainment purposes only. Nothing in this content should be interpreted as financial advice or a recommendation to buy or sell any sort of security or investment including all types of crypto. DYOR, TYOB.
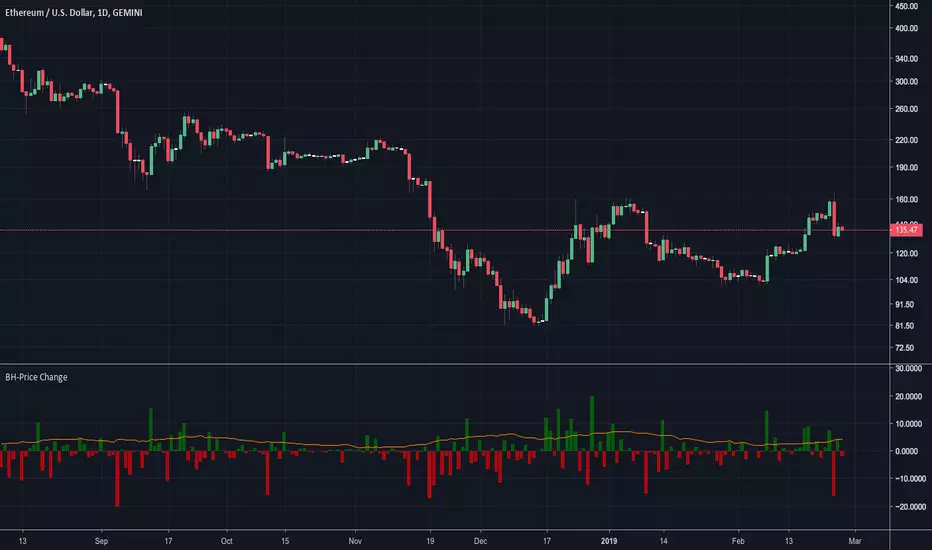
BossHouse - Price ChangeBossHouse - Price Change
What it is:
In the stock market, a price change is the difference in trading prices from one period to the next or the difference between the daily opening and closing prices of a share of stock.
Here you have a timeline with a bar price change. In seconds you can see if the selected market has good and high price changes or not.
The values are in percentage and you have a limiter in the settings, so you can show only bar/values above a value. Ex. 2.4%.
Why it Matters:
Price changes are a core component of financial analysis, and predicting price changes can be as, if not more, important than an actual price change.
It is important to remember, however, that percent-based price changes are useful only in the context of the number of dollars involved.
A 75% change in the price of a company X, for example, may only involve a few dollars while a 75% change in the price of company Y may involve thousands of dollars.
Settings:
Show the SMA 21 line
Minimum Limit - Set the minimum value to show a bar
Calculation:
For example, let's say Company XYZ shares opened at $25 this morning and closed at $24.
The price change is -$1, or -$1/$25 = -4%.
Any help and suggestions will be appreciated.
Marcos Issler @ Isslerman
ZEC/ETH/XMR/DASH PORTFOLIO KRAKENPortfolio chart with total value.
I will try to optimize it, maybe add % option if I findout how ;p
Or maybe a normalization would be good, idk.
Cheers!
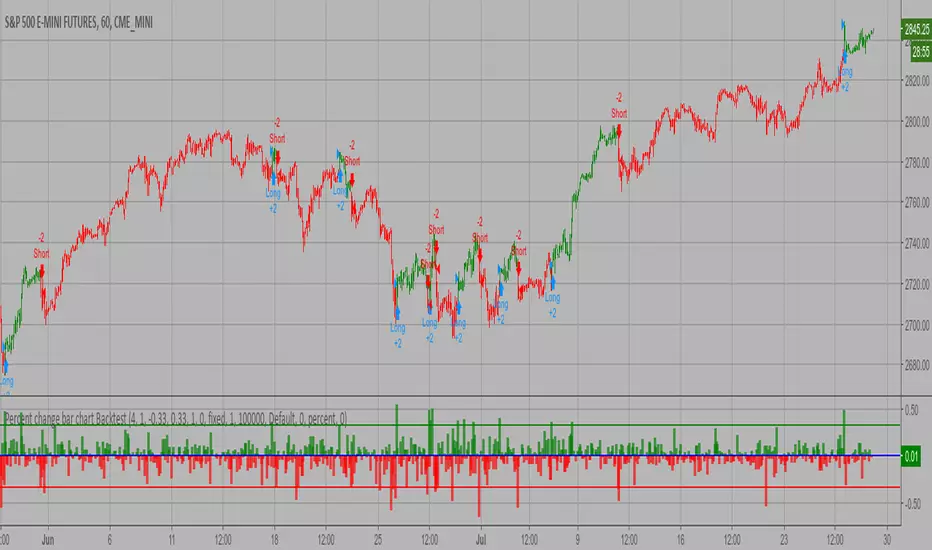
Percent change bar chart Backtest This histogram displays price or % change from previous bar.
You can change long to short in the Input Settings
WARNING:
- For purpose educate only
- This script to change bars colors.
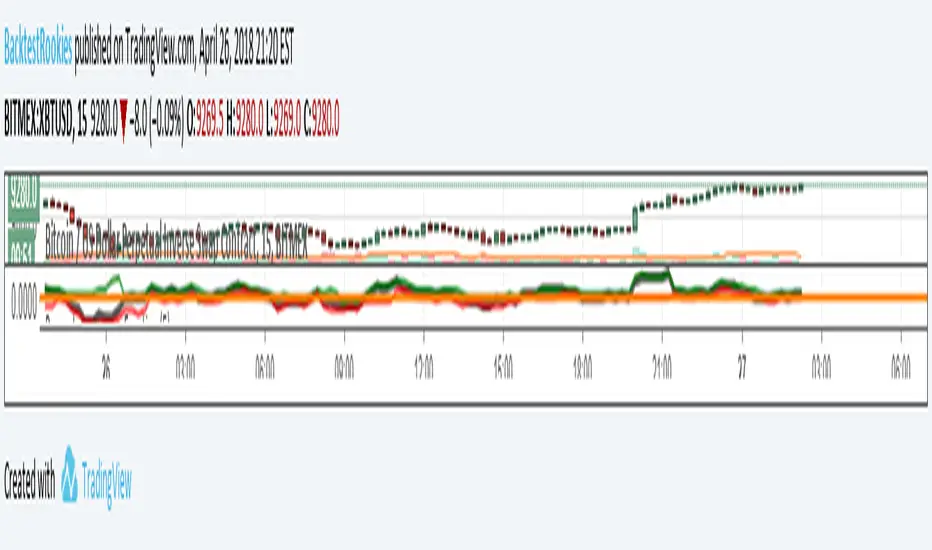
Percentage Change FunctionThis is little code snippet can be copied and pasted into your own strategies and indicators to easily calculate some interesting percentage change levels within a given lookback period.
The function will return:
The price change from the start to the end of the period
The price change from the start of the period to the highest point within the period
The price change from the start of the period to the lowest point within the period
It was originally intended to be used in conjunction with other scripts to assist with decision making. However, it doesn't look too bad as an indicator and so plots have been added.
For more information regarding the code, some commentary and free tutorials, you can visit the Bactest-Rookies (.com) website.