Standard Deviation Lines v1.0Overview
The Standard Deviation Lines v1.0 indicator is designed to provide a statistical approach to market volatility by plotting multiple standard deviation levels based on price action. This tool helps traders identify key price levels where the market may experience significant reactions, making it useful for trend analysis, support/resistance identification, and volatility-based trading strategies.
Key Features
✅ Dynamic Standard Deviation Levels: Calculates and plots up to ±3 standard deviation levels, giving traders a clear view of price dispersion and potential overbought/oversold areas.
✅ Quadrant-Based Deviation Zones: Divides standard deviation ranges into smaller, meaningful levels (e.g., 0.214, 0.382, 0.50, 0.618, 0.786) for a granular analysis of price movements.
✅ VIX Integration for Volatility Adjustment: Incorporates CBOE:VIX to dynamically adjust standard deviation levels based on market volatility.
✅ Weekly vs. Daily Mode: Users can toggle between weekly and daily standard deviation calculations to adapt to different trading strategies.
✅ Auto-Updating Levels: The indicator refreshes at market close (17:00), ensuring traders work with the latest price data.
✅ Customizable Display: Uses color-coded lines to differentiate between positive and negative deviations, with dashed lines for mid-levels and key support/resistance areas.
How to Use
📌 Trend & Volatility Analysis – Higher standard deviation levels indicate strong price movements, helping traders assess trend strength and market volatility.
📌 Reversal & Continuation Signals – Prices reaching extreme standard deviation levels (±2 or ±3) may suggest potential reversals or breakouts.
📌 Support & Resistance Zones – The quadrant-based deviation zones help identify hidden support/resistance areas where price may react.
📌 Risk Management – Traders can use standard deviation bands to set stop-loss and take-profit levels based on statistical price dispersion.
Best For
🔹 Day traders & swing traders looking to incorporate volatility-based strategies.
🔹 Mean reversion traders who capitalize on price returning to statistical averages.
🔹 Momentum traders who want to confirm trend strength and continuation.
Try the Standard Deviation Lines v1.0 now and enhance your market analysis with a statistical edge!
Profittarget
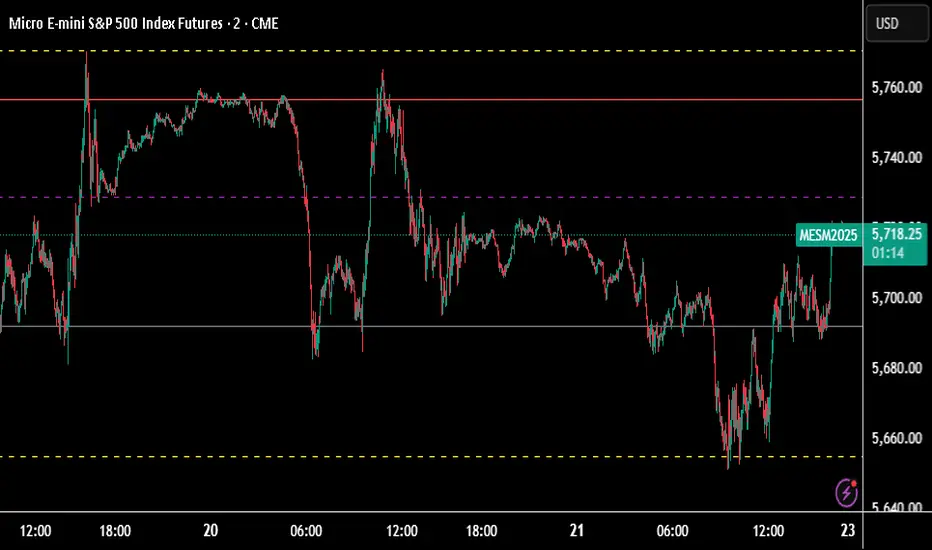
Profitability Visualization with Bid-Ask Spread ApproximationOverview
The " Profitability Visualization with Bid-Ask Spread Approximation " indicator is designed to assist traders in assessing potential profit and loss targets in relation to the current market price or a simulated entry price. It provides flexibility by allowing users to choose between two methods for calculating the offset from the current price:
Bid-Ask Spread Approximation: The indicator attempts to estimate the bid-ask spread by using the highest (high) and lowest (low) prices within a given period (typically the current bar or a user-defined timeframe) as proxies for the ask and bid prices, respectively. This method provides a dynamic offset that adapts to market volatility.
Percentage Offset: Alternatively, users can specify a fixed percentage offset from the current price. This method offers a consistent offset regardless of market conditions.
Key Features
Dual Offset Calculation Methods: Choose between a dynamic bid-ask spread approximation or a fixed percentage offset to tailor the indicator to your trading style and market analysis.
Entry Price Consideration: The indicator can simulate an entry price at the beginning of each trading session (or the first bar on the chart if no sessions are defined). This feature enables a more realistic visualization of potential profit and loss levels based on a hypothetical entry point.
Profit and Loss Targets: When the entry price consideration is enabled, the indicator plots profit target (green) and loss target (red) lines. These lines represent the price levels at which a trade entered at the simulated entry price would achieve a profit or incur a loss equivalent to the calculated offset amount.
Offset Visualization: Regardless of whether the entry price is considered, the indicator always displays upper (aqua) and lower (fuchsia) offset lines. These lines represent the calculated offset levels based on the chosen method (bid-ask approximation or percentage offset).
Customization: Users can adjust the percentage offset, toggle the bid-ask approximation and entry price consideration, and customize the appearance of the lines through the indicator's settings.
Inputs
useBidAskApproximation A boolean (checkbox) input that determines whether to use the bid-ask spread approximation (true) or the percentage offset (false). Default is false.
percentageOffset A float input that allows users to specify the percentage offset to be used when useBidAskApproximation is false. The default value is 0.63.
considerEntryPrice A boolean input that enables the consideration of a simulated entry price for calculating and displaying profit and loss targets. Default is true.
Calculations
Bid-Ask Approximation (if enabled): bidApprox = request.security(syminfo.tickerid, timeframe.period, low) Approximates the bid price using the lowest price (low) of the current period. askApprox = request.security(syminfo.tickerid, timeframe.period, high) Approximates the ask price using the highest price (high) of the current period. spreadApprox = askApprox - bidApprox Calculates the approximate spread.
Offset Amount: offsetAmount = useBidAskApproximation ? spreadApprox / 2 : close * (percentageOffset / 100) Determines the offset amount based on the selected method. If useBidAskApproximation is true, the offset is half of the approximated spread; otherwise, it's the current closing price (close) multiplied by the percentageOffset.
Entry Price (if enabled): var entryPrice = 0.0 Initializes a variable to store the entry price. if considerEntryPrice Checks if entry price consideration is enabled. if barstate.isnew Checks if the current bar is the first bar of a new session. entryPrice := close Sets the entryPrice to the closing price of the first bar of the session.
Profit and Loss Targets (if entry price is considered): profitTarget = entryPrice + offsetAmount Calculates the profit target price level. lossTarget = entryPrice - offsetAmount Calculates the loss target price level.
Plotting
Profit Target Line: Plotted in green (color.green) with a dashed line style (plot.style_linebr) and increased linewidth (linewidth=2) when considerEntryPrice is true.
Loss Target Line: Plotted in red (color.red) with a dashed line style (plot.style_linebr) and increased linewidth (linewidth=2) when considerEntryPrice is true.
Upper Offset Line: Always plotted in aqua (color.aqua) to show the offset level above the current price.
Lower Offset Line: Always plotted in fuchsia (color.fuchsia) to show the offset level below the current price.
Limitations
Approximation: The bid-ask spread approximation is based on high and low prices and may not perfectly reflect the actual bid-ask spread of a specific broker, especially during periods of high volatility or low liquidity.
Simplified Entry: The entry price simulation is basic and assumes entry at the beginning of each session. It does not account for specific entry signals or order types.
No Order Execution: This indicator is purely for visualization and does not execute any trades.
Data Discrepancies: The high and low values used for approximation might not always align with real-time bid and ask prices due to differences in data aggregation and timing between TradingView and various brokers.
Disclaimer
This indicator is for educational and informational purposes only and should not be considered financial advice. Trading involves substantial risk, and past performance is not indicative of future results. Always conduct thorough research and consider your own risk tolerance before making any trading decisions. It is recommended to combine this indicator with other technical analysis tools and a well-defined trading strategy.

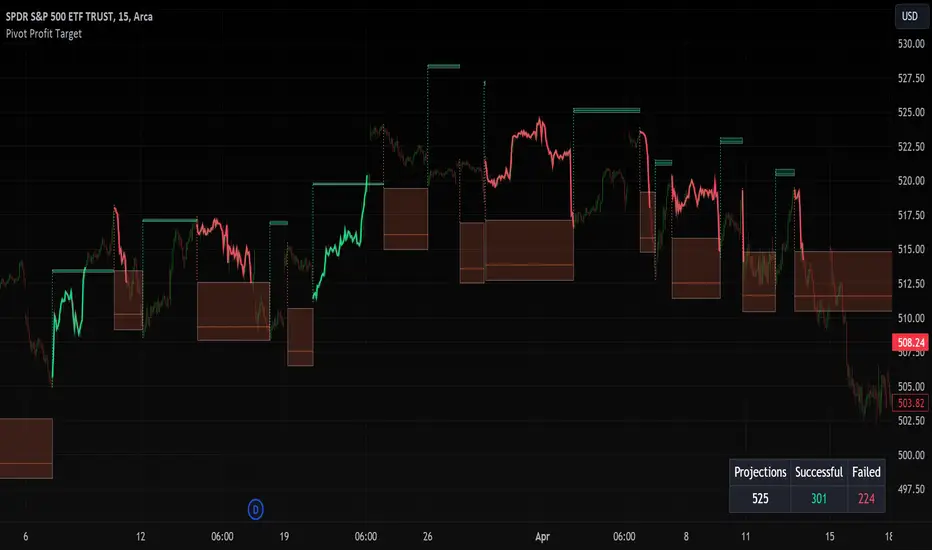
Pivot Profit Target [Mxwll]Introducing the Pivot Profit Target!
This script identifies recent pivot highs/lows and calculates the expected minimum distance for the next pivot, which acts as an approximate profit target.
The image above details the indicator's output.
The image above shows a table consisting of projection statistics.
How to use
The Pivot Profit Targets can be used to approximate a profit target for your trade.
Identify where your entry is relative to the most recent pivot, and assess whether the minimum expected distance for the most recent pivot has been exceeded. Treat the zones as an approximation.
If your trade aligns with the most recent pivot - treat the minimum expected distance zone as a potential profit target area. Of course, price might stop short or continue beyond the projection area!
That's it! Just a short and sweet script; thank you!
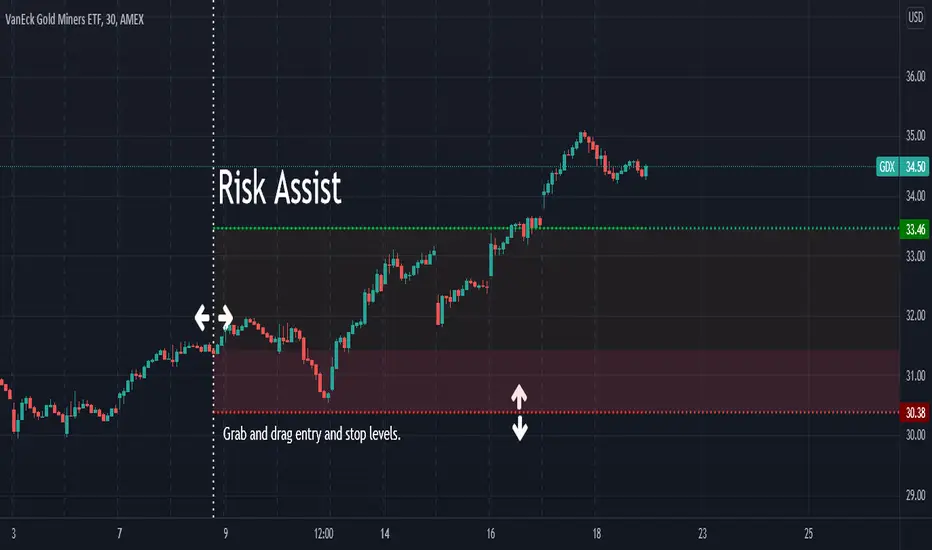
Risk AssistAs the profit level increases, the amount of profit taking required to avoid risk asymptotically reaches zero.
This indicator displays the % of the established position required to exit in order to ensure the trade is not a loss if the stop is hit.
Values in green (at or below 100%) indicate a winning position.
Values in red (above 100%) indicate a losing position.
Alert Examples:
If you are intent on "selling half" to avoid risk, you can set an alert on the value of this indicator for 50.
If you are intent on "selling a 3rd" to avoid risk, you can set an alert on the value of this indicator for 33.3.
Fear Of Missing Out grid of forex tradingAbstract
This script finds potential safe grids placing limit orders without fear of missing out.
This script computes grids according to power of 1.0025 .
You can reference those price levels for your trading.
Introduction
Grid trading is a popular trading method.
Traders plan several price levels as grids and repeat buying at lower grids and selling at higher grids.
Grids can be round number like multiple of 100 pips.
Grids can also be support and resistance according to price history.
Some traders may think they need to adjust grids to trade.
However, there are several problems in choosing grids.
One problem is rate of change is related and therefore exponential. 20 to 30 is different from 30 to 40.
Another interesting point is there are some special impressing reversal price levels.
Several months ago, I had a question why usdjpy bounced near 108.3 .
After using a calculator, I found that 108.3 = 100 * 1.083 ≒ 100 * pow(1.0025,31) .
1.0025 , as known as 0.25% of change, is a potential stop out zone.
Therefore, we can compute grids and one grid is a little more than 1.0025 times than an another one.
After we finished computing grids, we can consider buy and sell near those grids.
Note that different traders may obtain different grid values.
For example, from 1.0 to 2.0 , it can be splited as 270 grids or 277 grids because pow(1.0025,277)<2 .
Those grids cannot always imply potential reversal points but they can be useful for traders looking for 0.25% profit targets with reducing fearing of buying or selling too early.
Computing grids
This script split from 1.0 to 10.0 into three segments.
One is 1.0 to 2.0 .
The second segment is from 2.0 to 5.0 .
The third segment is from 5.0 to 10.0 .
This script does the same thing for 0.1 to 1.0 , 10.0 to 100.0 , and so on.
For 1.0 to 2.0 and 5.0 to 10.0 , this script split a segment as 270 grids.
For 2.0 to 5.0 , this script split a segment as 360 grids.
The last step is display the next grids to the daily low and daily high.
Maybe also display the grids behind grids shown.
Parameters
x1,x2,x3,x4 : display the next x1,x2,x3,x4 grids to daily high and daily low. 1 means the next grid to daily high and daily low. 2 means the next grid to 1.
x_seg : default 2.0 . This script split from 1.0 to 10.0 into three segments. One is 1.0 to x_seg. The second segment is from x_seg to 10.0/x_seg . The third segment is from 10.0/x_seg to 10.0 .
x_grid1 : how many grids in the first segment
x_grid2 : how many grids in the second segment
x_lowprice : add this number for bigger grid distance. Generally, you don't need this number when trading forex but you may need it in stock trading. For stocks with price between 50 to 100, I recommend you use x_lowprice=100.
Conclusion and suggestions
This script can find potential grids for trading.
If price touches grids usually, we can consider buy and sell after price touches grids.
If price reverses before touching grids usually, we may consider buy and sell before price touches grids.
Those grids can remind us don't buy too much unless the price touches the next grid.
For instruments with less volatility, maybe we need more grids.
For traders with more money, they may also consider more grids for more dedicated range trading to collect more profit.
Reference
Sorry, I forgot them.

Prophit Ninja: Hidden ScrollStay ahead of the markets moves with "Prophit Ninja: Hidden Scroll".
Our legendary senseis have mastered the arts of wielding the Katana and Shuriken over many decades of focused practice and distilled their systems and techniques down to their most vital form- storing their knowledge in this ancient scroll for easy adoption by any ninja practiced enough to be able to decipher it.
═════════════════════════════════════════════════════════════════════════
█ INTERPRETATION
Each sub-indicator in this package can be used as a confirmation tool to check your bias and give you a more informed decision as they all take into account every reading shown and not shown being calculated across all Prophit Ninja packages. A sentiment rating below the candle shows bullish bias while a green color emphasizes bullish strength- a sentiment rating above the candle shows bearish bias while a red color emphasizes bearish strength- gold color signifies a strong turn in the market while grey/dark grey is a weak reading. A green trend sensei reading is bullish- while a red trend sensei reading is bearish. A green bull trade sensei label signifies a possible bullish trade set up, while a red bear label trade sensei signifies a possible bearish trade set up. Stat sensei gives you tick by tick multi-time frame readings to always keep you aware of the exact environment you're in. Lastly risk sensei will give you the most optimal least risk trade set-up based on user defined variables and give you tick by tick readings of your trade status. This can be used as a standalone decision-maker, or used in confluence with other indicator packages in our Prophit Ninja bundle to get higher precision.
═════════════════════════════════════════════════════════════════════════
█ OVERVIEW
1 — Sentiment Sensei: A toggle-able tick by tick rating system (0-100%) for each candle based on over 100 individual readings .
2 — Trend Sensei: A toggle-able background coloring that easily shows you the trend bias behind the moves.
3 — Trade Sensei: A toggle-able trade finder that finds confluent trade set-ups to give you the upper hand.
4 — Stat Sensei: A toggle-able multi-time frame candle progress tracker with a built in trend bias and price/volume/momentum change/ratio trackers.
5 — Risk Sensei: A toggle-able risk manager with two variations of auto profit target zones , three variations of trailing stop losses , a win/loss tracker , trade duration timer and all the information you need to stay updated with the status of your trade at a glance whether long or short.
═════════════════════════════════════════════════════════════════════════
█ EASY CUSTOMIZATION
i.imgur.com
With a fully customizable and easy-to-use input menu , this indicator gives you the ability to tailor your trading experience to your needs and see as much (or as little) information as you want to; presented in the manner you deem most viable with the following options in just a few clicks:
Indicator Package- This option allows you to switch between the four display modes available so in any moment you can completely change the metrics you’re reading in just two clicks. This allows you the ability to make decisions based on not only what you’re comfortable with; but also to find confirmation or disagreement with other systems instantly.
Color Theme- There are four color themes available which include original, colorful, monochrome and solid. These not only allow you a quick and easy way to change the colors to suit your style; they also make it so you can challenge your bias in an instant by viewing the data in a completely different way.
Dual Attack Modes- Whether you’re a scalper, day trader, swing trader, or investor; this option allows you to see the chart based on four different risk tolerance/time expectancy mentalities for the Katana and Shuriken separately in just two clicks. Investors can see what the scalpers are thinking and vice/versa to broaden their decision making and/or hone in when optimal.
Dual Sharpness Levels- This algorithm allows the user to display the data on five different smoothness levels for the Katana and Shuriken separately without suffering the inherent lag that accompanies most other indicators. Whether you like to see every tick of a choppy movement, or filter out the false signals into smooth readings, you can do so at any moment.
═════════════════════════════════════════════════════════════════════════
█ RISK SENSEI EXAMPLE
═════════════════════════════════════════════════════════════════════════
█ PRE-BUILT ALERTS
With Prophit Ninja: Hidden Scroll's built-in alerts you can enable alerts for any piece of the Hidden Scrollin just a few clicks. These alerts are way more specific and optimized than you can possibly achieve with the custom alert settings. Each checking for multiple possible activation triggers instead of one and populating the message field automatically so you can just click create.
═════════════════════════════════════════════════════════════════════════
As you can see; this ancient scroll has the ability to adapt to any reader or adversary and give those in control of its power the upper hand. Any mode of battle, any opponent, any circumstance- 'Prophit Ninja: Hidden Scroll' was polished by our finest artists to inform any reader and make sure they know when to attack, defend or simply allow the fight to play out by its easy-to-read coloring system. As long as you learn the techniques you'll have a much better chance of making the right decision than when you didn't.
This state-of-the-art tool is great for experienced traders, those who just started learning to trade, or anyone in between- truly made to suit the needs of any trader, in any moment, with any mindset (along with the other indicators in our Prophit Ninja bundle) you'll notice an immediate improvement in your market dexterity after learning it.
═════════════════════════════════════════════════════════════════════════
*everything displayed is part of the Prophit Ninja indicator bundle; this is an otherwise blank chart*

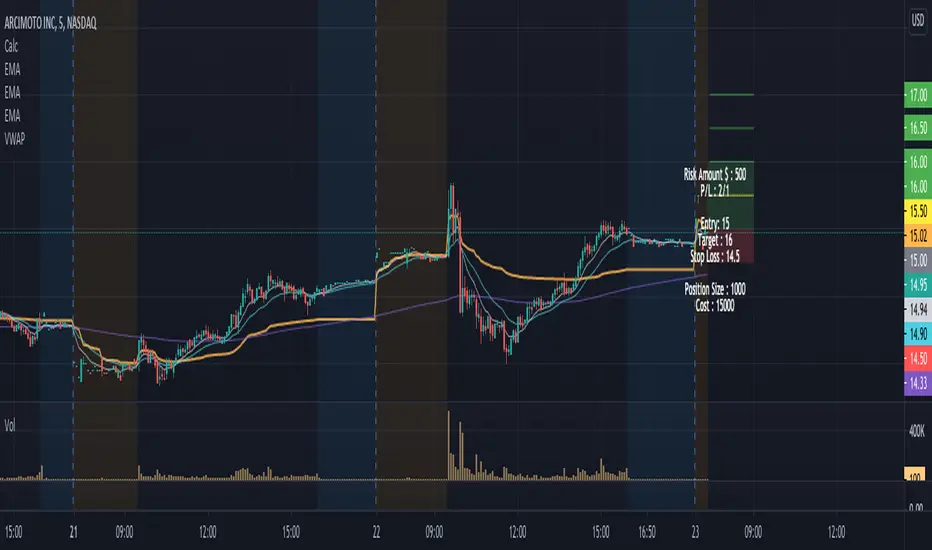
Position Size Calculator w/ profit targetsThis script helps the user visualize profit targets and calculates position size based on the input risk amount.
Input variables:
- Risk amount
- Entry price
- Stop loss amount
- Profit target amount
Calculated variables:
- Profit loss ratio
- Position size
- Postion cost
Plotted variables:
- shaded: entry price --> price target (green filled)
- shaded: entry price --> stop loss target (red filled)
- 1:1 p/l ratio --> yellow line
- 2:1, 3:1, 4:1 p/l ratios --> green lines
Overlay text can be toggled on/off in parameter input section
GMS: Mean Reversion StrategyThis is based on my GMS: Mean Reversion Indicator ()
Features:
- % Based Profit Target and Stop Loss
- SMA Trend Filter
- Can choose trade exit based off a moving average or linear regression curve
- Filter for long only trades, short only trades, or both at the same time.
Source code is open, so feel free to take a look!
I hope it helps,
Andre
