EMA Cross Pullback For M5 timeframe chart.
Best combine with MACD.
Stop Loss slightly below/above ema50.
Pullbacktrade

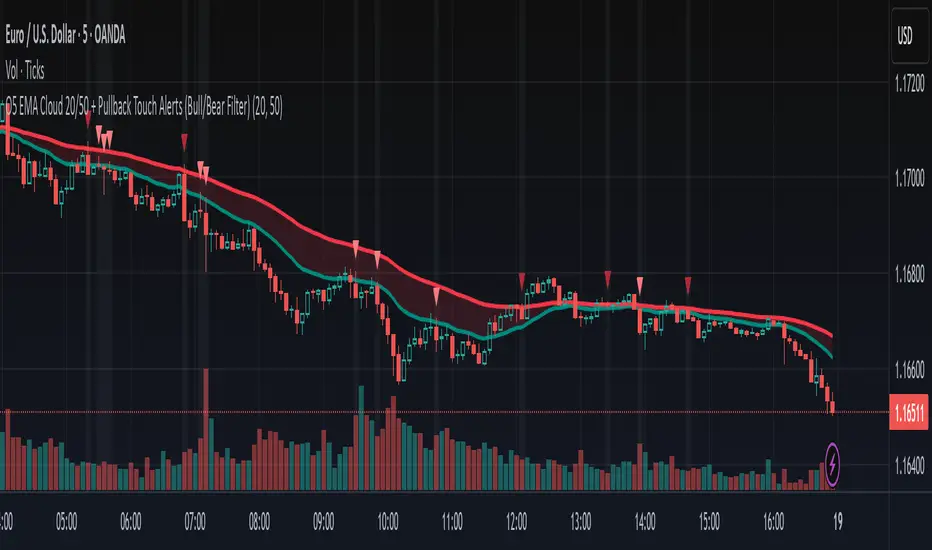
O5 EMA Cloud 20/50 + Pullback Touch Alerts (Bull/Bear Filter)This indicator shows an EMA cloud that is set to Fast=20 and Slow=50 by default, but can be changed.
It features suggested entry signals when price pulls back to either EMA level in both uptrends and downtrends.
Buy signals print only when price pulls back to one of the EMA levels and closes up.
Bearish signals only print when price pulls back to one of the EMA levels and closes down.
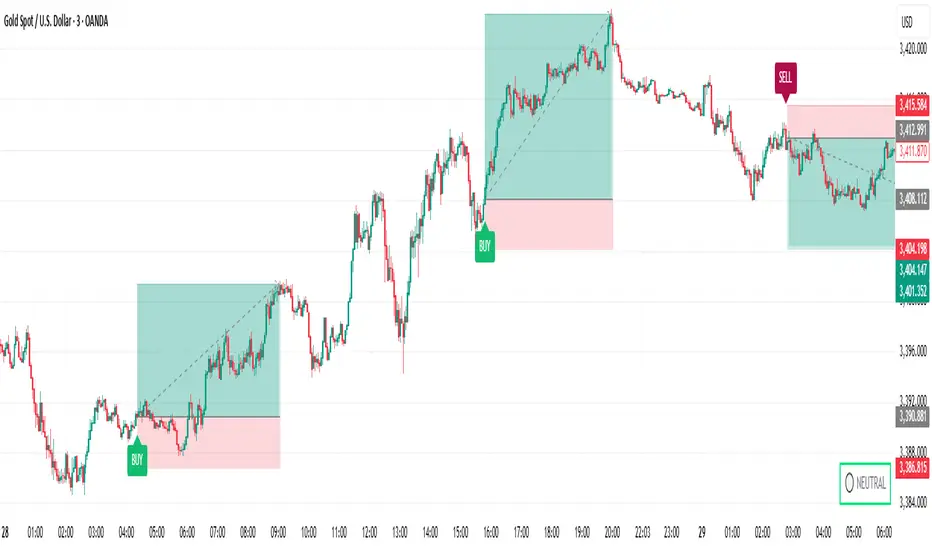
Trade AliThe Trade Ali indicator is designed to identify the continuation of market trends after a correction or pullback. Its core logic combines multiple layers of trend analysis with noise reduction techniques to provide clearer and more reliable trading signals.
🔹 Core Mechanism
Price data is first filtered using a smoothing method that reduces short-term noise. This ensures that the main direction of the market becomes more visible and traders are not misled by minor fluctuations.
🔹 Multi-Timeframe Trend Analysis
The indicator evaluates both short-term and long-term market structures. When both perspectives align in the same direction, it increases the probability of a stronger trend continuation. This multi-layer approach helps avoid false entries.
🔹 Detection of Key Shifts
In addition to tracking the overall trend, the indicator also identifies critical changes in momentum and balance between buyers and sellers. These moments often occur right after a pullback and usually mark the start of a new wave in the dominant direction.
🔹 Entry & Exit Signals
When all necessary conditions are confirmed, the indicator plots buy or sell labels on the chart. These signals typically appear around the end of a correction and the beginning of the next impulsive move.
🔹 Overall Trend Status
Besides the individual signals, the indicator displays the general market condition (bullish, bearish, or neutral) in a visual format on the chart. This gives traders a quick overview of the bigger picture.
✅ Summary
The Trade Ali indicator is built for traders who want to capture trend continuation opportunities after corrections or pullbacks. By combining multiple confirmation layers and filtering out market noise, it focuses on providing cleaner, more meaningful signals that highlight stronger market conditions.
EMA+ATR Band MTF Trend EntryThis is a Multi-Timeframe Trend Trading indicator strategy adapted from Sahil Rohmehtra’s Mentorship programme. The trading decision is made by first accessing the trend in higher timeframe (say Monthly) by using TWO EMAs. If the faster EMA (say 20 period) is above Slower EMA (say 50 period) and the price is above slower EMA then the trend is suitable for buyers. Similarly if faster EMA is below slow EMA and the price is below that then trend is suitable for sellers.
Once we access the trend in the higher timeframe we move to the lower timeframe (say Weekly) and access the 5-period RSI value. If RSI is below 30 then we can prepare for possible buy entry in lower (Daily) timeframe if entry conditions are met in daily timeframe. Similarly sell bias can be initiated when the higher timeframe EMA trend is down, daily RSI is above 70 and sell entry condition is met in daily timeframe. The RSI thresholds can be changed by the user.
Once we identified the RSI bias then wait for the confirmation candle in the lower timeframe (say 1 hour). In the entry timeframe we plot a band of 20 EMA of LOWs ± 1 ATR lines. Here,we wait for a candle to close above the 20 EMA of LOWs + 1 ATR for a buy signal with an increase in On Balance Volume (OBV) value. Similarly for sell signal we should get a candle close below the 20 EMA of LOWs - 1 ATR with corresponding change in OBV. This candle is the signal candle.
Once we get a Buy or Sell signal the corresponding stop loss is the nearest LOW - 1 ATR or HIGH + 1 ATR. The ATR scaling may be changed by the user. Now if another candle closes above the high of the buy signal candle then enter on buy. If the low of the buy signal candle is broken then it is a potential short-term sell entry. Similarly if another candle closes below the sell signal candle then enter short and if there is a close above high of the signal candle then it is a potential buy entry.

Stock Scanner - 38 AssetsPullback Scanner and Trading Strategy:
The Scanner's Purpose:
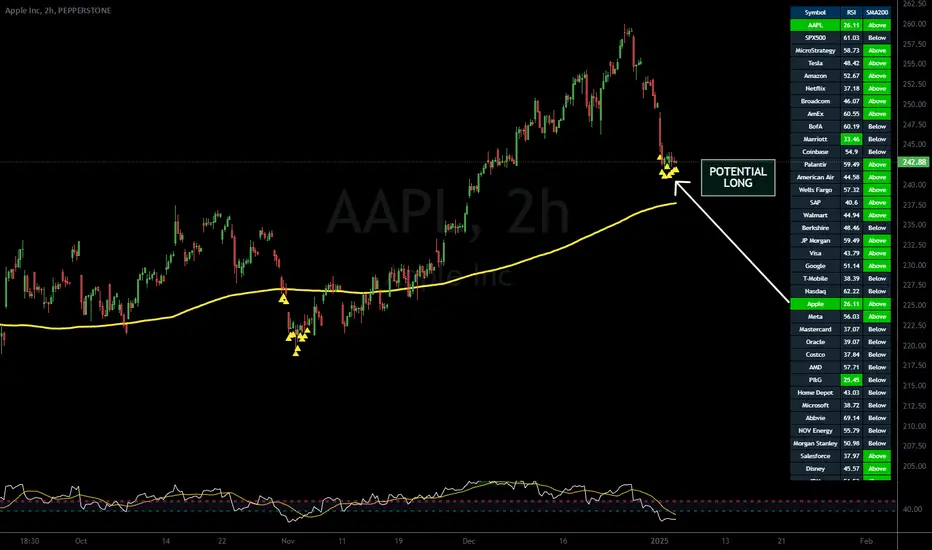
This tool helps identify stocks and futures from a set-list that are in a strong uptrend (above 200 SMA) but experiencing a temporary pullback (RSI below 38), creating potential buying opportunities.
Load 38 Favourite Stocks. They need to be bullish ie: Trading usually above 200 SMA. A drop down switch lets you choose which group. You can find suitable stocks using the filter at FINVIZ:
use on 4hr Timeframes and Above
You must use this on at least the 4hr timeframe, otherwise the 200SMA is not truly placed correctly and a valid trade depends upon the price action being ABOVE the 200SMA.
finviz.com
Key Components:
200 Simple Moving Average (SMA)
Acts as a trend filter
Price above 200 SMA indicates a long-term uptrend
Helps avoid trading against the main trend
Relative Strength Index (RSI)
Set to 38 as the oversold threshold
Identifies temporary weakness in strong trends
Acts as the pullback confirmation. You could add an RSI indicator to the chart for monitoring.
Visual Signals:
Green row: Indicates both conditions are met (price > 200 SMA and RSI < 38)
Yellow triangle: Appears at price bottom when RSI drops below 38
Yellow 200 SMA line: Shows the trend direction and potential support
Trade Setup:
First Requirement: Price must be trading above the 200 SMA
Second Requirement: Wait for RSI to drop below 38
Entry Trigger: When both conditions align (row turns green)
Risk Management: Set stop loss below recent swing low
Exit: When RSI moves above 53 or price crosses below 200 SMA
The scanner monitors multiple instruments simultaneously, allowing traders to identify setups across different markets without manually checking each chart. When a row turns green, that instrument deserves closer attention for potential trade setup.
Example Trade:
Looking at the chart of Apple (AAPL), the yellow triangles show where RSI dropped below 38 while price remained above the rising 200 SMA, providing multiple long entry opportunities in an established uptrend. Actually Apple may be better with RSI below 26.
If you use ctrader, I have made a cbot version of this to automatically take trades on the ctrader platform: eg: XAUUSD i.postimg.cc
Multi Fibonacci Supertrend with Signals【FIbonacciFlux】Multi Fibonacci Supertrend with Signals (MFSS)
Overview
The Multi Fibonacci Supertrend with Signals (MFSS) is an advanced technical analysis tool that combines multiple Supertrend indicators using Fibonacci ratios to identify trend directions and potential trading opportunities.
Key Features
1. Fibonacci-Based Supertrend Levels
* Factor 1 (Weak) : 0.618 - The golden ratio
* Factor 2 (Medium) : 1.618 - The Fibonacci ratio
* Factor 3 (Strong) : 2.618 - The extension ratio
2. Visual Components
* Multi-layered Trend Lines
* Different line weights for easy identification
* Progressive transparency from Factor 1 to Factor 3
* Color-coded trend directions (Green for bullish, Red for bearish)
* Dynamic Fill Areas
* Gradient fills between price and trend lines
* Visual representation of trend strength
* Automatic color adjustment based on trend direction
* Signal Indicators
* Clear BUY/SELL labels on chart
* Position-adaptive signal placement
* High-visibility color scheme
3. Signal Generation Logic
The system generates signals based on two key conditions:
* Primary Condition :
* BUY : Price crossunder Supertrend2 (Factor 1.618)
* SELL : Price crossover Supertrend2 (Factor 1.618)
* Confirmation Filter :
* Signals only trigger when Supertrend3 confirms the trend direction
* Reduces false signals in volatile markets
Technical Details
Input Parameters
* ATR Period : 10 (default)
* Customizable for different market conditions
* Affects sensitivity of all Supertrend levels
* Factor Settings :
* All factors are customizable
* Default values based on Fibonacci sequence
* Minimum value: 0.01
* Step size: 0.01
Alert System
* Built-in alert conditions
* Customizable alert messages
* Real-time notification support
Use Cases
* Trend Trading
* Identify strong trend directions
* Filter out weak signals
* Confirm trend continuations
* Risk Management
* Multiple trend levels for stop-loss placement
* Clear entry and exit signals
* Trend strength visualization
* Market Analysis
* Multi-timeframe analysis capability
* Trend strength assessment
* Market structure identification
Benefits
* Reliability
* Based on proven Supertrend algorithm
* Enhanced with Fibonacci mathematics
* Multiple confirmation levels
* Clarity
* Clear visual signals
* Easy-to-interpret interface
* Reduced noise in signal generation
* Flexibility
* Customizable parameters
* Adaptable to different markets
* Suitable for various trading styles
Performance Considerations
* Optimized code structure
* Efficient calculation methods
* Minimal resource usage
Installation and Usage
Setup
* Add indicator to chart
* Adjust parameters if needed
* Enable alerts as required
Best Practices
* Use with other confirmation tools
* Adjust factors based on market volatility
* Consider timeframe appropriateness
Backtesting Results and Strategy Performance
This indicator is specifically designed for pullback trading with optimized risk-reward ratios in trend-following strategies. Below are the detailed backtesting results from our proprietary strategy implementation:
BTCUSDT Performance (Binance)
* Test Period: Approximately 7 years
* Risk-Reward Ratio: 2:1
* Take Profit: 8%
* Stop Loss: 4%
Key Metrics (BTCUSDT):
* Net Profit: +2,579%
* Total Trades: 551
* Win Rate: 44.8%
* Profit Factor: 1.278
* Maximum Drawdown: 42.86%
ETHUSD Performance (Binance)
* Risk-Reward Ratio: 4.33:1
* Take Profit: 13%
* Stop Loss: 3%
Key Metrics (ETHUSD):
* Net Profit: +8,563%
* Total Trades: 581
* Win Rate: 32%
* Profit Factor: 1.32
* Maximum Drawdown: 55%
Strategy Highlights:
* Optimized for pullback trading in strong trends
* Focus on high risk-reward ratios
* Proven effectiveness in major cryptocurrency pairs
* Consistent performance across different market conditions
* Robust profit factor despite moderate win rates
Note: These results are from our proprietary strategy implementation and should be used as reference only. Individual results may vary based on market conditions and implementation.
Important Considerations:
* The strategy demonstrates strong profitability despite lower win rates, emphasizing the importance of proper risk-reward ratios
* Higher drawdowns are compensated by significant overall returns
* The system shows adaptability across different cryptocurrencies with consistent profit factors
* Results suggest optimal performance in volatile crypto markets
Real Trading Examples
BTCUSDT 4-Hour Chart Analysis
Example of pullback strategy implementation on Bitcoin, showing clear trend definition and entry points
ETHUSDT 4-Hour Chart Analysis
Ethereum chart demonstrating effective signal generation during strong trends
BTCUSDT Detailed Signal Example (15-Minute Scalping)
Close-up view of signal generation and trend confirmation process on 15-minute timeframe, demonstrating the indicator's effectiveness for scalping operations
Chart Analysis Notes:
* Green and red zones clearly indicate trend direction
* Multiple timeframe confirmation visible through different Supertrend levels
* Clear entry signals during pullbacks in established trends
* Precise stop-loss placement opportunities below support levels
Implementation Guidelines:
* Wait for main trend confirmation from Factor 3 (2.618)
* Enter trades on pullbacks to Factor 2 (1.618)
* Use Factor 1 (0.618) for fine-tuning entry points
* Place stops below the relevant Supertrend level
Footnotes:
* Charts provided are from Binance exchange, using both 4-hour and 15-minute timeframes
* Trading view screenshots captured during actual market conditions
* Indicators shown: Multi Fibonacci Supertrend with all three factors
* Time period: Recent market activity showing various market conditions
Important Notice:
These charts are for educational purposes only. Past performance does not guarantee future results. Always conduct your own analysis and risk management.
Disclaimer
This indicator is for informational purposes only. Past performance is not indicative of future results. Always conduct proper risk management and due diligence.
License
Open source under MIT License
Author's Note
Contributions and suggestions for improvement are welcome. Please feel free to fork and enhance.

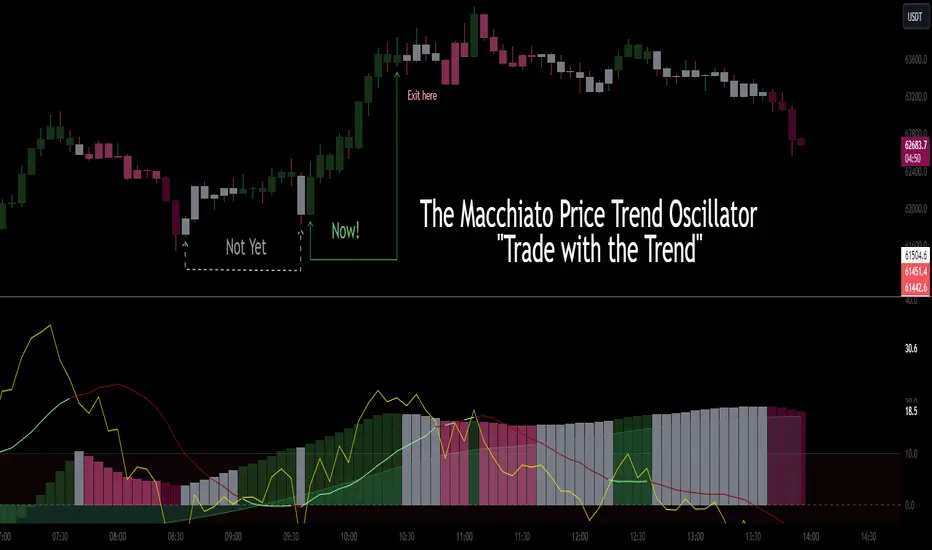
CSC_Macchiato Price Trend Oscillator by CoffeeShopCryptoDescription:
Introducing "The Macchiato" – your go-to indicator in the realm of trading, meticulously crafted by CoffeeShopCrypto. Much like the complex flavors of a well-made Macchiato, this tool offers a robust suite of functionalities designed to enhance your trading experience across Forex, stocks, and cryptocurrencies.
The Macchiato stands out for its distinct ability to confirm market trends, identify building momentum, and navigate through periods of market stalls. Drawing cues from the RSI (Relative Strength Index), its color scheme dynamically reflects the shifts in market forces, providing traders with real-time insights into price action dynamics.
Gone are the days of navigating through market uncertainties blindly. With The Macchiato at your disposal, you gain a more clear understanding of market movements, helping you to make informed decisions with confidence. Whether you're a seasoned trader or just starting out, this indicator adds more confluence to your trading strategy, ensuring that you stay ahead of the curve in today's fast-paced trading environment.
So, say goodbye to guesswork and hello to precision trading with The Macchiato – where real-time data analysis meets actionable insights, all in the quest for trading success.
----------------------------------------------------
The Histogram:
The Macchiato Histogram gives you a representation of current change in closing values against the closing values within a "Range" of the lookback period. It calculates your price ranging extremes of the highest high vs lowest low according to your lookback setting. Then it shows you whether the momentum of these closing prices calculated against the highs or the lows is either rising or falling. It takes into account the difference in the highs, lows, open and closing prices as a whole. This helps to determine the actual trend of your market structure.
Histogram Rising / Falling:
The Histogram of the Macchiato doesn't care about being above or below zero. Since we are simply calculating momentum rising or falling, then we only care that the histogram is rising or falling. Especially when it's doing this in line with our Macchiato Average.
Macchiato Average:
Included is a smoothing line called "the Macchiato Average"
Using the average is just like using a moving average against price action, however here we are using one against momentum to determine whether price is moving against, with, better, or worse than the current average of momentum.
The RSI:
The base purpose of the RSI in this tool is mainly to color the columns of the Histogram.
I gave you the benefit of exposing the RSI so you can see where it lies in the oscillator for any additional strategies you may use.
How the RSI Colors the Histogram:
The Histogram has 4 momentum colors and 1 non-momentum color.
They are described below but here we will understand why they exist the way they do against the RSI positioning.
The 4 momentum colors:
You can have the RSI in 4 different positions against its moving average.
Trend Trading Colors and setups:
Strong Long - RSI above zero and above its average is a strong long trend.
Strong Short - RSI below zero and below its average is a strong short trend.
These can also be seen as breakout indications.
Counter Trend Trading and Setups:
Weak Long - RSI above zero and below its average is a weak long trend.
Weak Short - RSI below zero and above its average is a weak short trend.
(Only trade weak momentum to known internal support and resistance areas.)
You'll notice that when the RSI is set up against its RSI Moving average under these conditions, the Histogram is colored accordingly to tell you whether you have strong or weak momentum.
For these colors to appear accordingly, the RSI and the momentum of the histogram must be moving in the same direction as each other.
The 5th color of the Histogram:
(GRAY)
This is where there is a divergence / disagreement between your RSI setup and the momentum being observed. If momentum is moving one way and the force of the RSI is not matching the overall momentum, you have a divergence. This commonly means that higher timeframe momentum is in disagreement to lower or current timeframe closing momentum changes.
Conditions of a Bullish Trending Market:
The color scheme has specific implications when all columns are above zero.
As noted before, the Macchiato doesn't care that it is above or below zero. It simply needs to be rising or falling. The color scheme is depicted by what the RSI is doing in relation to ZERO and where it lies against its average.
This image helps to differentiate what is happening with momentum when in a strong bullish market.
The color scheme is always the same. You always have 4 conditions of momentum.
According to the default settings:
Strong Long = Dark Green
Weak Long = Light Green
Strong Short = Dark Red
Weak short = Light Red
The final color is GRAY which is standard for a NON directional market.
You can alter the colors as you choose for your chart background and color preference.
Macchiato Bias Line Conditions
The "Bias Line" helps you understand whether your current momentum is traveling into opposing forces or if your momentum is going WITH the bias.
Going against the bias would be like momentum and price action converging against each other.
Going in the same direction would offer much larger movements on price.
Using the Bias to trade
Trading Internal Support and Resistance
Noting previous price action, pivots, and price swings is important in its use.
When you see momentum coming to a halt or changing, note the previous price action that you are approaching. You should see the histogram change its color, telling you where momentum is ending in its current direction.
EXAMPLE BULLISH MARKET FLIP
There is the exception however that when the market flips, from bearish to bullish, you can see the following:
BIAS LINE switches to a Bullish Bias
Histogram is showing Strong Long Color
Histogram stays ahead of the BIAS line
Price should break previous swing highs to create new highs.
Strategy you can use in observance. (short pause, to pullback, to continued short)
If the momentum is rising while RSI is falling you'll have gray columns until the RSI is in the correct positions against its average.
For your trend to continue downward you are looking for dark red or "Strong Short" columns.
When there is a disagreement, your columns will be gray and then switch to weak long. (Light Green)
This is because your RSI is above its average while the RSI is bearish.
This light green area can be observed as the pullback area.
If you only want to trade short, you would wait for the pullback to be complete.
This occurs when the weak long changes back to gray and then strong short, or skipping gray into strong short.
Market Crashes/Chart Timeframes HighlightThis extremely helpful indicator allows you to highlight 7 custom date-based timeframes on your charts.
The default dates selected are what I consider to be the most significant 7 most recent market declines, including and since the 87 flash crash.
Note: The default dates are approximate but good enough to highlight the key timeframes of these pullbacks/crashes/corrections.
It's simple to use and does exactly what it should.
I created this indicator to make it easier when looking at the overall story of a chart. I found it helpful to highlight these areas to see how a market or equity has responded during these significant market pullbacks.
The highlight alone I’ve found helpful, and it becomes more powerful if you combine it with your own trusted trade system.
Also, to get the most out of using the default dates it’s important to understand the narrative behind each pullback/crash. Here’s the list of what I consider significant pullbacks:
Black Monday - Oct 87
1990s Recession - Jul 90 to Mar 91
Dot Com Bubble - 2000 to 2002 or so
Real Estate 2008 Crisis - I choose 2007-2009 to cover full insider knowledge and aftermath
2016 - 2018 - This isn't seen as a pullback, but I have it as significant because in many markets and equities, this was an almost equal percentage pullback as 2008. See Notes below
2020 Crash - Covid-19 and related shenanigans pullback
April 2021 to August 2022 - I believe we are in a current SHORT cycle so I've highlighted April 2021 as the start of what might be the start of a major decline testing Dot Com or lower levels.
A few notes on the above.
You'll find on most of the pullbacks listed above most equities and related markets behave similarly or have similar patterns.
The 2016-18 pullback is the most difficult to track. For instance, GE in this timeframe had a -80% decline, whereas BA depending on how you want to measure it had a 50-110% gain.

Honest Algo PremiumThis toolkit is a collection of innovative indicators, carefully designed to be as user friendly as possible. Get access to a collection of all the best we can offer in one indicator.
Providing Multiple Trading Styles
Our toolkit works in any market but has been specifically designed for Bitcoin and Forex.
Detect the direction of the trend using an algorithm based on our bounce manager ATR consolidation filtering
Find bounces from a handful of different pre-determined lines, the include a 20 period EMA, a supertrend, a T3 moving average and kijun-sen
Detect Rob Smith #thestrat entries
Filter out noise with our environment filters
and much more. (Check the changelog below for future additions)
If you want more information on how the price action entries of Rob Smith #thestrat work, there are many tutorials on the internet.
When using Rob Smith #thestrat entries the indicator uses bounce manager with a 200 period EMA for trend based bar coloring.
A quick explanation how it finds bounces from these lines:
Filter signals based on timeframe continuity
Timeframe continuity is a method of market analysis where you look if multiple different timeframe charts are in the same direction.
For example:
default settings we are in bull territory when the yearly, the quarterly, the monthly and the weekly candle all are green.
default settings we are in bear territory when the yearly, the quarterly, the monthly and the weekly candle all are red.
We provided multiple presets but it is recommended to use the standard preset, timeframe continuity is the strongest when using higher timeframes.
Filter signals based on market environment
We realised that trading long or short in an environment with no resistances increased our algorithms success rate.
How the algorithm does this:
1: See which timeframes the user has selected as a filter, on default these are:
Needs to be outside timeframe 1 (yearly), false
Needs to be outside timeframe 2 (quarterly), false
Needs to be outside timeframe 3 (monthly), true
2: Check if our closing price is above those timeframes previous candle high or below previous candle low.
This in combination with timeframe continuity gives a great tool to find the sentiment of the market and trade in the direction of the market.
Turn on autopilot using our signals
This tool is not made to do all decisions for you and requires a manager (you). The basic strategy using the #thestrat preset is to scale into positions on the 4H or higher timeframe, whenever a signal is fired you add to your position and as trend keeps developing the tool will keep adding to your positions.
A good manager knows risk management and does not use a very large position size per entry and builds a position over time.
We recommend you use a timeframe of 4H or higher and diversify over multiple assets. The indicator works best on assets that overtime have created long lasting trends.
Examples of perfect coins to use this on.
We know traders love clean looking charts
This is wy we added some popular indicators to our toolkit, these you can find on tradingview for free but we added them into our toolkit using our color theme, you can find these in the settings under (extra tools).
We also added an option to display bounce source, this is the source line some of our signal presets use to find bounces from using preset bounce manager parameter.

Cross 2 Emas + Pullbackhello
it's not financial advice and It's your responsibility to win and lose with this strategy.
also, there is no benefit for publisher at all if you win or lose a trade.
and this strategy is working only in 4h timeframe, and I didn't test or check for other timeframes!
.........
this strategy is based on two EMAS crossing each other and waiting for the price to pull back on fast ema(ema with lower length).
so basically , when EMA 50 crosses up with the EMA 100 , we are looking for a long and waiting for the price to touch the EMA 50.
.........
the Strategy is based on 100% equity because personally I use small budget for each ROBOT(like 100$)
the initial capital = 100$
order size = 100% of equity
commission = 0.1%
trade start time = 2021.1.1
.........
settings
1.Stop loss ATR = (your number * ATR ) + stoploss
2.RR = Risk / Reward
3.ATR length = ATR setting (7,9,14)
4.Emas setting = you can choose the EMA length
for exp : if you want EMA 25 and 75 , fill the fast ema length with 25 and 75 for slow ema length
5.Time : you can tell the strategy to trade from which time to which time
exp : 2021.1.1 to 2022.1.1 or 2019.1.1 to 2021.1.1
6.long or shot : if you deactivate the long , it will trade only short.(same thing for short)(strategy trade both sides by default)
7. you can remove the labels and Table from menu as well
.........
cross
when EMAS cross each other , you will see Dimond shape (as you know you can change the shape and color)
........
Table
when we are in a position , we can see a table like this which shows us the percent and value of the Stop loss and target price.
short
long
........
E/SL/TP
E = Entry Line
SL = Stoploss line
TP = Target Price
(you can also remove labels in setting)
......
my goal is to upgrade this strategy with your ideas.
not financial advice !
please , share your ideas with me to improve the strategy
I would like to see what do you think about this strategy <3
have a great day.

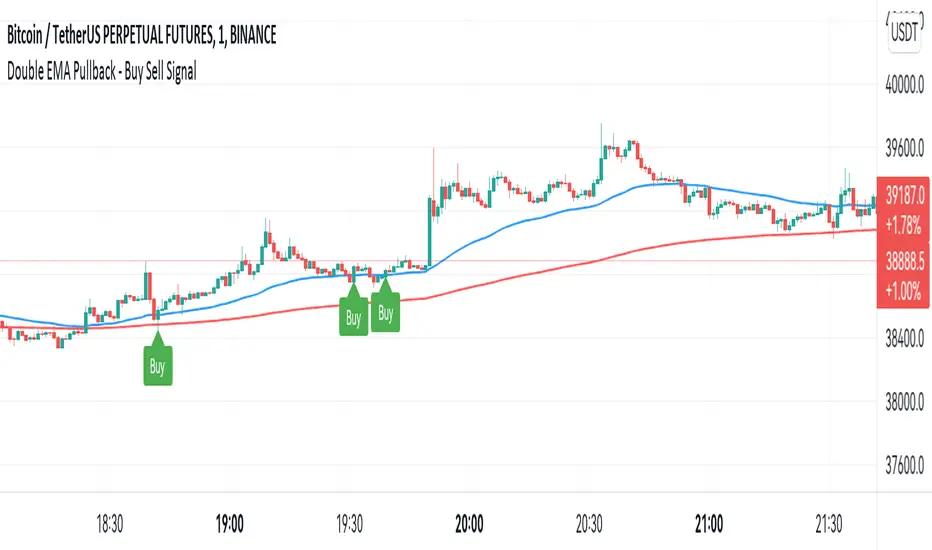
Double EMA WIth Pullback Buy Sell Signal - Smarter AlgoBuilt with love "Double EMA With Pullback Buy Sell Signal "
This indiator will help you to find a Double EMA Pullback Signal
You can combine with your own strategy, or use this purely
DISCLAIMER :
Measure the risk first before use it in real market
Backtest The Strategy was very important, so you know the probability
Fundamentally Logical :
Pullback (Some Previous candle is Red for Bull Pullback vice versa)
the Entry candle must be a Candlestick Pattern
Features :
1. Double EMA
2. Pullback Signal
How to use it :
1. Adjust the Pullback Backstep
2. Adjust the EMA Period
3. Adjust the Style to your preferences
Regards,
Hanabil
Smarter Pullback + Candlestick Pattern (Steven Hart)Built with love "Smarter Pullback + Candlestick Pattern"
This indiator will help you to find a Pullback + Candlestick Pattern, inspirated by Steven Hart
You can combine with your own strategy, or use this purely
DISCLAIMER :
Measure the risk first before use it in real market
Backtest The Strategy was very important, so you know the probability
Fundamentally Logical :
Pullback (Some Previous candle is Red for Bull Pullback vice versa)
the Entry candle must be a Candlestick Pattern
Features :
1. Engulfing
2. Hammer & Shooting Star
3. Doji
How to use it :
1. Adjust the Pullback Period
2. Check and Uncheck the Pattern you want to see
3. Adjust the style to your favourite
Regards,
Hanabil

Swing Trades Validator - The One TraderThis swing trading strategy validator is built on the original strategy taught in my bootcamp for swing traders.
The strategy is simple and follows a trend trading pattern on prices reacting to Exponential Moving Averages over a multiple time-frame analysis.
The details of the strategy are as follows:
- Holding Period : Upto a couple of months
- Time-frames to be analysed : Month - Week - Day
- Trade Execution : Daily Time-frame
Analysis Details:
Step 1 : On the Monthly time-frame, the candle needs to be bullish with the latest close being higher than the opening price of the month.
Step 2 : The price needs to be above the 8ema on the Monthly time-frame.
Step 3 : The 8ema must be above the 20ema on the Monthly time-frame.
The above steps indicate a bullish strength in the instrument on the Monthly time-frame.
Step 4 : On the Weekly time-frame, the candle needs to be bullish with the latest close being higher than the opening price of the week.
Step 5 : The price needs to be above the 8ema on the Weekly time-frame.
Step 6 : The 8ema must be above the 20ema on the Weekly time-frame.
The above steps indicate a bullish strength in the instrument on the Weekly time-frame.
Step 7 : On the Daily time-frame, the candle needs to be bullish with the latest close being higher than the opening price of the day.
Step 8 : The price needs to be above the 8ema on the Daily time-frame.
Step 9 : The 8ema must be above the 20ema on the Daily time-frame.
The above steps indicate a bullish strength in the instrument on the Daily time-frame.
Step 10 : While the 8ema is above the 20ema on the Daily time-frame, the price must be allowed to rise before a pullback is seen towards the moving averages, indicating a bearish move trying to change the trend.
Step 11 : These pullback candles need to form a pattern called the Ring Low with the second pullback candle having a lower high and lower low and the low of the last pullback candle being lesser than or equal to the fat ema on the Daily time-frame.
Step 12 : If the stock is still bullish and the trend is displaying a strength in the underlying bullish direction, then there will be a resumption candle that will have a closing price higher than the previous day's high price.
This trend continuation signal is a confirmation that the instrument will continue in the underlying trend direction and we will be able to enter if this condition is satisfied.
The profit and loss percentages are set at a default 10% as this can be a minimum risk : reward for swing trades on average, but the inputs have been made available to the users in order to adjust the risk : reward to find the most optimum breathing room for each individual stock or instrument. This will give the user a highly custom overview of the strategy on individual instruments based on their volatility and price movements.
The strategy tester will auto back-test this strategy historically and find all the trades that were taken based on this strategy and populate a performance summary.
The most important data in V1.0 of this script are as follows:
1. No. of Trades Taken : We want to see many trades being taken on this strategy in that particular instrument. This shows us a healthy report on the number of winning vs. losing trades.
2. Percentage Profitable : We want to see that this strategy has worked out in the past and is giving us a high probability of return. This in no way an indication that the strategy will definitely work out in the future as well, but gives us an idea of whether or not we should enter this trade.
3. No. of Winning Trades vs. Losing Trades : We would like to see a significantly higher number of winning trades.
4. Avg. # of bars in a trade : This gives us an idea of how long on average we might have to wait to see the results of this strategy either in favor of our reward or against our desired direction. Some trades can be completed in around 15-20 bars on average and some trades have shown to take upto 45 days to reach desired reward. This is in line with our planned holding period, but gives the trader a sense of time and increased level of patience.
The future updates will have more utility of the various elements of the strategy tester and the entire exit strategy will be integrated into the script.
This script is not to be used as a standalone method and must be studied well in order to execute trades. I have not hidden visibility on other time-frames, but since order execution is done on the Daily time-frame, the script must run on the Daily time-frame only.
There are many other factors to be taken into consideration before entering a trade and proper risk management and position sizing rules must be followed.
Our bootcamp participants will use this strategy tester in conjunction with the invite-only Trading Toolkit assigned to them.
The development of this script will be ongoing and all comments and feedback are welcome.

Close to SupertrendMany a times, we have seen that the price closing in towards supertrend reverses.
This indicator gives signal that identifies high / low of any candle if near the down / up supertrend line by a defined margin using arrow signals.
I've simply re-used readily available supertrend indicator source code and just modified it to these signals. So, almost all of the source code is not mine.
Enter the short / long position when arrow signal appears.
SL / trend reversal will be mandatorily at close of a candle above or below the supertrend line, and the supertrend changes direction.
Hope this indicator comes handy for you.

Zigzag Trend/Divergence DetectorPullbacks are always hardest part of the trade and when it happen, we struggle to make decision on whether to continue the trade and wait for recovery or cut losses. Similarly, when an instrument is trending well, it is often difficult decision to make if we want to take some profit off the table. This indicator is aimed to make these decisions easier by providing a combined opinion of sentiment based on trend and possible divergence.
⬜ Process
▶ Use any indicator to find trend bias. Here we are using simple supertrend
▶ Use any oscillator. I have added few inbuilt oscillators as option. Default used is RSI.
▶ Find divergence by using zigzag to detect pivot high/low of price and observing indicator movement difference between subsequent pivots in the same direction.
▶ Combine divregence type, divergence bias and trend bias to derive overall sentiment.
Complete details of all the possible combinations are present here along with table legend
⬜Chart Legend
C - Continuation
D - Divergence
H - Hidden Divergence
I - Indeterminate
⬜ Settings
▶ Zigzag parameters : These let you chose zigzag properties. If you check "Use confirmed pivots", then unconfirmed pivot will be ignored in the table and in the chart
▶ Oscillator parameters : Lets you select different oscillators and settings. Available oscillators involve
CCI - Commodity Channel Index
CMO - Chande Momentum Oscillator
COG - Center Of Gravity
DMI - Directional Movement Index (Only ADX is used here)
MACD - Moving average convergence divergence (Can chose either histogram or MACD line)
MFI - Money Flow Index
MOM - Momentum oscillator
ROC - Rate Of Change
RSI - Relative Strength Index
TSI - Total Strength Index
WPR - William Percent R
BB - Bollinger Percent B
KC - Keltner Channel Percent K
DC - Donchian Channel Percent D
ADC - Adoptive Donchian Channel Percent D ( Adoptive-Donchian-Channel )
▶ Trend bias : Supertrend is used for trend bias. Coloring option color candles in the direction of supertrend. More option for trend bias can be added in future.
▶ Stats : Enables you to display history in tabular format.
Overview of settings present here:
⬜ Notes
Trend detection is done only with respect to previous pivot in the same direction. Hence, if chart has too many zigzags in short period, try increasing the zigzag length or chart timeframe. Similarly, if there is a steep trend, use lower timeframe charts to dig further.
Oscillators does not always make pivots at same bar as price. Due to this some the divergence calculation may not be correct. Hence visual inspection is always recommended.
⬜ Possible future enhancements
More options for trend bias
Enhance divergence calculation. Possible options include using oscillator based zigzag as primary or using close prices based zigzag instead of high/low.
Multi level zigzag option - Can be messy to include more than one zigzag. Option can be added to chose either Level1 or Level2 zigzags.
Alerts - Alerts can only be added for confirmed pivots - otherwise it will generate too many unwanted alerts. Will think about it :)
If I get time, I will try to make a video.

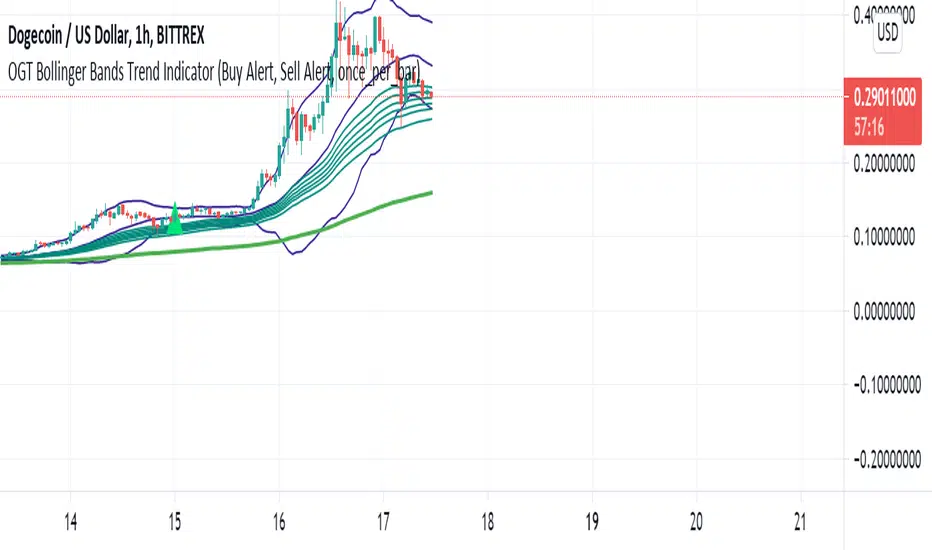
OGT Bollinger Bands Trend IndicatorWhat Is The OGT Bollinger Bands Trend Indicator?
This indicator is a pullback trend trading indicator which uses the following indicators:
- 200 EMA - Long Term Trend Direction
- 30, 35, 40, 45, 50, 60 EMAs - Shorter Term Trend Direction
- Bollinger Bands - Pullback / Entry Signal
How Are Signals Generated?
Buy
- Price above the 200 EMA
- Price touches lower BB with shorter term EMAs all aligned (not crossed)
- Indicator waits for price to close above midpoint BB with shorter term EMAs all still aligned (not crossed)
Sell
- Price below the 200 EMA
- Price touches upper BB with shorter term EMAs all aligned (not crossed)
- Indicator waits for price to close above midpoint BB with shorter term EMAs all still aligned (not crossed)
Alerts function built in, input settings customisable to show/not show indicators and change colours.
Follow the Trend - Trade PullbacksKindly follow the rules stated below for entry, exit and stop loss. Not every Buy / Sell signal will be profitable.
Timeframe of the chart acts as current timeframe. You need to choose 2 more as middle and higher timeframes.
This indicator is based on candlesticks, ATR and CCI indicators and the logic provides buy / sell signals at the pullbacks of the trend depicted by higher timeframe, that must be respected throughout.
Enter the long / short trade respectively when the indicator gives buy / sell signal after price has gone below the green / above the red line for higher timeframe.
Stop loss shall be low / high of recent swing. Exit when the price closes below / above the middle timeframe, to be used as trailing target.
Use it for any instrument for any timeframe of your choice.
For example, check the shared chart. It is a 1 min intraday, but the indicator can be used for short or long term positional trades as well.
Enter long at 14102, with stop loss 14077. Trailing target is achieved at 14156 giving a Risk:Reward ratio of 1:2.
Another Buy signal is observed around same level and uptrend continues till day end, again for a Risk:Reward ratio of approx. 1:2.
Rules to follow for Long trades -
Enter long position at Buy signal given after price has moved below green line of higher timeframe.
Exit the position when price closes below orange / blue line of middle timeframe.
Stop loss must be at low of recent swing, appearing just before the Buy signal.
Rules to follow for Short trades -
Enter short position at Sell signal given after price has moved above red line of higher timeframe.
Exit the position when price closes above orange / blue line of middle timeframe.
Stop loss must be at high of recent swing, appearing just before the Sell signal.

ATR Trend & ATR Top/Bottom (Zeiierman)█ Overview
ATR Trend & ATR Top/Bottom (Zeiierman) blends momentum, volatility, and adaptive trend analysis into a unified framework. It fuses a dynamic oscillator with ATR-based exhaustion detection to identify trend direction, impulses, and potential reversals within the same structure.
Rather than viewing volatility as noise, this tool interprets it as trend expansion, which represents directional conviction, while contraction signals absorption or exhaustion. By combining multi-phase smoothing, adaptive ATR scaling, and contextual trend filtering, the indicator delivers a complete picture of when a market is accelerating, stabilizing, or reversing.
It performs best once a trend has matured and volatility normalizes around a directional core, giving traders the confidence to participate in established moves while dynamically managing risk.
⚪ Why This One Is Unique
Traditional trend oscillators rely on fixed parameters that degrade across assets or timeframes. ATR Trend & ATR Top/Bottom instead employs adaptive weighting and volatility-normalized filtering that automatically aligns with the current market structure.
Its framework integrates three distinct components:
Adaptive Oscillator Core that reveals the internal rhythm of trend and momentum.
ATR Top/Bottom Layer that marks exhaustion and potential turning zones.
Trend Signal & Dynamic Trailing Stop Engine that highlights directional shifts, confirms alignment with the prevailing trend, and transforms trend data into a self-adjusting risk-management system.
█ Main Features
⚪ ATR Trend (The Main Oscillator)
The ATR Trend serves as the indicator’s primary oscillator, translating price and volatility dynamics into a smooth directional curve. When the oscillator line remains above its equilibrium, bullish momentum dominates; when it stays below, bearish momentum prevails. Color transitions reflect real-time trend bias, helping traders immediately recognize whether the market is strengthening or weakening.
This component forms the structural core of the tool, defining overall trend direction, momentum intensity, and transition zones.
It also visualizes trend expansion through the fast leading signal line. When this line crosses above the upper or below the lower boundary, it signals an expansive move within the active trend, often representing short-term overbought or oversold conditions, and can also indicate trend strength in the prevailing market direction.
⚪ ATR Top/Bottom
The ATR Top/Bottom layer highlights potential exhaustion zones within the trend. Green peaks reveal areas of buy-side saturation, suggesting a possible slowdown or reversal in bullish momentum, while red peaks mark sell-side extremes, often appearing before stabilization or renewed strength. These zones help traders identify when a move is becoming stretched or losing balance, offering valuable context for managing exits, scaling out, or anticipating reversals. However, these areas can extend for a prolonged period when price is in a strong, sustained trend, reflecting persistent directional pressure rather than immediate exhaustion.
⚪ Trend Channel Hits
The Trend Channel Hits feature visualizes moments when the price interacts with the projected internal trend channel boundaries of the prevailing trend.
Green arrows appear when the price touches the upper boundary of the trend channel. This can indicate two possible outcomes:
A potential breakout from a negative trend into a developing bullish trend, as price breaks above the upper boundary of the descending channel.
A take-profit zone within an established bullish trend, as price reaches the upper channel where mean reversion is likely to occur.
Red arrows appear when the price touches the lower boundary of the trend channel. This can indicate:
A potential breakout from a positive trend into a developing bearish trend, as price breaks below the lower boundary of the rising channel.
A take-profit opportunity within an established bearish trend, as price reaches the lower channel where mean reversion or short-term recovery is likely to occur.
These signals provide early visual confirmation of trend exhaustion, continuation, or structural breakout, helping traders refine entries, exits, and profit-taking within the broader market context.
█ How to Use
⚪ Trend Following
When the oscillator line remains above the mid-level, the market is in a bullish phase. When it stays below the mid-level, the trend is bearish. Periods where the oscillator holds close to its upper or lower limits indicate strong, sustained momentum in that direction. Watch for color changes or crossovers near the mid-level, as these often signal an upcoming shift in trend control.
Bullish Trend
Bearish Trend
⚪ Trend Signals
To help traders identify and participate in trend trades, the indicator includes pre-built Trend Signals that highlight optimal entry conditions within confirmed market trends. These signals are designed to activate only once the market shows established directional momentum, ensuring higher reliability and filtering out noise from short-term fluctuations.
In addition, the indicator includes built-in take-profit markers for each signal. These serve as suggested partial exit levels, helping traders systematically secure profits while allowing the remaining position to follow the trend with the dynamic trailing stop.
Before relying on the signals, always confirm that the market has been trending for a sustained period. This ensures that entries align with genuine long-term directional strength rather than temporary volatility.
Bullish Trend Signals
Bullish Trend Signals appear during an established uptrend when the indicator detects confirmed positive momentum and stable directional structure. These signals mark potential continuation points where buyers regain control after short-term pauses or pullbacks.
The objective is to follow the trend signals, manage trades with the dynamic trailing stop, and consider taking partial profits at the inbuilt take-profit levels plotted by the indicator.
This setup works best when the market is trending clearly upward and has demonstrated consistent buying strength over time.
Bearish Trend Signals
Bearish Trend Signals occur during a confirmed downtrend, indicating that selling momentum remains dominant and the trend structure is intact. They typically appear after short-term corrective rallies, signaling that sellers are reasserting control within the broader bearish environment.
As with bullish signals, the goal is to follow the trend signals and trailing stop to capture sustained downside movement, while using the inbuilt take-profit levels to lock in partial gains as the move progresses. This approach performs best when the market is in a clear, mature downtrend with persistent selling pressure and expanding downside momentum.
⚪ Trend Impulses
Impulses represent short bursts of directional acceleration within the active trend.
A surge above the upper band reflects bullish expansion.
A move below the lower band marks bearish acceleration.
These impulses often precede short consolidations before the trend resumes. Traders can use them to scale into strong phases or take partial profits at temporary extremes.
⚪ Reversals
Enable ATR Top/Bottom to monitor momentum peaks:
Red peaks show strong selling momentum. When these peaks start to fade, it can signal that selling pressure is weakening and a potential recovery may be forming.
Green peaks show strong buying momentum. As their size shrinks, it may signal that buying pressure is slowing, and a possible pullback or reversal could follow.
⚪ Extended Trends
For traders who want to visualize intense, extended trend phases, enable the ATR Top/Bottom feature and increase the Length setting to around 30, with Sensitivity set between 40 and 50. Consider reducing the ATR Trend Length to 50 to gain clearer signals of when a trend begins and ends.
This configuration extends the ATR Top/Bottom zones across the entire duration of a major trend, making it easier to identify sustained directional strength and long-lasting momentum phases.
█ How It Works
⚪ Adaptive Oscillator Engine
The oscillator interprets directional flow through a combination of momentum mapping and volatility weighting. It continuously re-centers its equilibrium to reflect evolving market structure, producing a stable yet responsive representation of underlying trend force.
Calculation: Applies multi-domain smoothing and adaptive normalization to align amplitude with volatility while maintaining directional coherence.
⚪ ATR Top/Bottom Detection
The exhaustion layer isolates high-magnitude deviations from the current volatility envelope, identifying potential top and bottom regions where expansion may stall.
Calculation: Uses proportional volatility thresholds and dynamic range modeling to highlight statistically elevated momentum extremes without over-reacting to noise.
-----------------
Disclaimer
The content provided in my scripts, indicators, ideas, algorithms, and systems is for educational and informational purposes only. It does not constitute financial advice, investment recommendations, or a solicitation to buy or sell any financial instruments. I will not accept liability for any loss or damage, including without limitation any loss of profit, which may arise directly or indirectly from the use of or reliance on such information.
All investments involve risk, and the past performance of a security, industry, sector, market, financial product, trading strategy, backtest, or individual's trading does not guarantee future results or returns. Investors are fully responsible for any investment decisions they make. Such decisions should be based solely on an evaluation of their financial circumstances, investment objectives, risk tolerance, and liquidity needs.
Skrip berbayar

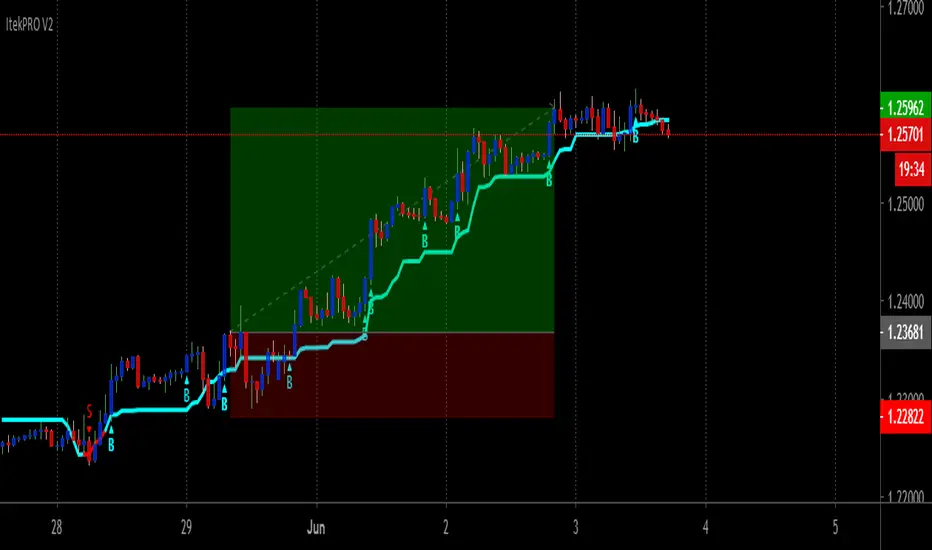
ItekPRO V2Itek PRO V2 Is An New Version of Iteksignal Trading System With Multiple BUY/SELL Entries And Exits That Can Be Used On Any Market!
An efficient way to Trade Manually Rule-Based and safely is with Itek PRO V2, a price action trend continuation Systen Trading.
GREAT for Swing Traders, Position Traders, or Investors. Works on Forex, Crypto, Stocks, Commodities.
This powerful indicator will work on just about ANY symbol and chart so that you can capture either smaller moves, or larger moves.. find the right symbol and time frame for your style of trading and use this amazing strategy to pull profitable trades.
TREND Direction and Trend Turns Are Clearly Indicated With The Built In Color-Coded Trend Line Indicator
When the trend line is BLUE the trend is headed UP, when its RED the trend is headed DOWN, when the trend line is flat it may indicate sideways conditions. The potential TREND TURNS can be seen by the change in the SLOPE and confirm by the change in the COLOR.
Signals produced by the indicator are very easy to read, completely Non-Discretionary.
Here’s How It Works
Entry Signals
Once Itek PRO V2 indicator has spotted an entry point, it clearly displays a Buy or Sell Signal on your chart, showing you exactly where possible entry to continue with the trend or start a new one.
Trade Setup Definitions
· Signal bar: It is the closed bar where the indicator is plotted (Blue or Red dots) in the chart.
· Entry bar: The first bar after the signal bar that reach the high of the Signal bar.
Setup Entry Rules
· Rule 1: Wait for the Signal bar closes. Enter the Long trade 1-2 pips above the high of the signal bar (Opposite for Short).
· Rule 2: If the HIGH of Signal Bar is near an important resistance level enter the trade 1-2 tick above resistance.
Extremes (Expo) Extremes (Expo)
DESCRIPTION
This Extreme (Expo) indicator identifies areas where the market is extreme. The length of the extreme calculation can be changed and gives you the flexibility to choose how sensitive the indicator should be. A longer length means that the indicator only identifies bold extremes. A shorter length is more sensitive and thus identifies all extremes in the market.
When the market is in an extreme mode, keep your trade until the extreme mode ends.
Postive extreme is when the price is above the positive extreme lines. (Keep your long trade until the positive extreme ends).
Negative extreme is when the price is below the negative extreme lines. (Keep your short trade until the negative extreme ends).
The Extremes (Expo) can be used to visualize the trend. Price crossing indicates a directional change. Price can also bounce off the extremes lines, which can act as dynamic support and resistance. It is often used in combination with other signals and analysis techniques.
TREND
The indictor has a Trend- feature that can be switched on which identifies trend shifts as well as trend direction.
A positive trend is when all three trendlines are green, and when the price is at least above one of these three lines.
A Negative trend is when all three trendlines are red, and when the price is at least under one of these three lines.
When the color of the trend lines changes color it indicates that the trend might shift direction. When all three trendlines have shifted color a trend is established.
PULLBACK
A bonus feature that is added to the trend-setting is that it can detect pullbacks in trends. This is visualized by that one of the three trendlines change color. For instance, say that all 3 lines are red (negative trend) and one of these lines changes color to green it can be regarded as a pullback in the negative trend.
HOW TO USE
1. Use the indicator to identify extreme areas.
2. Use the indicator to identify trends.
3. Use the indicator to identify trend shifts.
4. Use the indicator to identify pullbacks in trends.
INDICATOR IN ACTION
EXTREMES
BTCUSD
BTCUSD
TESLA
WALL STREET
TREND & PULLBACK
WALL STREET
EURUSD
I hope you find this indicator useful , and please comment or contact me if you like the script or have any questions/suggestions for future improvements. Thanks!
I will continue to work on this indicator, so please share your experience and feedback with me so that I can continuously improve it. Thanks to everyone that have contacted me regarding my scripts. Your feedback is valuable for future developments!
ACCESS THE INDICATOR
• Contact me on TradingView or use the links below
-----------------
Disclaimer
Copyright by Zeiierman.
The information contained in my scripts/indicators/ideas does not constitute financial advice or a solicitation to buy or sell any securities of any type. I will not accept liability for any loss or damage, including without limitation any loss of profit, which may arise directly or indirectly from use of or reliance on such information.
All investments involve risk, and the past performance of a security, industry, sector, market, financial product, trading strategy, or individual’s trading does not guarantee future results or returns. Investors are fully responsible for any investment decisions they make. Such decisions should be based solely on an evaluation of their financial circumstances, investment objectives, risk tolerance, and liquidity needs.
My scripts/indicators/ideas are only for educational purposes!


Sizing GuideThis indicator helps you defining your max sizing, depending on the max $$$ amount you're willing to risk against a specific exponential moving average (or VWAP, default is the 13ema).
You can define your max risk amount and your max allowed sizing. The indicator would suggest the best sizing in order to risk only up to the amount you are comfortable with on a potential trade.
Moreover, the column bar would turn yellow/red if the divergence is above a certain threshold (default are yellow > 1.50% and red > 2.75%, green otherwise).

Pullback Trading [Fhenry0331]The indicator is taken from Alexander Elders "Triple Screen System," minus using the Weekly MACD as a filter/trend. I believe waiting for the force index and the weekly MACD histogram to line-up is uber conservative and a trader will miss too many signals (In my opinion).
The indicator is for a pullback trader. A trader that waits for a trend to develop then enters on a pullback.
The indicator defines an uptrend start: as the 13 ema crossing above the 26 ema. It defines a downtrend start: as the 13 ema crossing below the 26 ema.
The pullback in an uptrend: 13 ema is above the 26 ema. Elders-Force-Index is below the zero line. Price low has crossed below the 13 ema (one can also say price closes below the 13 ema if they so wish).
The pullback in a downtrend: 13 ema is below the 26 ema. Elders-Force-Index is above the zero line. Price high has also crossed above the 13 ema.
Please note that the pullback signals do not necessitate an automatic buy or sell (the instrument can be still pulling back deeper and not ready to resume it's trend.) One should place orders above (long) or below (short) bars with the pullback signals. Do so on signals until orders are filled.
Although the indicator is meant for pullbacks one can make an aggressive entry at the onset of a crossover of ema's.
For clarity background colors has been added to the indicator.
works well on daily time frame. Also look at intraday (5) minute time frame on trending stocks (news, earnings, volume, etc.)
Keep It Simple.
Enjoy!
