Rainbow Oscillator [Strategy]Strategy based on Rainbow Oscillator
.:: Features ::.
Takes and Stops in percent
Configurable indicator iside
.:: Long condition ::.
Indicator line is green (mean uptrend) and crossing averages generated from oscillograph signal fast is go up and crossing slow
.:: Short condition ::.
Indicator line is red (mean downtrend) and crossing averages generated from oscillograph signal fast is go down and crossing slow
Rainbow

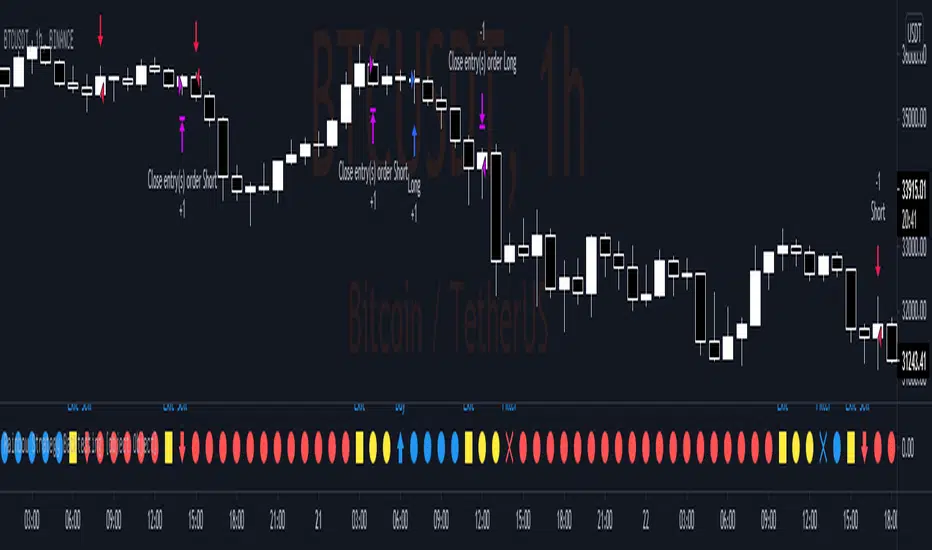
Rainbow Strategy BacktestingRainbow Strategy Backtesting base on "Rainbow Moving Average" Strategy as below:
1.Rainbow Moving Average setup
- Source: source of 1st MA
- Type: SMA/EMA
- Period: period of 1st MA
- Displacement: period of 2nd MA to 7th MA with source is previous MA
2.Trend Define
- Up Trend: Main MA moving at the top of Rainbow
- Down Trend: Main MA moving at the bottom of Rainbow
- Sideway: Main MA moving between the top and the bottom of Rainbow
3.Signal
- Buy Signal: When Rainbow change to Up Trend.
- Sell Signal: When Rainbow change to Down Trend.
- Exit: When Rainbow change to Sideway.
4.RSI Filter
- "Enable": Only signals have 1st RSI moving between Overbought and Oversold and 2nd RSI moving outside Middle Channel are accepted.
- The filter may help trader avoid bull trap, bear trap and choppy market.
5.Backtesting Infomation
- Ticker: BTCUSDT
- Timeframe: H1
- Rainbow parameter:
+ Source: hlc3
+ Type: SMA
+ Period: 12
+ Displacement: 3
- RSI Filter parameter:
+ Enable
+ 1st RSI filter: period 12, overbought 65, oversold 35
+ 2nd RSI filter: period 9, upper middle 56, lower middle 44
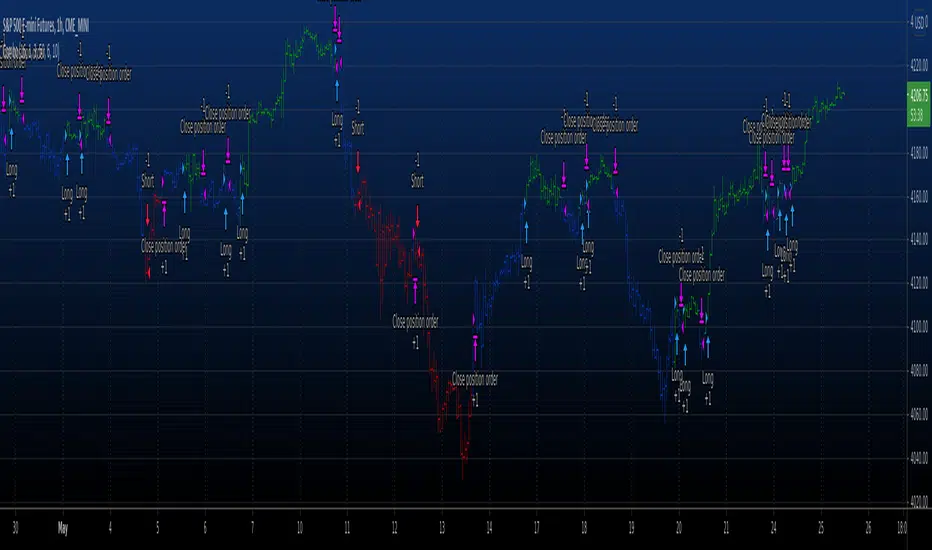
Combo Backtest 123 Reversal & Rainbow Oscillator This is combo strategies for get a cumulative signal.
First strategy
This System was created from the Book "How I Tripled My Money In The
Futures Market" by Ulf Jensen, Page 183. This is reverse type of strategies.
The strategy buys at market, if close price is higher than the previous close
during 2 days and the meaning of 9-days Stochastic Slow Oscillator is lower than 50.
The strategy sells at market, if close price is lower than the previous close price
during 2 days and the meaning of 9-days Stochastic Fast Oscillator is higher than 50.
Second strategy
Ever since the people concluded that stock market price movements are not
random or chaotic, but follow specific trends that can be forecasted, they
tried to develop different tools or procedures that could help them identify
those trends. And one of those financial indicators is the Rainbow Oscillator
Indicator. The Rainbow Oscillator Indicator is relatively new, originally
introduced in 1997, and it is used to forecast the changes of trend direction.
As market prices go up and down, the oscillator appears as a direction of the
trend, but also as the safety of the market and the depth of that trend. As
the rainbow grows in width, the current trend gives signs of continuity, and
if the value of the oscillator goes beyond 80, the market becomes more and more
unstable, being prone to a sudden reversal. When prices move towards the rainbow
and the oscillator becomes more and more flat, the market tends to remain more
stable and the bandwidth decreases. Still, if the oscillator value goes below 20,
the market is again, prone to sudden reversals. The safest bandwidth value where
the market is stable is between 20 and 80, in the Rainbow Oscillator indicator value.
The depth a certain price has on a chart and into the rainbow can be used to judge
the strength of the move.
WARNING:
- For purpose educate only
- This script to change bars colors.
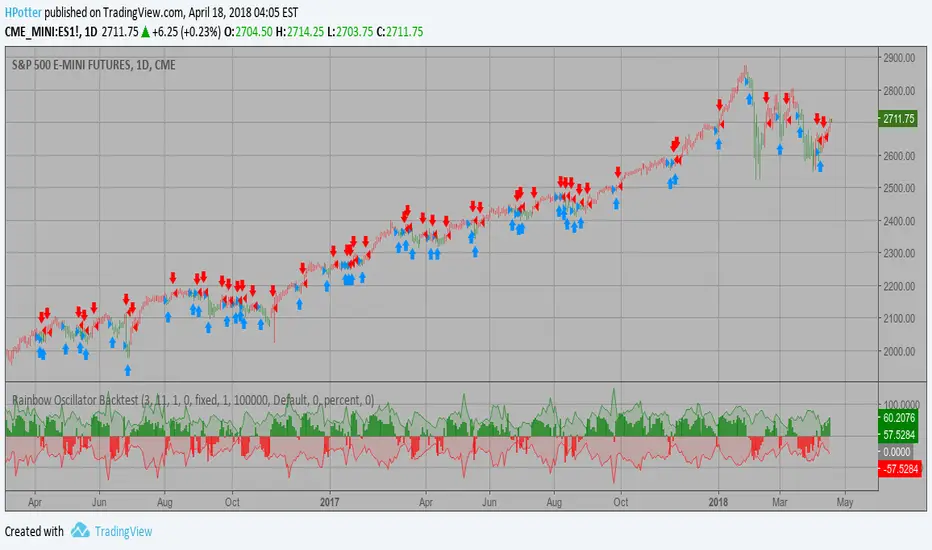
Rainbow Oscillator Backtest Ever since the people concluded that stock market price movements are not
random or chaotic, but follow specific trends that can be forecasted, they
tried to develop different tools or procedures that could help them identify
those trends. And one of those financial indicators is the Rainbow Oscillator
Indicator. The Rainbow Oscillator Indicator is relatively new, originally
introduced in 1997, and it is used to forecast the changes of trend direction.
As market prices go up and down, the oscillator appears as a direction of the
trend, but also as the safety of the market and the depth of that trend. As
the rainbow grows in width, the current trend gives signs of continuity, and
if the value of the oscillator goes beyond 80, the market becomes more and more
unstable, being prone to a sudden reversal. When prices move towards the rainbow
and the oscillator becomes more and more flat, the market tends to remain more
stable and the bandwidth decreases. Still, if the oscillator value goes below 20,
the market is again, prone to sudden reversals. The safest bandwidth value where
the market is stable is between 20 and 80, in the Rainbow Oscillator indicator value.
The depth a certain price has on a chart and into the rainbow can be used to judge
the strength of the move.
You can change long to short in the Input Settings
WARNING:
- For purpose educate only
- This script to change bars colors.
Rainbow StrategyThe strategy is based on the following idea:
www.youtube.com
Not a fan of this but no script was present to show this idea's performance.
Best suitable for the 1-minute chart. You can change the ema values as per your needs.
For Tips to continue :) -
BTC: 1BjswGcRR6c23pka7qh5t5k56j46cuyyy2
ETH: 0x64fed71c9d6c931639c7ba4671aeb6b05e6b3781
LTC: LKT2ykQ8QSzzfTDB6Tnsf12xwYPjgq95h4
