Simple RSI and SMA Long and Short (by Coinrule)The relative strength index ( RSI ) is a momentum indicator used in technical analysis . RSI measures the speed and magnitude of a security's recent price changes to evaluate overvalued or undervalued conditions in the price of that security. The RSI is displayed as an oscillator (a line graph) on a scale of zero to 100. The RSI can do more than point to overbought and oversold securities. It can also indicate securities that may be primed for a trend reversal or corrective pullback in price. It can signal when to buy and sell. Traditionally, an RSI reading of 70 or above indicates an overbought situation. A reading of 30 or below indicates an oversold condition.
A simple moving average ( SMA ) calculates the average of a selected range of prices, usually closing prices, by the number of periods in that range.
The Strategy enters and closes the trade when the following conditions are met:
LONG
SMA100 is greater than SMA150
RSI is greater than 50
SHORT
SMA100 is less than SMA150
RSI is less than 50
When a long position is opened, it remains open until the conditions for a short are met at which point the long position is closed and the short position is opened. Then, when the conditions for the long position are met, the short will be closed and a long will be opened.
This strategy is back tested from 1 January 2022 to simulate how the strategy would work in a bear market. The strategy provides good returns.
The strategy assumes each order is using 30% of the available coins to make the results more realistic and to simulate you only ran this strategy on 30% of your holdings. A trading fee of 0.1% is also taken into account and is aligned to the base fee applied on Binance.
Relativestrength

RSI & BB QQE Mod (highlight)This script is a combination of the RSI, QQE and BB
Here is an explanation on how I combined them, and how they are used:
- RSI (Relative Strength Index)
- Display a smoothed version of the RSI to identify "oversold" and "overbought" market phases
- Used to calculate a QQE
- QQE (Quantitative Qualitative Estimation)
- Used to identify trend direction and trend strength
- Used to set a basis for the BB
- BB (Bollinger Bands)
- Used with QQE as a basis to determine a relative definition of "high RSI" and "low RSI"
- Used with QQE as a basis to determine the volatility of the RSI at a given moment
- Used to predict pivot points
Here are the main signals:
- When "RSI Smoothed" line above the Upper BB then "RSI Smoothed" line turns green
- Also , display green background color highlight
- Also , and if "RSI Smoothed" is above the overbought line then display a second green background color highlight
- When "RSI Smoothed" line bellow the Lower BB then "RSI Smoothed" line turns red
- Also , display red background color highlight
- Also , and if "RSI Smoothed" is bellow the oversold line then display a second red background color highlight
A tool codded to be aesthetically pleasing and VERY customisable:
- Designed for both light theme and dark theme users
- Value can be easily modified in the settings
- Colors can be easily swapped in the settings
- Opacity of "fill" & "bgcolor" regrouped as a single input
A tool codded to be easy to read and to learn from:
- Sources and inspirations all listed within the script
- Structure easily identifiable (to understand with little to no effort how the script works)
Notes :
- This script is lagging, because of that I do recommend using it on relatively large timeframe
- This script is OpenSource, feel free to reuse it, but if so please remember to include a link to my script in your sources
- This script is not a magical tool, use at your own risk

Outback RSI & Hull [TTF]This indicator was originally made to help users following along with one of our strategies that we call The Outback (hence the name).
One of the component indicators of that strategy is an RSI with a Hull Moving Average added on top of the RSI as an additional reference for the momentum of the RSI. Many people either had difficulty setting this up correctly, or were having issues with the Indicator on Indicator component, so we built this indicator to assist in that regard.
As we continued to use it, we found it to be a pretty sound momentum indicator that had much to offer by enhancing the more normal RSI, and wanted to make this indicator generally available to the public.
The basic premise of this indicator is as follows:
The core is a traditional RSI with a "normal" (usually Simple) moving average
The "secret sauce" is adding a 2nd moving average (a Hull Moving Average, inspired by Insilico's awesome Hull Suite) based off the RSI
By leveraging the RSI's position relative to both the Simple and Hull moving averages, you can better gauge the relative strength of the current momentum, as well as better visualize longer-term momentum direction and strength based on the moving average slopes and direction.

Double RSI TrendThis is my Double RSI Trend Indicator. It issues Buy and Sell signals based on the Supertrend and a double RSI . The RSIs cross near or at the same time as the Supertrend fires. It has the ability to change if you want signals based on the RSI cross on the same candle, one candle before, and two candles before. I find this one extremely good at catching reversals as long as you filter out some of the signals based on trend.

VARS 2.0: Volatility Adapted Relative StrengthVARS 2.0 (Volatility Adapted Relative Strength)
Basically, my VARS 2.0 indicator uses a stock's alpha in comparison to the SPX to determine whether there is relative strength on an volatility adjusted basis.
The idea for this indicator owes quite obviously to Matt Caruso . In this indicator I combine his Alpha Bars indicator with my interpretation of his CARS indicator, whose calculations are unknown to me.
The goal of this indicator is to give a representation of an asset's relative strength adjusted to its volatility. To find out if this is not only theoretically superior to a more simple representation such as by means of the classic RS Line , but also practically , this indicator is build.
I made this indicator freely available, so that everyone can make up his own mind about it. The representation with the alpha bars also offers the possibility to keep an eye on the daily relative strength, which is a complement to my former version of it. This time I limited myself to only one alpha timeframe because I believe the strength of the RS can be more clearly captured based on the EMAs. I also believe that the absolute strength of VARS is not the key point for traders, but rather its duration, as this is a sign of institutional accumulation.
Have fun and success trying it out!
Btw. The variables such as alpha and beta and the EMAs, which are used to calculate VARS, are largely freely definable. The default values are to be considered as suggestions.

two_leg_spread_diffThis script helps you discern the relative change of each leg in a two-legged spread over a given period. The main plot is a difference in log return over the number of bars identified by the "lag" parameter. E.g. if "lag" is 10 and leg one has increased 3% over the past ten bars, while leg two has only increased 1%, the plot value is 2%. The main plot is also colored blue when leg one increases while leg two decreases on a given bar, and red if the opposite is true. This feature identifies periods where the correlation between the two legs diminishes. The one and two standard deviation of the main plot is also plotted in faint background lines. Additionally, a table indicates the percentage in which the main plot is within one standard deviation (acc 1) and two standard deviations (acc 2). Note that the standard deviation updates on each bar, so the current standard deviation is not the one used to calculate the accuracy. Rather, if there are N bars, N different standard deviation readings have been used to compute the accuracy statistics.
The inputs are:
- timeframe: the timeframe of the chart
- leg1_sym: the symbol of the first leg
- leg2_sym: the symbol of the second leg
- lag: the number of bars back to reference for computing the log return of each leg
- anchor_to_session_start: for intraday charts only, this overwrites the "lag" input so that the "lag" always sets the point of comparison to the session start. This setting is used to compute the relative change over a single session.

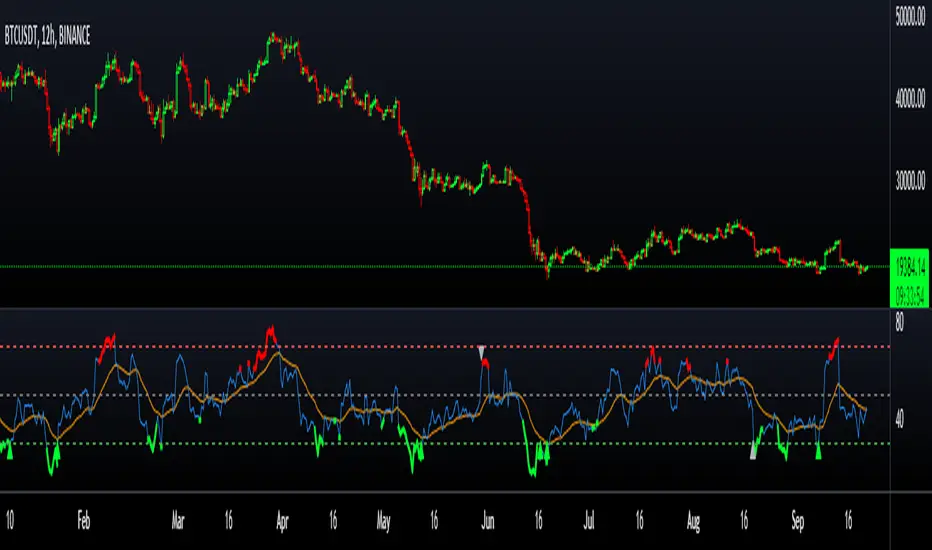
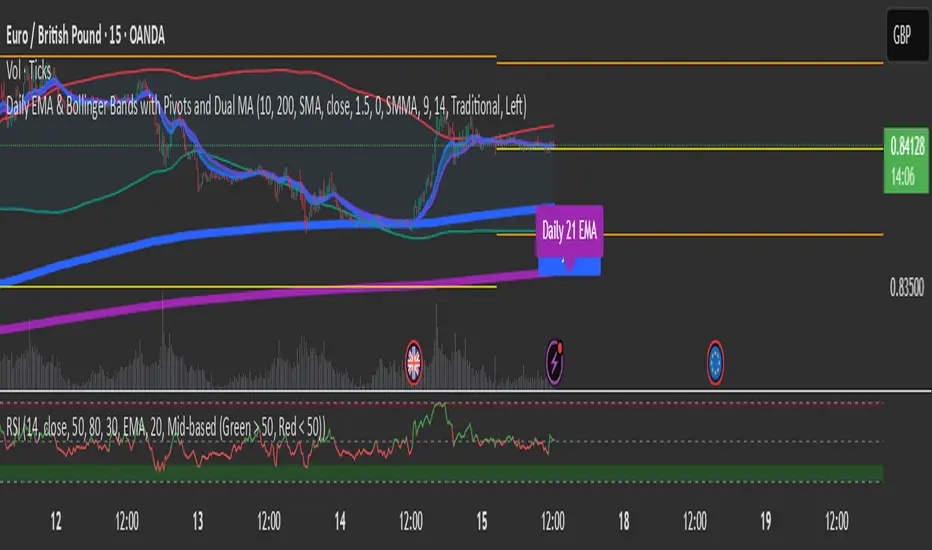
DoubleRSI fast/slow signal buy/sell with alert Relative StrengthA combination of two Relative strength index. One fast and one slow line. In a system, this indicator can serve as an additional confirmation.
For example, for a long entry:
slow RSI cross above 50 level and fast RSI cross above 70 level. then check volume and use another indicator such as a MACD for extra confirmation
For example, for a short entry:
slow RSI cross below 50 and fast RSI cross below 30 level. then check volume and use another indicator such as a MACD for confirmation
An alarm function has also been added.
the following settings are possible:
- Source
- Length
- Color
I do not recommend to use this indicator alone.
have fun using this simple and helpful tool.

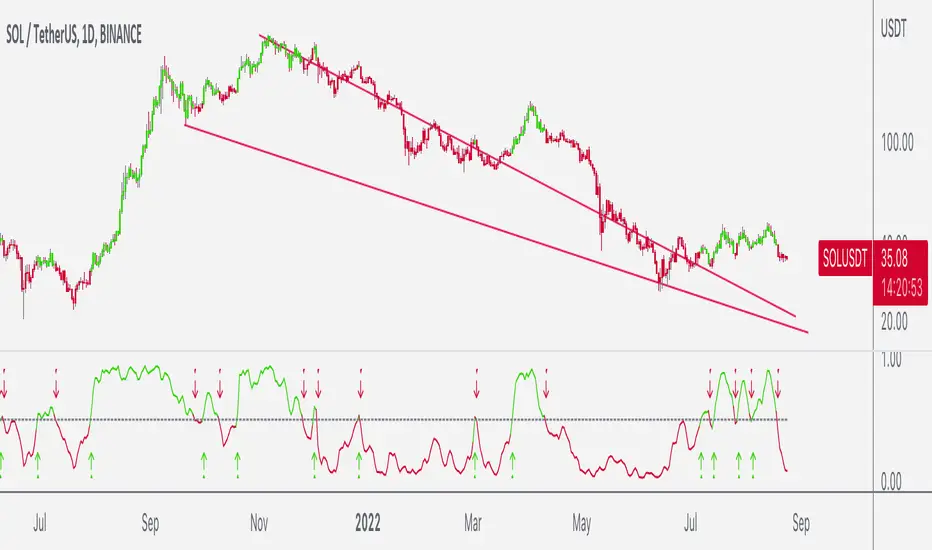
RSI Exhaustion + DivergenceThe Relative Strength Index Exhaustion with Divergence is an essential replacement of the standard Relative Strength Index Oscillator because it's able to identify and highlight hidden exhaustions together with Bullish/Bearish Regular and Hidden Divergences.
This indicator can give the outmost probability in spotting trend reversals or trend continuation.
By identifying hidden exhaustion momentum, the Relative Strength Index Exhaustion indicator represents an essential support to the trader in effectively reading the market and grabbing the best opportunities.
This detects divergences between price and indicator with 1 candle delay so it filters out repeating divergences.
Recommended to use this at a higher timeframe to lessen the false signals.
Red Arrow = Bullish/Bearish Divergence
White Arrow = Hidden Bullish/Bearish Divergence
RSI with Slow and Fast MA Crossing Strategy (by Coinrule)This strategy utilises 3 different conditions that have to be met to buy and 1 condition to sell. This strategy works best on the ETH/USDT pair on the 4-hour timescale.
In order for the strategy to enter the trade, it must meet all of the conditions listed below:
ENTRY
RSI increases by 5
RSI is lower than 70
MA9 crosses above MA50
To exit a trade, the below condition must be met:
EXIT
MA50 crosses above MA9
This strategy works well on LINK/USDT on the 1-day timeframe, MIOTA/USDT on the 2-hour timeframe, BTC/USDT on the 4-hour timeframe, and BEST/USDT on the 1-day timeframe (and 4h).
Back-tested from 1 January 2020.
The strategy assumes each order is using 30% of the available coins to make the results more realistic and to simulate you only ran this strategy on 30% of your holdings. A trading fee of 0.1% is also taken into account and is aligned to the base fee applied on Binance.

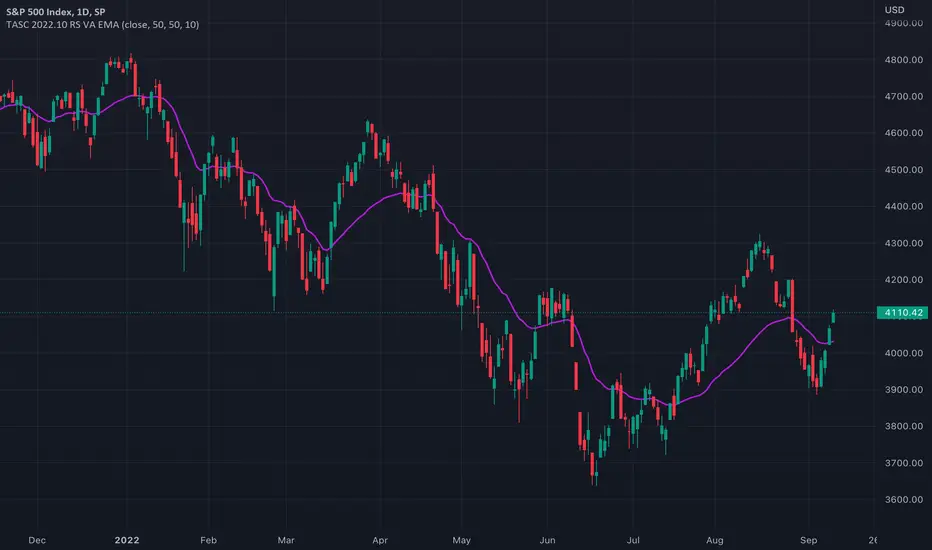
TASC 2022.10 RS VA EMA█ OVERVIEW
TASC's October 2022 edition Traders' Tips includes the second part of the "Relative Strength Moving Averages" article series authored by Vitali Apirine. This is the code that implements the Relative Strength Volume-Adjusted Exponential Moving Average (RS VA EMA) presented in this publication.
█ CONCEPTS
In his article series, the author argues that the relative strength of price, volume, and volatility can potentially be used to filter price movements and define turning points. In particular, the RS VA EMA indicator is designed to account for the relative strength of volume. Like the traditional exponential moving average (EMA) , it is a lagging trend-following indicator. The difference is that it responds more quickly.
In a trading strategy, RS VA EMA is suggested to be used in combination with EMA of the same length to determine the overall trend or in combination with RS VA EMA of a different length to identify turning points and filter price movements.
█ CALCULATIONS
The calculation of RS VA EMA is based on the concept of volume strength (VS). By definition, VS measures the difference between "positive" and "negative" volume flow. Volume is indicated as "positive" when the close is higher than the previous close and "negative" when the close is below the previous close.
The following steps are used in the calculation process:
• Calculate the volume strength (VS) of a given length.
• Multiply VS by a predefined multiplier and calculate the EMA of the resulting time series.
The values of 10,10,10 are the typical input settings for RS VA EMA, where the first parameter is the length of the moving average, the second is the length of VS, and the third is the volume strength multiplier.
two_leg_spread_returns_zscoreThis script helps assess the relative returns of each leg in a two-legged spread. It shows the z-score of each period's returns, along with a moving average of the difference between the two returns. A negative moving average implies that the second leg is strengthening, on a relative return basis, against the first leg, and vice versa. The inputs are:
- timeframe: the timeframe for the calculations. the default is five minutes.
- leg1_sym: the symbol for the first leg
- leg2_sym: the symbol for the second leg
- ma_length: the length of the moving average. by default it is 48, or the previous four hours, given the default timeframe.
The default symbols are RB and HO, simply as an example of an intercommodity spread.

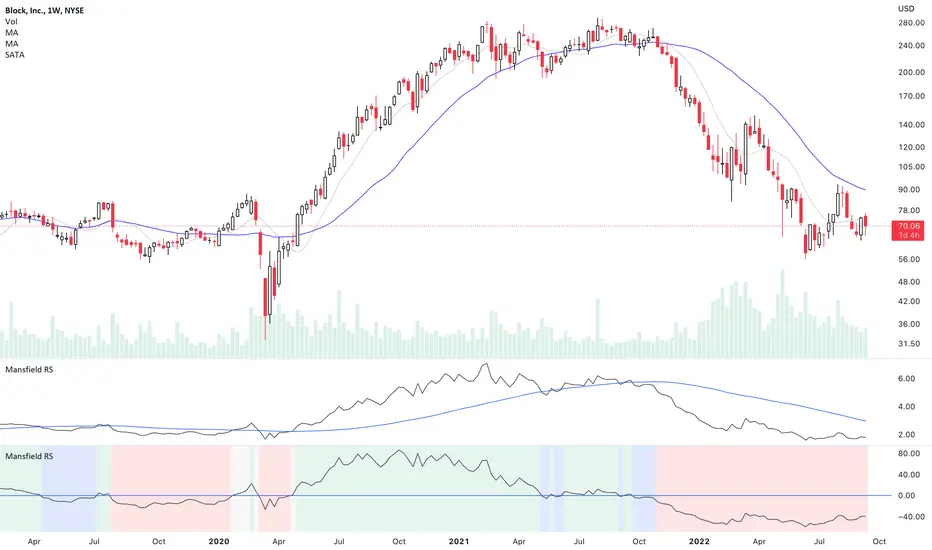
Mansfield Relative Strength (Original Version) by stageanalysisThe Mansfield Relative Strength ( Mansfield RS ) is one of the core components of the Stan Weinstein's Stage Analysis method as discussed in his classic book Stan Weinstein's Secrets for Profiting in Bull and Bear Markets .
The Mansfield RS measures the relative performance of the stock compared to an index such as the S&P 500, or to another stock etc.
However, this should not to be confused with the popular RSI (Relative Strength Index developed J. Welles Wilder), which is a momentum oscillator that measures the speed and change of price movements on a single stock.
The Mansfield RS indicator consists of the Relative Strength comparison line versus the S&P 500 (default universal setting, but can be edited), and the "Zero Line" – which is the 52 week MA of the Relative Strength line, that's been flattened to create the oscillator style.
How to use the Indicator:
Outperforming – Above the Zero Line
When the Relative Strength line crosses above the Zero Line (it's flattened 52 week RS MA), it is outperforming the index or stock that it's comparing against, and so it is showing stronger relative strength.
Underperforming – Below the Zero Line
When the Relative Strength line crosses below the Zero Line (it's flattened 52 week RS MA), it is underperforming the index or stock that it's comparing against, and so it is showing weaker relative strength.
Settings:
When you first add the indicator is has a coloured background, with a green tint for a postive RS score, and a red tint for a negative RS score. However, this can be turned off, or edited in the indicator settings, in the Style tab. So you can change the colors or remove it and just have the RS line and zero line showing. Both of which can also be edited in the settings.
Change the symbol that it compares against. The default is the S&P 500. But for crypto you might want to use Bitcoin for example. Or you might want to compare against competing stocks in the same peer group, or against the industry group or sector. The choice is yours. But the S&P 500 is a universal measure for the Mansfield RS. So I would recommend leaving it on that unless you have a particular reason to change it as mentioned.
MA Length is also an editable setting. This creates the Zero Line. So it will affect the values of the Mansfield RS if you change it. 52 is the default setting, and is set as such for the weekly chart. So I'd recommend not editing it on the weekly chart, but for other timeframes, different settings can be used.
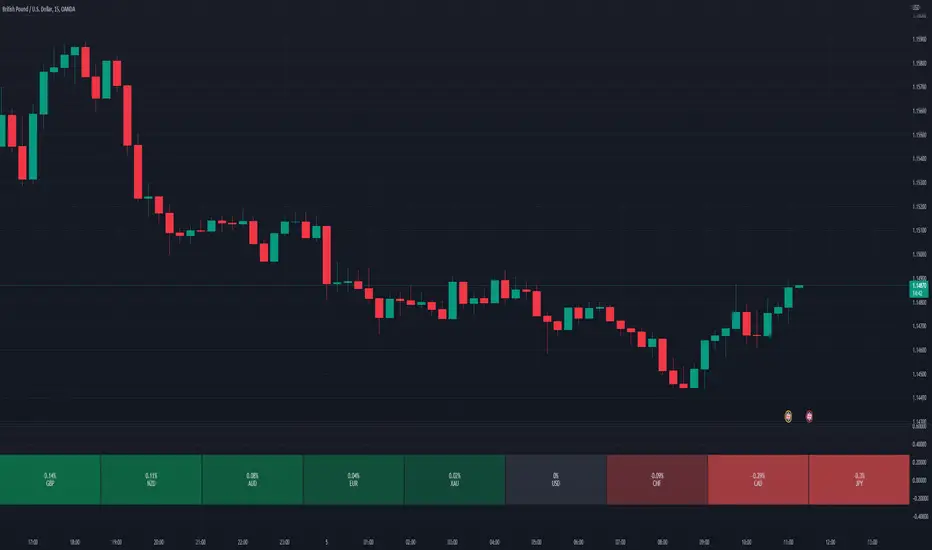
Relative Perfomance IndexHello Traders.
Lets keep it simple..
1. Take the major pairs that have USD in them and watch their change over a specific timeframe.
2. Now lets sort these changes of each pair from the most positive to the most negative.
Good, I see you have some ideas already.
This is exactly what this indicator does. You will visualize the biggest change in pairs of the timeframe of your choice and from this you can decide on pairs that you want to trade.
Stage Analysis Technical Attributes (SATA) by stageanalysisThe Stage Analysis Technical Attributes (SATA) is a unique highly visual indicator to help identify the four stages from Stan Weinstein's Stage Analysis method, as described in the classic book Stan Weinstein's Secrets for Profiting in Bull and Bear Markets .
The indicator is made up of 10 separate bands. Each of which is coloured be either Positive (Green), Neutral (Blue) or Negative (Red), with a score of 1 or 0 is assigned to each.
The coloured bands measure different aspects of the Stage Analysis methods key components, including:
Breakouts and Breakdowns
Price / Moving Averages
Mansfield Relative Strength
Momentum
Volume
Overhead Resistance
Each Positive (Green) square is given a score of 1, and each Neutral (Blue) or Negative (Red) square get a score of zero, and so a rating system of 0 to 10 is generated.
There's no easy automated way to define the four stages, but by using a scoring system is one of the most accurate ways that we've seen, especially at the Stage 2 breakout and Stage 4 breakdown points. But it is still only a rough guide, as you still need to use your eyes to define the key levels.
To define the four Stages (a general rough guide, as they will overlap at times, so you still need to use your eyes):
SATA Scores:
6 to 10 = Stage 2 (Uptrend)
Rising to 2 to 8 = Stage 1 (Accumulation Basing Period)
Dropping to 8 to 2 = Stage 3 (Distribution Basing Period)
0 to 5 = Stage 4 (Downtrend)
Major Transitions between the Stages:
Use these figures only as a ROUGH GUIDE ONLY. You still need to use your eyes. But here are some typical SATA Scores at the major transitions between the Stages.
Stage 2 Breakout: Typically a SATA score of 9 or 10 (look for the top square to be green, as identifies a breakout)
Stage 4 Breakdown: Typically a SATA score of 1 or 0
Entering Stage 1 following a Stage 4 decline: Typically a SATA score of 4 to 6 after a period where the score is below 3
Entering Stage 3 following a Stage 2 advance: Typically a SATA score of 4 to 6 after a period where the score is above 7
This is the first version of the SATA indicator. So we'll be looking to improve it further, as we get more data from using it.
We hope you enjoy using it, and it helps you to better understand the four Stages.

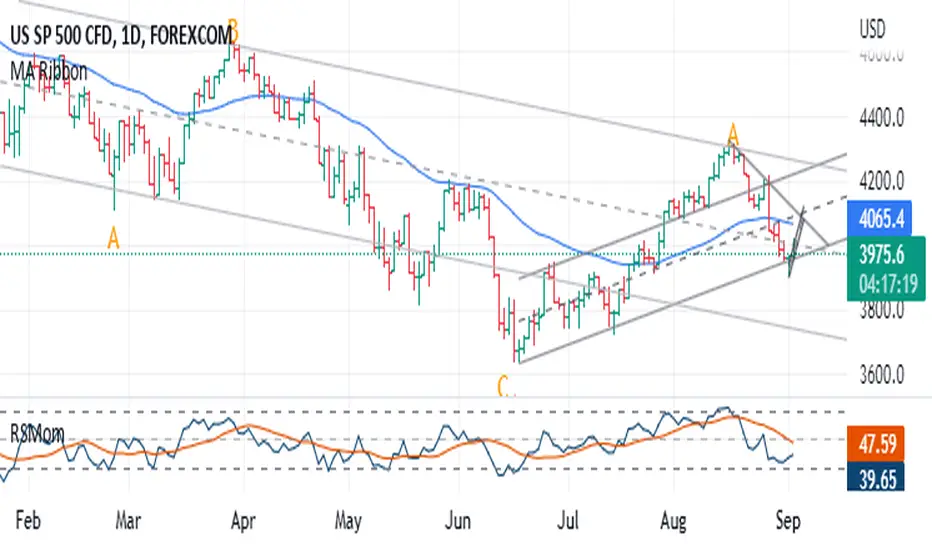
Relative Strength MomentumThe RSI is a traders friend - it can provide insight that other indicators simply cannot. The RSI achilles heel is that it can often fail to highlight divergence. Constance Brown attempted to resolve this problem with the 'Composite index' - a powerful tool. However.. for me, looking at two indicators can get a bit much - especially if viewing multiple time-frames. I want one tool which provides the RSI, it's ranging/reversal behaviour (as documented by Andrew Cardwell) and a better grasp of momentum swings (via divergence and reversal signals). So this is my best effort, and I hope it can prove useful to some of you. At first the differences may be hard to spot - but they are there!
My default settings are optimised - as with the 'normal' RSI you can expect a bullish trend to result in few (if any) moves below 30. In a bearish trend, you can expect few (if any) incursions above 70. Cardwell's observations apply. I recommend using this with a 50 period EMA to provide some additional context.
RSI mid partition color changeWhen RSI is above 50 our default bias is on buy side and when below 50 our bias is on sell side.
Therefore created 2 zones for easy identification.
Modified for Altcoinsstepping algorithm to smooth RSI and CCI combined . This allows for noise reduction and better identification of breakouts/breakdowns/reversals.
Green is buy and Red is sell
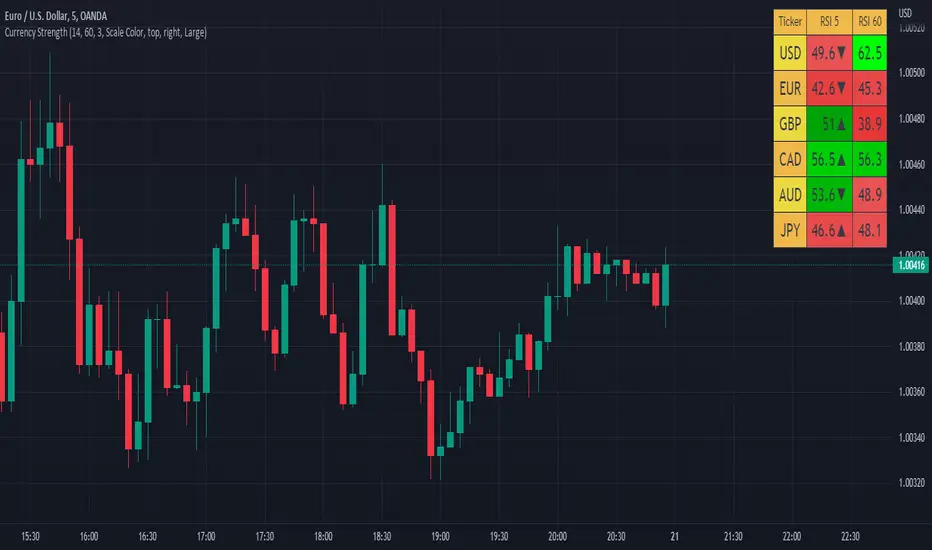
Currency Strength V2An update to my original Currency Strength script to include a 2nd timeframe for more market context.
Changed the formatting slightly for better aesthetics, as the extra column and colors became unsightly.
Also added a new setting for "Flat Color", which changes the value background to a simple green/red for above or below 50, rather than using the Color Scale that increases color intensity the further it gets from 50.
________________________________________________________________________________
This script measures the strength of the 6 major currencies USD, EUR, GBP, CAD, AUD and JPY.
Simply, it averages the RSI values of a currency vs the 5 other currencies in the basket, and displays each average RSI value in a table with color coding to quickly identify the strongest and weakest currencies over the past 14 bars (or user defined length).
The arrow in the current RSI column shows the difference in average RSI value between current and X bars back (user defined), telling you whether the combined RSI value has gone up or down in the last X bars.
Using the average RSI allows us to get a sense of the currency strength vs an equally weighted basket of the other majors, as opposed to using Indexes which are heavily weighted to 1 or 2 currencies.
The additional security calls for the extra timeframe make this slower to load than the original, but this was a user request so hopefully it will prove worthwhile for some people.
Those who find the loading too slow when switching between charts may be better off still using the original, which is why this is posted as a separate script and not an update to the original.
This is the table with Flat Color option enabled.
Dynamic Relative StrengthMainly this indicator is a Relative strength indicator which tells us about the strength of a scrip as compared to an index . That is it outperforming the index or underperforming . Outperformance signifies Strength and Under performance signifies Weakness .Inspired from Bharat trader's Relative Strength of a stock , but changing the period for all time frames is a hassle so i have set 10 period for Monthly and 52 period for Weekly. As for monthly we need around 10 months data or we can use 12 as 1 year has 12 months but 10 works best . used 52 period for Weekly time frame because there are 52 weeks in a year. These values are by default dynamically applied to the indicator when weekly or monthly timeframes are chosen . Daily Period can be chosen as per anyone's need . As can be seen in provided screenshot , that the stock has recently started gaining strength on weekly a compared to Small cap100 index . So we can conclude that it has more strength than the overall index it is representing so more chances of outperformance will be there.

PharshK RSI and Zigzag with H/LIt is with RSI level
and Zigzag Pattern that Market goes on Maximum level and Lower Level
And it is also Showing High and Law Level of last Moving Candle so it is easy to entry and Hold

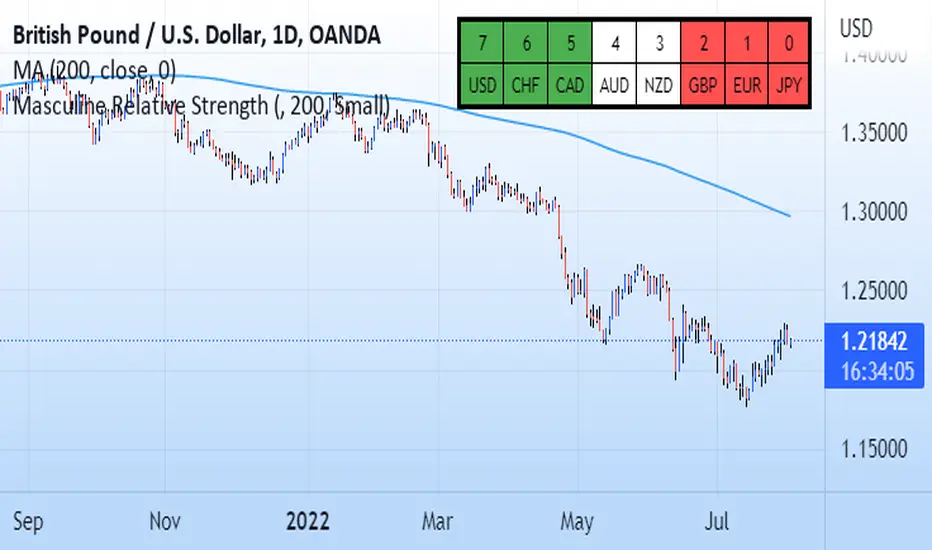
Masculine Relative StrengthThis relative strength indicator compares the G8 currencies against each other in all 28 combinations. It uses the 200 period moving average as a scoring system. For example on eurusd if current price action is above the MA that is +1 for the eur and -1 for the dollar and the inverse is applied if current price is under the 200 ma. The higher the number the stronger the currency. The weaker the number the weaker the currency. Pair the strongest currency with the weakest. This indicator does not guarentee profits and past performance does not guarentee the same future results.
Banknifty Volume - IN
This simple indicator computes the average Relative Strength Index of each Banknifty stock and displays the volume on the chart with color schemes while the average line indicates the average RSI of all Bank Stocks. This indicator works on Banknifty and its stocks.
It works on all time frames
How You can use this?
You can use this indicator for Volume analysis if the average RSI line is above the 0 line, the stock is moving upside and vice versa for Downside .

Candle Strength IndicatorThe candle strength indicator depicts the average strength of the price action by evaluating bullish vs bearish candles.
The scale is relative to price fluctuation and the size of the candles for the particular ticker / market, so there are no significant levels.
A cross on the zero line would generally indicate a change in trend / sentiment.
This indicator may be useful as a filter for entries and use in confluence with other indicators.
