MACD of RSI [TORYS]MACD of RSI — Momentum & Divergence Scanner
Description:
This enhanced oscillator applies MACD logic directly to the Relative Strength Index (RSI) rather than price, giving traders a clearer look at internal momentum and early shifts in trend strength. Now featuring a custom histogram, dual MA types, and RSI-based divergence detection — it’s a complete toolkit for identifying exhaustion, acceleration, and hidden reversal points in real time.
How It Works:
Calculates the MACD line as the difference between a fast and slow moving average of RSI. Adds a Signal Line (MA of the MACD) and plots a Histogram to show momentum acceleration/deceleration. Both RSI MAs and the Signal Line can be toggled between EMA and SMA for custom tuning.
Divergence Detection:
Bullish Divergence : Price makes a lower low while RSI makes a higher low → labeled with a green “D” below the curve.
Bearish Divergence : Price makes a higher high while RSI makes a lower high → labeled with a red “D” above the curve.
Configurable lookback window for tuning sensitivity to pivots, with 4 as the sweet spot.
RSI Pivot Dot Signals:
Plots green dots at RSI oversold pivot lows below 30,
Plots red dots at overbought pivot highs above 70.
Helps detect short-term exhaustion or bounce zones, plotted right on the MACD-RSI curve.
RSI 50 Crosses (Optional):
Optional ▲ and ▼ labels when RSI crosses its 50 midline — useful for momentum trend shifts or pullback confirmation, or to detect consolidation.
Histogram:
Plotted as a column chart showing the distance between MACD and Signal Line.
Colored dynamically:
Bright green : Momentum rising above zero
Light green : Weakening above zero
Bright red : Momentum falling below zero
Light red : Weakening below zero
The zero line serves as the mid-point:
Above = Bullish Bias
Below = Bearish Bias
How to Interpret:
Momentum Confirmation:
Use MACD cross above Signal Line with a rising histogram to confirm breakouts or trend entries.
Histogram shrinking near zero = momentum weakening → caution or reversal.
Exhaustion & Reversals:
Dot signals near RSI extremes + histogram peak can suggest overbought/oversold pressure.
Use divergence labels ("D") to spot early reversal signals before price breaks structure.
Inputs & Settings:
RSI Length
Fast/Slow MA Lengths for MACD (applied to RSI)
Signal Line Length
MA Type: Choose between EMA and SMA for MACD and Signal Line
Pivot Sensitivity for dot markers
Divergence Logic Toggle
Show/hide RSI 50 Crosses
Best For:
Traders who want momentum insight from inside RSI, not price
Scalpers using divergence or exhaustion entries
Swing traders seeking entry confirmation from signal crossovers
Anyone using multi-timeframe confluence with RSI and trend filters
Pro Tips:
Combine this with:
Bollinger Bands breakouts and reversals
VWAP or EMAs to filter entries by trend
Volume spikes or BBW squeezes for volatility confirmation
TTM Scalper Alert to sync structure and momentum
Relative Strength Index (RSI)

Adaptive Strength MACD [UM]Indicator Description
Adaptive Strength MACD is an adaptive variant of the classic MACD that uses a customized Strength Momentum moving average for both its oscillator and signal lines. This makes the indicator more responsive in trending conditions and more stable in sideways markets.
Key Features
1. Adaptive Strength Momentum MA
Leverages the Adaptive Momentum Oscillator to scale smoothing coefficients dynamically.
2. Trend-Validity Filters
Optional ADX filter ensures signals only fire when trend strength (ADX) exceeds a user threshold.
3. Directional Filter (DI+) confirms bullish or bearish momentum.
4. Color-Coded Histogram
5. Bars turn bright when momentum accelerates, faded when slowing.
6. Grayed out when trend filters disqualify signals.
7. Alerts
Bullish crossover (histogram from negative to positive) and bearish crossover (positive to negative) only when filters validate trend.
Comparison with Regular MACD
1. Moving Averages
Classic MACD uses fixed exponential moving averages (EMAs) for its fast and slow lines, so the smoothing factor is constant regardless of how strong or weak price momentum is.
Adaptive Strength MACD replaces those EMAs with a dynamic “Strength Momentum” MA that speeds up when momentum is strong and slows down in quiet or choppy markets.
2. Signal Line Smoothing
In the classic MACD, the signal is simply an EMA of the MACD line, with one user-selected period.
In the Adaptive Strength MACD , the signal line also uses the Strength Momentum MA on the MACD series—so both oscillator and signal adapt together to the underlying momentum strength.
3. Responsiveness to Momentum
A static EMA reacts the same way whether momentum is surging or fading; you either get too-slow entries when momentum spikes or too-fast whipsaws in noise.
The adaptive MA in your indicator automatically gives you quicker crossovers when there’s a trending burst, while damping down during low-momentum chop.
4. Trend Validation Filters
The classic MACD has no built-in mechanism to know whether price is actually trending versus ranging—you’ll see crossovers in both regimes.
Adaptive Strength MACD includes optional ADX filtering (to require a minimum trend strength) and a DI filter (to confirm bullish vs. bearish directional pressure). When those filters aren’t met, the histogram grays out to warn you.
5. Histogram Coloring & Clarity
Typical MACD histograms often use two colors (above/below zero) or a simple ramp but don’t distinguish accelerating vs. decelerating moves.
Your version employs four distinct states—accelerating bulls, decelerating bulls, accelerating bears, decelerating bears—plus a gray “no-signal” state when filters fail. This makes it easy at a glance to see not just direction but the quality of the move.
6. False-Signal Reduction
Because the classic MACD fires on every crossover, it can generate whipsaws in ranging markets.
The adaptive MA smoothing combined with ADX/DI gating in your script helps suppress those false breaks and keeps you focused on higher-quality entries.
7. Ideal Use Cases
Use the classic MACD when you need a reliable, well-understood trend-following oscillator and you’re comfortable manually filtering choppy signals.
Choose Adaptive Strength MACD \ when you want an all-in-one, automated way to speed up in strong trends, filter out noise, and receive clearer visual cues and alerts only when conditions align.
How to Use
1. Setup
- Adjust Fast and Slow Length to tune sensitivity.
- Change Signal Smoothing to smooth the histogram reaction.
- Enable ADX/DI filters and set ADX Threshold to suit your preferred trend strength (default = 20).
2. Interpretation
- Histogram > 0: Short‐term momentum above long‐term → bullish.
- Histogram < 0: Short‐term below long‐term → bearish.
- Faded greyed bars indicate a weakening move; gray bars show filter invalidation.
How to Trade
Buy Setup:
- Histogram crosses from negative to positive.
- ADX ≥ threshold and DI+ > DI–.
- Look for confirmation (bullish candlestick patterns or support zone).
Sell Setup:
- Histogram crosses from positive to negative.
- ADX ≥ threshold and DI– > DI+.
- Confirm with bearish price action (resistance test or bearish pattern).
Stop & Target
- Place stop just below recent swing low (long) or above recent swing high (short).
- Target risk–reward of at least 1:2, or trail with a shorter‐period adaptive MA.

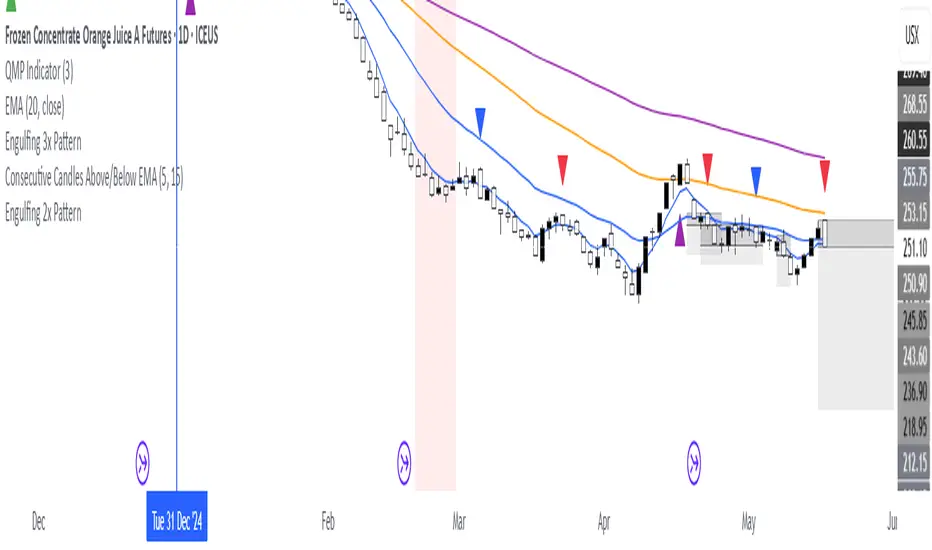
Consecutive Candles Above/Below EMADescription:
This indicator identifies and highlights periods where the price remains consistently above or below an Exponential Moving Average (EMA) for a user-defined number of consecutive candles. It visually marks these sustained trends with background colors and labels, helping traders spot strong bullish or bearish market conditions. Ideal for trend-following strategies or identifying potential trend exhaustion points, this tool provides clear visual cues for price behavior relative to the EMA.
How It Works:
EMA Calculation: The indicator calculates an EMA based on the user-specified period (default: 100). The EMA is plotted as a blue line on the chart for reference.
Consecutive Candle Tracking: It counts how many consecutive candles close above or below the EMA:
If a candle closes below the EMA, the "below" counter increments; any candle closing above resets it to zero.
If a candle closes above the EMA, the "above" counter increments; any candle closing below resets it to zero.
Highlighting Trends: When the number of consecutive candles above or below the EMA meets or exceeds the user-defined threshold (default: 200 candles):
A translucent red background highlights periods where the price has been below the EMA.
A translucent green background highlights periods where the price has been above the EMA.
Labeling: When the required number of consecutive candles is first reached:
A red downward arrow label with the text "↓ Below" appears for below-EMA streaks.
A green upward arrow label with the text "↑ Above" appears for above-EMA streaks.
Usage:
Trend Confirmation: Use the highlights and labels to confirm strong trends. For example, 200 candles above the EMA may indicate a robust uptrend.
Reversal Signals: Prolonged streaks (e.g., 200+ candles) might suggest overextension, potentially signaling reversals.
Customization: Adjust the EMA period to make it faster or slower, and modify the candle count to make the indicator more or less sensitive to trends.
Settings:
EMA Length: Set the period for the EMA calculation (default: 100).
Candles Count: Define the minimum number of consecutive candles required to trigger highlights and labels (default: 200).
Visuals:
Blue EMA line for tracking the moving average.
Red background for sustained below-EMA periods.
Green background for sustained above-EMA periods.
Labeled arrows to mark when the streak threshold is met.
This indicator is a powerful tool for traders looking to visualize and capitalize on persistent price trends relative to the EMA, with clear, customizable signals for market analysis.
Explain EMA calculation
Other trend indicators
Make description shorter
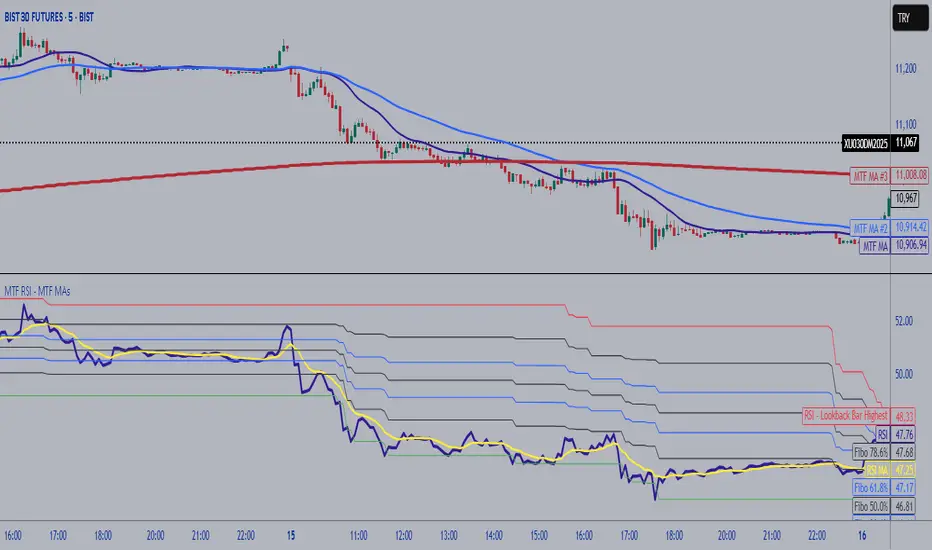
MTF RSI Fibonacci Levels & MTF Moving Avreages (EMA-SMA-WMA)Thanks for Kadir Türok Özdamar. @kadirturokozdmr
Formula Purpose of Use
This formula combines the traditional RSI indicator with Fibonacci levels to create a special technical indicator that aims to identify potential support and resistance points:
Thanks for Kadir Türok Özdamar. @kadirturokozdmr
Formula Purpose of Use
This formula combines the traditional RSI indicator with Fibonacci levels to create a special technical indicator that aims to identify potential support and resistance points:
Determines the historical RSI range of 144 periods (PEAK and DIP)
Calculates Fibonacci retracement levels within this range, and shows the direction of momentum by calculating the moving average of the RSI
This indicator can be used to identify potential reversal points, especially when the RSI is not in overbought (70+) or oversold (30-) areas.
Practical Use
Investors can use this indicator as follows:
1⃣When the RSI approaches one of the determined Fibonacci levels, it is considered a potential support/resistance area.
2⃣When the RSI approaches the DIP level, it can be interpreted as oversold, and when it approaches the PEAK level, it can be interpreted as overbought.
3⃣When the RSI crosses the SM (moving average) line upwards or downwards, it can be evaluated as a momentum change signal.
4⃣Fibonacci levels (especially M386, M500 and M618) can be monitored as important transition zones for the RSI.
--------------------------------------------
In this version, some features and a multi-timeframe averages (SMA-EMA-WMA) were added to the script. It was made possible for the user to enter multi-timeframe RSI and multi-timeframe Fibo lengths.
RSI with Divergences and Trendlines by zenDisplays the standard Relative Strength Index (RSI). The RSI period, line color, and thickness are customizable by the user (defaulting to a 14-period, thin black line).
Includes traditional horizontal lines at the 70 (overbought) and 30 (oversold) levels. The background area between these levels is filled with a customizable color (defaulting to a transparent black).
The indicator intelligently analyzes the RSI's own movements to identify significant recent turning points (peaks and troughs).
It then automatically draws short trendline segments directly on the RSI chart. These lines connect recent, consecutive RSI turning points, dynamically highlighting the indicator's internal structure and immediate directional momentum.
Users can configure the sensitivity used to detect these RSI turning points via 'Pivot Lookback' settings. You can also customize the maximum number of recent trendlines displayed for upward and downward RSI movements (default is 5 each), as well as their colors and width.
These on-RSI trendlines do not extend into the future.

RSI Hybrid ProfileThis is a Hybrid Script designed on the basis of a well know Indicator RSI - Relative strength Index, ATR, Standard Deviations and Medians. Effort is being made to present RSI in a Profile based concept to leverage and elevate trading signals and identify potential trade while effectively managing the RISK.
Trend Colour Coding :-
Green = Bullish
Red = Bearish
Gray = Mean Reversion/ Rangebound Markets
The script includes the following Elements
1) Candlestick chart of RSI of current time frame in lower pane :-
It helps to effectively compare the price action with that of RSI to clearly identify early breakouts or breakdowns in RSI as compared to price chart and identify early trade opportunities as well as Divergences
2) Higher Time Frame RSI :-
The orange line in the lower pane to help take analysis of Higher Timeframe, to evaluate and assess trend in more refined manner.
3) Point of Control Zone :-
The middle horizontal band with colour coding to highlight the Point of Control of the price action based on its relative strength.
4) Black Circles - POC Change Markers - RSI profile Value area Shifts :-
All the Black Circles plotted on chart are RSI Point of Controls, which signal upcoming Trend and should be closely watched as it can help identify wonderful Entry/Exit Opportunities.
5) Value Area :-
The horizontal lines above and below the POC Zones are the Value areas, they are extremely useful to identify the potential support/resistance zones during the trending markets and potential target zones during the mean reverting markets. The width also helps assess the underlying volatility and risk and can help in determining the position size based on it. The setting can be adjusted based on Value area Range Multiplier. 1 is the ideal setting as it represents 1 Standard Deviation of Data.
6) Trailing Stops :-
The Green Trailing line helps as trailing stoploss in buying positions and Red Trailing Line helps as trailing SL in Selling Positions. These are especially useful when price is far away from the value area zones or when volatility is very high. The setting can be adjusted based on trail multiplier in the settings.
Here are the few examples of how to use the script on different asset classes
1) Gold Futures - Exhibiting the use of trend and SL and how to change positions based on retracement and RSI Interpretation.
2)Nifty 50 - Exhibiting the importance of POC , RSI Divergence and Breakout and SL Trail and POC Change Markers
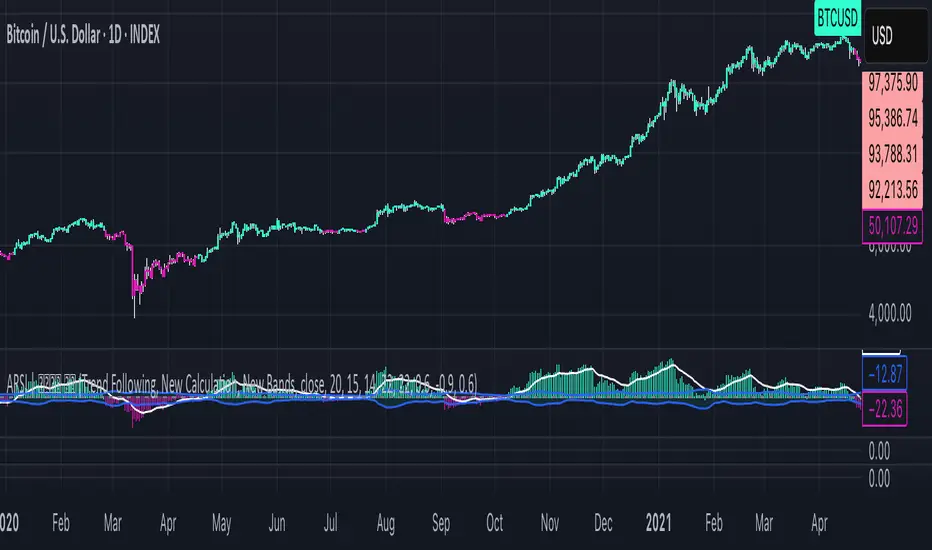
3) Bitcoin/US Dollar - Showing the use of Value areas as support zones and using RSI overbought and oversold regions to manage pullbacks and retracement confirmations.
4) JSW Energy Limited - Stock - Showing the combined use of the scripts elements in trading environment.
Feel Free to use it on Charts and leverage the power of this wonderful Indicator.

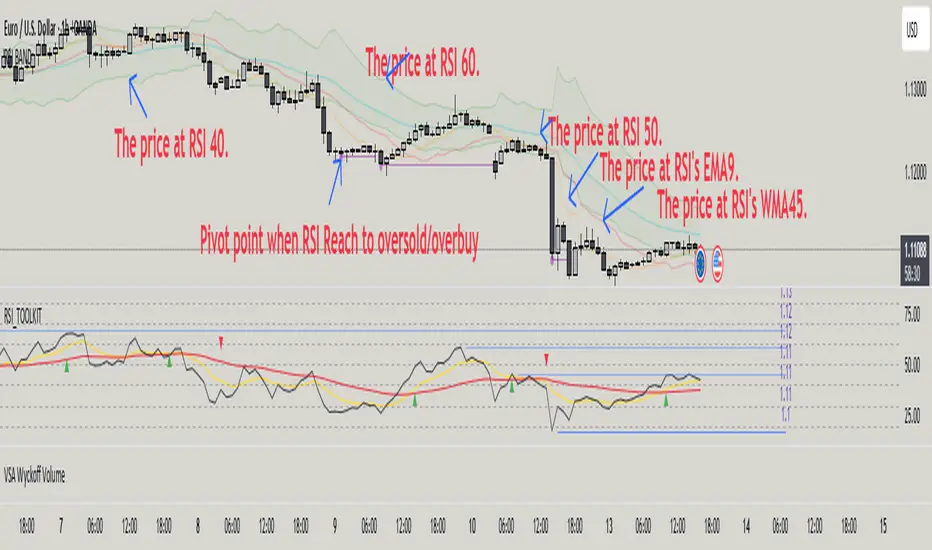
RSI BAND – RSI-Based Support & Resistance Levels📃 Description
RSI BAND is an original technical analysis tool that builds support and resistance levels based on the RSI (Relative Strength Index) indicator. This script is designed to enhance traders' understanding of RSI behavior and provide potential price zones where reversals or continuations may occur.
🔍 What it does
Calculates and visualizes horizontal levels on the price chart corresponding to RSI-based thresholds (e.g., RSI = 40, 50, 60).
Calculates and visualizes horizontal levels on the price chart corresponding to RSI's EMA9 & WMA45.
Detects pivot highs and lows in the RSI and marks corresponding price levels.
🎯 Key Features
🔺 RSI Resistance (e.g., RSI 60) and 🔻 RSI Support (e.g., RSI 40) levels calculated as price zones.
📉 Real-time calculation of price levels that correspond to RSI EMA (9) and RSI WMA (45).
🌀 Detects RSI Pivot Lows and Pivot Highs.
🎯 Includes alerts for Pivot points.
🧩 Fully configurable visibility and styling options for each plotted level.
🔬 How to read data
✅ How to Use
Use this indicator to:
See price action at key RSI levels (40, 50, 60) and RSI's EMA & WMA: For setting up reversal entries.
Identify RSI's pivot points at overbought or oversold levels: For setting up divergence entries.
📊 Visualizing RSI-Based Levels for Price Action
This script plots key RSI-based levels directly onto the chart, such as RSI support, resistance, and the 50-level, to help traders to easily see price action at key RSI zones.
The RSI Resistance and RSI Support levels (such as RSI = 60 and RSI = 40), RSI's EMA9 & WMA45 are plotted on the chart. These levels act as significant price action zones, where traders can anticipate potential reactions from the price based on the RSI's behavior.
By visualizing these levels as plots on the chart, traders can quickly see where price is in relation to these key RSI thresholds, allowing them to make more informed decisions when the price approaches these zones. For example, if the price is near the RSI resistance zone (RSI = 60), it might indicate a potential resistance area where the price could face selling pressure.
By utilizing these RSI-based plots, this script provides a clear, visual representation of key levels, enabling traders to make quicker and more confident decisions in relation to the price action and RSI dynamics.
🧠 Underlying Logic
The script uses standard RSI calculation (length = 14), combined with a reverse-engineered formula to calculate the required price change to reach a specific RSI value. This unique approach creates realistic price levels aligned with RSI expectations, unlike traditional static zones.
Function to calculate price from RSI level:
f_calc_target_price(targetRSI, close_price, avgGain, avgLoss, rsiLength) =>
targetRS = 100 / (100 - targetRSI) - 1
if targetRSI >= 50
requiredGain = targetRS * avgLoss - avgGain
requiredChange = requiredGain * rsiLength
close_price + requiredChange
else
requiredLoss = avgGain / targetRS - avgLoss
requiredChange = requiredLoss * rsiLength
close_price - requiredChange
Depending on whether the target RSI is above or below 50:
If RSI ≥ 50, the function estimates the additional gain needed to raise the RSI to the target, and adds the corresponding value to the current price.
If RSI < 50, it estimates the required loss and subtracts that value from the current price.
⚠️ Important Notes
Pivot Detection Offset: The script uses an offset of 3 bars to identify pivot points. This means that the pivot high and low points are calculated using the values from 3 bars before the current one. As a result, the pivot points may appear slightly delayed compared to the most recent price action.
No Lookahead Bias: The script does not rely on future data (lookahead bias). It strictly uses past price information for all calculations to maintain accuracy and avoid misleading results. The pivot points are plotted after the price has already formed, ensuring that the script does not predict future price movement but rather reacts to established patterns.
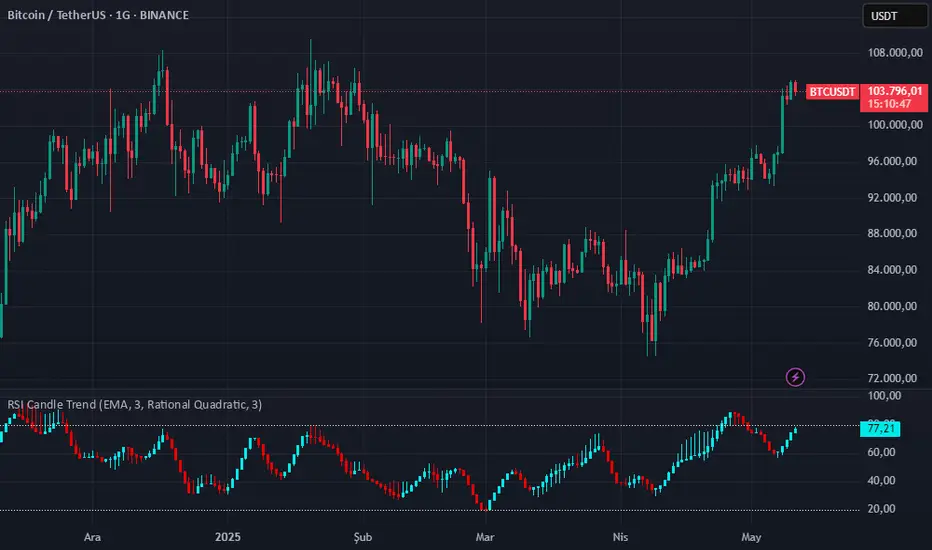
RSI Candle Trend🎯 Purpose:
This TradingView script is designed to visualize trend strength using RSI values as candle data, instead of traditional price candles. It transforms RSI data into custom candles using various smoothing and filtering methods (like Heikin-Ashi, Linear Regression, Rational Quadratic Filter, or McGinley Dynamic). It allows traders to:
📌Track RSI-based momentum using visual candle representation
📌Apply advanced smoothing/filters to the RSI to reduce noise
📌Highlight candle trend strength using dynamic coloring
📌Identify overbought/oversold zones using reference lines (RSI 80 and 20)
🧩 How It Works:
It calculates RSI values for open, high, low, close prices.
These RSI values are then optionally smoothed with user-selected moving averages (EMA, SMA, etc.).
Depending on the selected mode (Normal, Heikin-Ashi, Linear, Rational Quadratic), the RSI values are transformed into synthetic candles.
Candles are colored cyan (uptrend) or red (downtrend) based on RSI movement.
⚙️ Key Inputs:
Method: Type of moving average to smooth the RSI (e.g. EMA, SMA, VWMA, etc.)
Length: Length for RSI and smoothing filters
Candle: Type of candle transformation (Normal, Heikin-Ashi, Linear, Rational Quadratic)
Rational Quadratic: Parameter for the Rational Quadratic smoothing method
📊 Outputs:
Custom candles plotted using RSI-transformed values
Candle colors based on RSI strength:
Cyan for strong bullish RSI movement
Red for strong bearish RSI movement
Horizontal lines at RSI levels 80 and 20 (overbought/oversold)
🧠 Why Use This Indicator?
Unlike traditional RSI indicators that show a line, this tool:
Converts RSI into candle-style visualization
Helps traders visually interpret trend strength, reversals, or continuation patterns
Offers more refined control over RSI behavior and filtering
Provides a unique blend of momentum and candle analysis
❗Important Note:
This script is provided for educational purposes and does not constitute financial advice. Traders and investors should conduct their research and analysis before making any trading decisions.
AP IFTCCIv2/IFTStoch/IFTRSI Multi-TimeframeMulti-Timeframe IFT-CCI/Stoch/RSI Composite
This enhanced indicator combines three powerful oscillators—Inverse Fisher Transform (IFT) versions of the Commodity Channel Index (CCI), Stochastic, and Relative Strength Index (RSI)—into a unified multi-timeframe analysis tool. Originally developed by John Ehlers (pioneer of cyclical analysis and signal processing in trading systems) and adapted by KIVANC (@fr3762), this version adds dual-timeframe capability to compare indicator values across different chart resolutions.
Key Features:
Triple Oscillator Composite
IFT-CCI: Smoothed CCI values transformed via Ehlers' Inverse Fisher Transform (blue-gold)
IFT-Stochastic: Classic stochastic oscillator processed through IFT (blue)
IFT-RSI: RSI oscillator converted to IFT format (magenta)
Composite Average Line: Combined average of all three indicators (green)
Multi-Timeframe Analysis
Compare primary and secondary timeframes (e.g., 1H vs. 4H, daily vs. weekly)
Primary timeframe plots use solid lines with 80% opacity
Secondary timeframe (optional) uses dashed/circle markers with 40% opacity
Key Levels
Overbought (+0.75) and oversold (-0.75) reference lines
Zero-centerline for momentum direction bias
Applications:
Trend Confirmation: Align higher timeframe signals with lower timeframe entries
Divergence Detection: Spot inter-timeframe discrepancies in momentum
Regime Filter: Use higher timeframe composite values to filter trades
Technical Basis:
Inverse Fisher Transform: Compresses oscillator values into bounded (-1 to +1) range while emphasizing extreme moves
Dual WMA Smoothing: Combines initial calculation smoothing (WMA1) with final output smoothing (WMA2)
Exponential Scaling: (e^2x - 1)/(e^2x + 1) formula converts Gaussian-like distributions to bounded outputs
Credits:
Original Concept: John Ehlers (IFT methodology, cyclical analysis foundations)
Initial Implementation: KIVANC (@fr3762 on Twitter) for the base IFT-CCI/Stoch/RSI script
Multi-Timeframe Adaptation: for cross-resolution analysis capabilities
This tool is particularly effective for traders seeking to align multiple timeframes while using Ehlers' noise-reduction techniques. The composite average line provides a consensus view, while the individual oscillators help identify component strength/weakness.

BooRSI📘 BooRSI – Multi-Dimensional RSI Framework with Advanced Visual Context
BooRSI is not just another RSI overlay. It is a multi-layered momentum framework that blends traditional RSI dynamics with a set of enhanced visual and structural components to help traders identify market imbalances, momentum shifts, and confluence zones across multiple timeframes. The indicator was designed to assist both discretionary and systematic traders in spotting RSI-based inflection points with greater clarity and context.
🔍 What Makes BooRSI Different?
Unlike standard RSI tools, BooRSI provides a modular visualization layer that lets you:
View RSI in both candle format and classic line mode, making intrabar momentum shifts visible.
Plot dynamic or static Fibonacci retracement levels directly on the RSI scale — useful for identifying confluence between RSI pullbacks and trend continuation zones.
Activate a weekly RSI vs weekly RSI MA crossover highlight, enabling long-term trend filters directly within the intraday or daily RSI window.
Apply subtle gradient band fills to the 30–50–70 zones to enhance zone memory without overwhelming the visual space.
Toggle a custom RSI Moving Average for smoother signal interpretation.
🧠 Underlying Logic & Structure
RSI Calculation: Classic RSI with adjustable OHLC input (default: close). When in “Candle Mode,” it uses RSI(Open), RSI(High), RSI(Low), RSI(Close) to form OHLC candles for intrabar detail.
RSI MA Filter: A secondary SMA (default: 14) smooths RSI values to assist in trend determination.
Fibonacci Mapping: Based on a fixed or dynamic length (default: 55), key Fib levels (38.2%, 50%, 61.8%, etc.) are plotted on the RSI window to map out overreaction or pullback zones.
Multi-Timeframe Context: The system calculates weekly RSI and its moving average, then uses background highlights to show whether the current trend aligns with the higher timeframe momentum direction.
⚙️ Default Settings
Parameter Default Description
RSI Length 14 Base RSI period
RSI MA Length 14 SMA on RSI for trend filtering
Fibonacci Lookback 55 Length for Fibo level projections
Show 30/50/70 Bands True Gradient fill zones for RSI decision zones
Show Fibonacci Levels False Optional – static/dynamic Fib lines on RSI
Candle Mode False Switch between RSI line and RSI OHLC candles
Fibo Style Toggle True Switch between solid, dashed or dotted lines
🎯 Best Use Cases
Momentum Filters: For trend-based strategies, use RSI-MA and HTF background for filter alignment.
Reversal Signals: Use RSI candles to spot strong rejection patterns inside extreme zones.
Mean-Reversion Timing: Combine Fibonacci levels with 30–70 bands to fine-tune entries.
⚠️ Important Note
This is a closed-source indicator due to proprietary RSI candle mapping logic and unique Fibonacci interaction methods. However, this description fully discloses how the tool works and how it adds value beyond a basic RSI implementation.
BooRSI – Çok Katmanlı RSI Çerçevesi
BooRSI, klasik RSI göstergesini birden fazla katmanda zenginleştirerek momentum değişimlerini, aşırı alım/aşırı satım bölgelerini ve farklı zaman dilimi trendlerini daha net görmenizi sağlar:
Çubuk ve Çizgi Modu: RSI’yı hem OHLC mumları hem de klasik çizgi olarak gösterebilir, böylece intrabar hareketleri de izlenebilir.
RSI MA Filtreleme: RSI üzerine uygulanan SMA (varsayılan 14) trend yönünü belirlemenize yardımcı olur.
Fibonacci Seviyeleri: RSI ölçeği üzerinde dinamik veya sabit Fibonacci retracement çizgileri (38.2%, 50%, 61.8% vb.) ekleyerek dönüş ve devam bölgelerini tespit eder.
Haftalık Konteks: Günlük veya daha kısa zaman diliminde, haftalık RSI ve haftalık RSI MA kesişimlerini arka plan rengiyle vurgular.
Gradient 30/50/70 Bantları: Karar bölgelerini boğucu olmayan degradelerle öne çıkarır.
Bu kapalı kaynak gösterge, RSI mum haritalama ve Fib etkileşimindeki özgün mantığı nedeniyle gizlidir; açıklama ise nasıl çalıştığını tam olarak ortaya koyar.

Adaptive Volume-Weighted RSI (AVW-RSI)Concept Summary
The AVW-RSI is a modified version of the Relative Strength Index (RSI), where each price change is weighted by the relative trading volume for that period. This means periods of high volume (typically driven by institutions or “big money”) have a greater influence on the RSI calculation than periods of low volume.
Why AVW-RSI Helps Traders
Avoids Weak Signals During Low Volume
Standard RSI may show overbought/oversold zones even during low-volume periods (e.g., during lunch hours or after news).
AVW-RSI gives less weight to these periods, avoiding misleading signals.
Amplifies Strong Momentum Moves
If RSI is rising during high volume, it's more likely driven by institutional buying—AVW-RSI reflects that stronger by weighting the RSI component.
Filters Out Retail Noise
By prioritizing high-volume candles, it naturally discounts fakeouts caused by thin markets or retail-heavy moves.
Highlights Institutional Entry/Exit
Useful for spotting hidden accumulation/distribution that classic RSI would miss.
How It Works (Calculation Logic)
Traditional RSI Formula Recap
RSI = 100 - (100 / (1 + RS))
RS = Average Gain / Average Loss (over N periods)
Modified Step – Apply Volume Weight
For each period
Gain_t = max(Close_t - Close_{t-1}, 0)
Loss_t = max(Close_{t-1} - Close_t, 0)
Weight_t = Volume_t / AvgVolume(N)
WeightedGain_t = Gain_t * Weight_t
WeightedLoss_t = Loss_t * Weight_t
Weighted RSI
AvgWeightedGain = SMA(WeightedGain, N)
AvgWeightedLoss = SMA(WeightedLoss, N)
RS = AvgWeightedGain / AvgWeightedLoss
AVW-RSI = 100 - (100 / (1 + RS))
Visual Features on Chart
Line Color Gradient
Color gets darker as volume weight increases, signaling stronger conviction.
Overbought/Oversold Zones
Traditional: 70/30
Suggested AVW-RSI zones: Use dynamic thresholds based on historical volatility (e.g., 80/20 for high-volume coins).
Volume Spike Flags
Mark RSI turning points that occurred during volume spikes with a special dot/symbol.
Trading Strategies with AVW-RSI
1. Weighted RSI Divergence
Regular RSI divergence becomes more powerful when volume is high.
AVW-RSI divergence with volume spike is a strong signal of reversal.
2. Trend Confirmation
RSI crossing above 50 during rising volume is a good entry signal.
RSI crossing below 50 with high volume is a strong exit or short trigger.
3. Breakout Validation
Price breaking resistance + AVW-RSI > 60 with volume = Confirmed breakout.
Price breaking but AVW-RSI < 50 or on low volume = Potential fakeout.
Example Use Case
Stock XYZ is approaching a resistance zone. A trader sees:
Standard RSI: 65 → suggests strength.
Volume is 3x the average.
AVW-RSI: 78 → signals strong momentum with institutional backing.
The trader enters confidently, knowing this isn't just low-volume hype.
Limitations / Tips
Works best on liquid assets (Forex majors, large-cap stocks, BTC/ETH).
Should be used alongside price action and volume analysis—not standalone.
Periods of extremely high volume (news events) might need smoothing to avoid spikes.

Precision Trend Shot | JeffreyTimmermansPrecision Trend Shot
The "Precision Trend Shot" Indicator is an advanced technical tool designed to provide a dynamic and adaptive view of market trends. By combining three core components—RSI Oscillator, LSMA ATR, and Adaptable Trend—this indicator delivers precise signals that help traders identify market direction, volatility, and potential trend reversals. The calculated total score, derived from these components, provides a clear, actionable view of market conditions.
Key Features
Multi-Component Analysis: Integrates three key indicators (RSI, LSMA ATR, and Adaptable Trend) for a comprehensive view of market trends.
Dynamic Trend Classification: Categorizes market states as "Bullish" or "Bearish", based on a combined score.
Standard Deviation Bands: Displays standard deviation bands around the score line for enhanced volatility visualization.
Gradient Background Coloring: Visually highlights market phases with gradient colors, aiding quick interpretation.
Customizable Visuals: Offers extensive settings for coloring, background gradients, and signal visibility.
Real-Time Alerts: Generates alerts for significant trend changes or transitions between market states.
Inputs & Settings
RSI Settings:
RSI Source: Default: Close price. Defines the data source for RSI calculation.
RSI Length: Default: 10. Sets the period for calculating RSI.
LSMA ATR Settings:
LSMA Source: Default: Close price. Defines the data source for LSMA calculation.
LSMA Length: Default: 21. Sets the period for calculating the Least Squares Moving Average.
ATR Length: Default: 12. Sets the period for calculating the Average True Range.
Adaptable Trend Settings:
Trend Length: Default: 5. Sets the period for calculating the trend.
Smoothing Length: Default: 5. Controls the smoothing of trend volatility.
Sensitivity: Default: 1.5. Adjusts the sensitivity of trend bands.
Standard Deviation Settings:
Enable Standard Deviation Bands: Default: True. Toggles the display of standard deviation bands.
Standard Deviation Length: Default: 20. Sets the period for standard deviation calculation.
Standard Deviation Multiplier: Default: 2.0. Adjusts the width of the bands.
Smoothing Length: Default: 5. Controls the smoothing of standard deviation bands.
Visual Settings:
Enable Candle Coloring: Default: True. Colors candles based on market state (Bullish or Bearish).
Enable Background Gradient: Default: True. Applies gradient coloring to the background based on trend direction.
Score Line Colors: Customize colors for bullish or bearish score lines.
Calculation Process
RSI Calculation:
Computes the Relative Strength Index (RSI) of the selected source data.
Signals bullish (RSI > 50) or bearish (RSI < 50) conditions.
LSMA ATR Calculation:
Computes LSMA for trend direction and ATR for volatility measurement.
Generates buy and sell signals based on crossover and crossunder of ATR bands.
Adaptable Trend Calculation:
Calculates dynamic trend levels using EMA and standard deviation bands.
Classifies trend states as Bullish or Bearish.
Combined Signal Calculation:
Averages the signals from RSI, LSMA ATR, and Adaptable Trend to generate a total score.
Classifies the market as "Bullish" or "Bearish" based on this score.
Standard Deviation Bands:
Plots standard deviation bands around the combined signal for enhanced volatility analysis.
Gradient Background Coloring:
Colors the chart background based on the identified market state (Bullish or Bearish).
How to Use the Precision Trend Shot Indicator
Identifying Market States:
Bullish Market: Total score > 0, gradient background green.
Bearish Market: Total score < 0, gradient background red.
Confirming Signals:
Use RSI and LSMA ATR signals for early indications.
Use Trend Recon for confirming longer-term trend direction.
Visualizing Volatility:
Standard deviation bands highlight potential reversal zones.
Dynamic Alerts
The Precision Trend Shot Indicator includes a robust alert system for real-time market transitions:
Bullish to Bearish: Market shifts from a bullish to bearish trend.
Bearish to Bullish: Market shifts from a bearish to bullish trend.
Conclusion
The Precision Trend Shot Indicator is an advanced, versatile tool for identifying market trends, visualizing volatility, and generating actionable signals. With customizable settings, dynamic alerts, and clear visual representation, it is an essential addition to any trader’s toolkit.
-Jeffrey

EMA Cloud with Custom MAs and RSI [deepakks444]This all-in-one technical analysis tool merges an EMA Cloud, customizable dual moving averages (MA1 & MA2), and an advanced RSI oscillator with divergence detection, smoothing, and alerts.
Designed for traders who rely on trend direction, momentum, and reversal confluence, this indicator helps filter high-probability setups and reduces the need to juggle multiple indicators on the chart.
🔍 Components and Features
🔸 1. EMA Cloud (Trend Filter)
A lightweight 3-period EMA manually calculated using exponential smoothing.
Two EMAs: One tracking highs and one tracking lows.
Creates a "cloud" between them to visually represent short-term trend direction.
Cloud color logic:
🟢 Green: Price is bullish, staying above the EMA cloud.
🔴 Red: Price is bearish, below the EMA cloud.
🟡 Yellow: Price is indecisive or in consolidation.
Why it's useful:
The EMA Cloud helps identify the immediate short-term bias of the market. It quickly reacts to price and gives a clear visual guide for trend-following or pullback trades.
🔸 2. Custom Moving Averages (MA1 & MA2)
Both MA1 and MA2 are user-configurable in type, length, and price source.
Supported types include:
SMA, EMA, WMA, HMA, RMA, VWMA.
Color logic:
🟩 Green: MA1 is below MA2 (bullish alignment).
🟥 Red: MA1 is above MA2 (bearish alignment).
Why include this?
MA crossovers are a classic way to determine medium/long-term trend shifts or confirm trend continuation. The flexibility allows users to tailor them to suit any strategy—from mean reversion to trend-following.
🔸 3. RSI Oscillator with Enhancements
This is more than a basic RSI—it's been expanded to become a momentum engine and divergence detector, complete with alerting and smoothing options.
Main features:
✅ Customizable RSI Source & Length
✅ Colored RSI Zones:
RSI > 60 → Overbought strength zone (green background).
RSI < 40 → Oversold weakness zone (red background).
Neutral background in between.
✅ Smoothing Options:
Apply additional MA smoothing to RSI: SMA, EMA, WMA, RMA, VWMA, or even SMA + Bollinger Bands.
Visualizes volatility around RSI for breakout/reversal analysis.
✅ RSI Alerts:
Alert when RSI crosses above 60 → potential bullish momentum.
Alert when RSI crosses below 40 → potential bearish momentum.
✅ Divergence Detection (Optional):
Bullish Divergence: Price makes lower low while RSI makes higher low → Possible reversal up.
Bearish Divergence: Price makes higher high while RSI makes lower high → Possible reversal down.
Marks divergence using “Bull” and “Bear” labels directly on the RSI pane.
Why enhance RSI?
The RSI is a cornerstone of momentum trading. By adding zone shading, volatility overlays, and divergence detection, traders can better assess:
Whether a trend is strong or weakening.
Whether to enter on continuation or wait for reversal.
Spot early signs of price turning points using divergence patterns.
🤝 Why Merge These Three Systems?
Combining EMA Cloud + MAs + RSI in a single tool allows traders to:
Avoid conflicting signals by seeing multiple confirmations in one view.
Reduce chart clutter by replacing multiple indicators with one efficient visual system.
Get trend, momentum, and reversal analysis all-in-one:
EMA Cloud = short-term trend.
MA1/MA2 = medium-term trend & crossover confirmation.
RSI = momentum extremes, breakout confirmation, or divergence reversal zones.
🔔 Built-in Alerts
RSI crosses above 60 → Potential buy signal.
RSI crosses below 40 → Potential sell signal.
These alerts can be used to automate notifications, integrate with webhook systems, or trigger manual reviews.
⚠️ Disclaimer
This script is provided for educational and informational purposes only. It is not financial advice, and past performance is not indicative of future results. Always use proper risk management and verify signals with your own analysis before trading.

Adaptive RSI | Lyro RSThe Adaptive RSI | 𝓛𝔂𝓻𝓸 𝓡𝓢 indicator enhances the traditional Relative Strength Index (RSI) by integrating adaptive smoothing techniques and dynamic bands. This design aims to provide traders with a nuanced view of market momentum, highlighting potential trend shifts and overbought or oversold conditions.
Key Features
Adaptive RSI Calculation: Combines fast and slow Exponential Moving Averages (EMAs) of the RSI to capture momentum shifts effectively.
Dynamic Bands: Utilizes a smoothed standard deviation approach to create upper and lower bands around the adaptive RSI, aiding in identifying extreme market conditions.
Signal Line: An additional EMA of the adaptive RSI serves as a signal line, assisting in confirming trend directions.
Customizable Color Schemes: Offers multiple predefined color palettes, including "Classic," "Mystic," "Accented," and "Royal," with an option for users to define custom colors for bullish and bearish signals.
How It Works
Adaptive RSI Computation: Calculates the difference between fast and slow EMAs of the RSI, producing a responsive oscillator that adapts to market momentum.
Band Formation: Applies a smoothing factor to the standard deviation of the adaptive RSI, generating dynamic upper and lower bands that adjust to market volatility.
Signal Line Generation: Computes an EMA of the adaptive RSI to act as a signal line, providing additional confirmation for potential entries or exits.
Visualization: Plots the adaptive RSI as color-coded columns, with colors indicating bullish or bearish momentum. The dynamic bands are filled to visually represent overbought and oversold zones.
How to Use
Identify Momentum Shifts: Observe crossovers between the adaptive RSI and the signal line to detect potential changes in trend direction.
Spot Overbought/Oversold Conditions: Monitor when the adaptive RSI approaches or breaches the dynamic bands, signaling possible market extremes.
Customize Visuals: Select from predefined color palettes or define custom colors to align the indicator's appearance with personal preferences or chart themes.
Customization Options
RSI and EMA Lengths: Adjust the lengths of the RSI, fast EMA, slow EMA, and signal EMA to fine-tune the indicator's sensitivity.
Band Settings: Modify the band length, multiplier, and smoothing factor to control the responsiveness and width of the dynamic bands.
Color Schemes: Choose from predefined color modes or enable custom color settings to personalize the indicator's appearance.
⚠️ DISCLAIMER ⚠️: This indicator alone is not reliable and should be combined with other indicator(s) for a stronger signal.
RSI-EMA-Crossing with Donchian-Stop-LossThe Donchian RSI Indicator is a visual tool that combines momentum and trend analysis to identify high-quality long opportunities based on RSI crossovers, price action, and Donchian channel dynamics.
How It Works
Momentum Signal: A bullish RSI crossover is detected when the RSI crosses above its moving average.
Trend Filter: A signal is only valid if the crossover occurs while the price is above its moving average – filtering out entries against the prevailing trend.
Signal Candle: The high of the crossover candle is stored.
Entry Trigger: A valid signal occurs when a later candle closes above that signal high.
Stop-Loss (Visual Only)
The lower band of the Donchian Channel acts as a visual reference for a dynamic stop-loss level.
Features
Customizable RSI, Donchian Channel, and moving average lengths
Selectable MA types: SMA, EMA, WMA, VWMA, HMA
Signal candle highlighted (yellow background)
Entry points labeled on the chart
Price MA and Donchian Channel plotted
Trend filter improves signal quality by confirming upward bias
Use Case
Designed for swing and position traders
Optimized for use on daily or 4H charts

RSI Fibonacci LevelsThank for
Kadir Türok Özdamar - @kadirturokozdmr
Formula Purpose of Use
This formula combines the traditional RSI indicator with Fibonacci levels to create a special technical indicator that aims to identify potential support and resistance points:
Determines the historical RSI range of 144 periods (PEAK and DIP)
Calculates Fibonacci retracement levels within this range, and shows the direction of momentum by calculating the moving average of the RSI
This indicator can be used to identify potential reversal points, especially when the RSI is not in overbought (70+) or oversold (30-) areas.
Practical Use
Investors can use this indicator as follows:
1⃣When the RSI approaches one of the determined Fibonacci levels, it is considered a potential support/resistance area.
2⃣When the RSI approaches the DIP level, it can be interpreted as oversold, and when it approaches the PEAK level, it can be interpreted as overbought.
3⃣When the RSI crosses the SM (moving average) line upwards or downwards, it can be evaluated as a momentum change signal.
4⃣Fibonacci levels (especially M386, M500 and M618) can be monitored as important transition zones for the RSI.
With this indicator, we aim to develop the traditional RSI usage and produce more nuanced buy-sell signals.
Turkish :
Formula Purpose of Use
This formula combines the traditional RSI indicator with Fibonacci levels to create a special technical indicator that aims to identify potential support and resistance points:
Determines the historical RSI range of 144 periods (PEAK and DIP)
Calculates Fibonacci retracement levels within this range, and shows the direction of momentum by calculating the moving average of the RSI
This indicator can be used to identify potential reversal points, especially when the RSI is not in overbought (70+) or oversold (30-) areas.
Practical Use
Investors can use this indicator as follows:
1⃣When the RSI approaches one of the determined Fibonacci levels, it is considered a potential support/resistance area.
2⃣When the RSI approaches the DIP level, it can be interpreted as oversold, and when it approaches the PEAK level, it can be interpreted as overbought.
3⃣When the RSI crosses the SM (moving average) line upwards or downwards, it can be evaluated as a momentum change signal.
4⃣Fibonacci levels (especially M386, M500 and M618) can be monitored as important transition zones for the RSI.
With this indicator, we aim to develop the traditional RSI usage and produce more nuanced buy-sell signals.

C&B Auto MK5C&B Auto MK5.2ema BullBear
Overview
The C&B Auto MK5.2ema BullBear is a versatile Pine Script indicator designed to help traders identify bullish and bearish market conditions across various timeframes. It combines Exponential Moving Averages (EMAs), Relative Strength Index (RSI), Average True Range (ATR), and customizable time filters to generate actionable signals. The indicator overlays on the price chart, displaying EMAs, a dynamic cloud, scaled RSI levels, bull/bear signals, and market condition labels, making it suitable for swing trading, day trading, or scalping in trending or volatile markets.
What It Does
This indicator generates bull and bear signals based on the interaction of two EMAs, filtered by RSI thresholds, ATR-based volatility, a 50/200 EMA trend filter, and user-defined time windows. It adapts to market volatility by adjusting EMA lengths and RSI thresholds. A dynamic cloud highlights trend direction or neutral zones, with candlestick coloring in neutral conditions. Market condition labels (current and historical) provide real-time trend and volatility context, displayed above the chart.
How It Works
The indicator uses the following components:
EMAs: Two EMAs (short and long) are calculated on a user-selected timeframe (1, 5, 15, 30, or 60 minutes). Their crossover or crossunder triggers potential bull/bear signals. EMA lengths adjust based on volatility (e.g., 10/20 for volatile markets, 5/10 for non-volatile).
Dynamic Cloud: The area between the EMAs forms a cloud, colored green for bullish trends, red for bearish trends, or a user-defined color (default yellow) for neutral zones (when EMAs are close, determined by an ATR-based threshold). Users can widen the cloud for visibility.
RSI Filter: RSI is scaled to price levels and plotted on the chart (optional). Signals are filtered to ensure RSI is within volatility-adjusted bull/bear thresholds and not in overbought/oversold zones.
ATR Volatility Filter: An optional filter ensures signals occur during sufficient volatility (ATR(14) > SMA(ATR, 20)).
50/200 EMA Trend Filter: An optional filter restricts bull signals to bullish trends (50 EMA > 200 EMA) and bear signals to bearish trends (50 EMA < 200 EMA).
Time Filter: Signals are restricted to a user-defined UTC time window (default 9:00–15:00), aligning with active trading sessions.
Market Condition Labels: Labels above the chart display the current trend (Bullish, Bearish, Neutral) and optionally volatility (e.g., “Bullish Volatile”). Up to two historical labels persist for a user-defined number of bars (default 5) to show recent trend changes.
Visual Aids: Bull signals appear as green triangles/labels below the bar, bear signals as red triangles/labels above. Candlesticks in neutral zones are colored (default yellow).
The indicator ensures compatibility with standard chart types (e.g., candlestick or bar charts) to produce realistic signals, avoiding non-standard types like Heikin Ashi or Renko.
How to Use It
Add to Chart: Apply the indicator to a candlestick or bar chart on TradingView.
Configure Settings:
Timeframe: Choose a timeframe (1, 5, 15, 30, or 60 minutes) to match your trading style.
Filters:
Enable/disable the ATR volatility filter to focus on high-volatility periods.
Enable/disable the 50/200 EMA trend filter to align signals with the broader trend.
Enable the time filter and set custom UTC hours/minutes (default 9:00–15:00).
Cloud Settings: Adjust the cloud width, neutral zone threshold, color, and transparency.
EMA Colors: Use default trend-based colors or set custom colors for short/long EMAs.
RSI Display: Toggle the scaled RSI and its thresholds, with customizable colors.
Signal Settings: Toggle bull/bear labels and set signal colors.
Market Condition Labels: Toggle current/historical labels, include/exclude volatility, and adjust decay period.
Interpret Signals:
Bull Signal: A green triangle or “Bull” label below the bar indicates potential bullish momentum (EMA crossover, RSI above bull threshold, within time window, passing filters).
Bear Signal: A red triangle or “Bear” label above the bar indicates potential bearish momentum (EMA crossunder, RSI below bear threshold, within time window, passing filters).
Neutral Zone: Yellow candlesticks and cloud (if enabled) suggest a lack of clear trend; consider range-bound strategies or avoid trading.
Market Condition Labels: Check labels above the chart for real-time trend (Bullish, Bearish, Neutral) and volatility status to confirm market context.
Monitor Context: Use the cloud, RSI, and labels to assess trend strength and volatility before acting on signals.
Unique Features
Volatility-Adaptive EMAs: Automatically adjusts EMA lengths based on ATR to suit volatile or non-volatile markets, reducing manual configuration.
Neutral Zone Detection: Uses an ATR-based threshold to identify low-trend periods, helping traders avoid choppy markets.
Scaled RSI Visualization: Plots RSI and thresholds directly on the price chart, simplifying momentum analysis relative to price.
Flexible Time Filtering: Supports precise UTC-based trading windows, ideal for day traders targeting specific sessions.
Historical Market Labels: Displays recent trend changes (up to two) with a decay period, providing context for market shifts.
50/200 EMA Trend Filter: Aligns signals with the broader market trend, enhancing signal reliability.
Notes
Use on standard candlestick or bar charts to ensure accurate signals.
Test the indicator on a demo account to optimize settings for your market and timeframe.
Combine with other analysis (e.g., support/resistance, volume) for better decision-making.
The indicator is not a standalone system; use it as part of a broader trading strategy.
Limitations
Signals may lag in fast-moving markets due to EMA-based calculations.
Neutral zone detection may vary in extremely volatile or illiquid markets.
Time filters are UTC-based; ensure your platform’s timezone settings align.
This indicator is designed for traders seeking a customizable, trend-following tool that adapts to volatility and provides clear visual cues with robust filtering for bullish and bearish market conditions.

Triple Stoch and RSI (4 assets)4 Hour Green Dots -
This indicator looks at four different assets and shows when the RSI and 3 different stochastic RSI levels are all oversold.
You can optionally add Red dots when they are all overbought but doesn't seem to be as accurate.
The assets and levels are all customizable.

JuiceBox CRSI EnhancedJuiceBox “CRSI Enhanced” is a single-pane, zero-lag Connors RSI indicator supercharged with multi-theory lenses, Jurik smoothing, and multi-timeframe consensus.
1. Base Oscillator (JL-CRSI):
- Computes Connors RSI (3‐period price RSI, 2‐period streak RSI, 100-period percentile rank)
- Smooths it with a true Jurik Moving Average (configurable length & phase)
2. Sliding‐Window Divergence Filter:
- Detects classic price–indicator divergences over a recent look-back window
- Only lets signals fire when CRSI and price lows or highs diverge in the same direction
3. MTF Consensus (Ultra-product):
- For each lens, checks that at least 2 of {1m, 3m, 5m, 15m} agree on the same condition
- Ensures you see only the tightest, zero-lag multi-timeframe confirmation
4. Four “Lenses” (overlaid on the CRSI line):
Jerk (1ˢᵗ derivative) as a histogram, volume-weighted and ATR-scaled for adaptive sensitivity
Infinitesimal Divergence (2ⁿᵈ derivative) as a thin histogram, using a dynamic ε based on recent volatility
Zero-Cross markers (up/down labels) on the detrended CRSI midline, filtered by MTF consensus
Recurrence crosses, spotting 3-bar “W”/“M” micro-patterns that exceed a minimum amplitude and extend when volume surges
5. Classic RSI Reference Lines:
- 30, 50, 70 thresholds drawn with customizable solid, dashed or dotted styles
Fibonacci - RSI OscillatorIndicator Overview
The Fibonacci RSI Oscillator calculates the Relative Strength Index (RSI) based on a dynamically adjusting level derived from recent price action and a fixed Fibonacci ratio (0.236). This differs from standard RSI, which is calculated directly on the closing price. The objective is to measure momentum relative to a level that adapts to recent peaks and valleys.
Core Calculation Mechanism
Peak/Valley Tracking: The script identifies the highest high (state_peak) and lowest low (state_valley) since the last detected change in short-term directional bias (state_dir).
Dynamic Level Calculation: A level (state_dyn_level) is calculated using a fixed 0.236 Fibonacci ratio relative to the tracked peak and valley:
If bias is up: state_dyn_level = state_peak - (state_peak - state_valley) * 0.236
If bias is down: state_dyn_level = state_valley + (state_peak - state_valley) * 0.236
This level adjusts automatically when a new peak or valley is established in the current directional bias. If price crosses the dynamic level against the current bias, the bias flips, and the level recalculates.
Optional Source Smoothing: The calculated state_dyn_level can optionally be smoothed using a user-selected moving average (SMA, EMA, WMA, HMA, RMA) before the RSI calculation.
RSI Calculation: The standard RSI formula is applied to the (optionally smoothed) state_dyn_level series to produce the primary oscillator value (val_primary_osc).
Signal Line: A moving average (type and length configurable) is calculated on the val_primary_osc to generate the val_sig_line.
Key Features & Components
Dynamic Fibonacci Level: The core input for the RSI calculation, based on recent peaks/valleys and the 0.236 ratio.
Fibonacci Level RSI: The primary oscillator line representing the RSI of the dynamic level.
Signal Line: A moving average of the primary RSI line.
Overbought/Oversold Levels: User-defined threshold lines.
Optional Source Smoothing: Configurable MA smoothing applied to the dynamic level before RSI calculation.
Gradient RSI Color : Option to color the primary RSI line based on its value relative to OB/Mid/OS levels.
Zone & OB/OS Fills: Visual fills for the 0-50 / 50-100 zones and specific fills when the RSI enters OB/OS territory.
Background Gradient: Optional vertical background color gradient based on the RSI's position between 0 and 100.
Configurable Parameters: Inputs for lengths, MA types, OB/OS levels, colors, line widths, and feature toggles.
Visual Elements Explained
Fibonacci Level RSI Line: The main plotted oscillator (color/gradient/width configurable).
Signal Line: The moving average of the RSI line (color/width/MA type configurable).
OB/OS Lines: Horizontal lines plotted at the set OB/OS levels (color/width configurable).
Mid-Line (50): Horizontal line plotted at 50 (color/width configurable).
Zone Fills:
Background fill between 0-50 and 50-100 (colors configurable).
Conditional fill between the RSI line and the 50 line when RSI > OB level or RSI < OS level (colors configurable).
Background Gradient: Optional background coloring where transparency varies vertically with the RSI level (base colors and transparency range configurable).
Configuration Options
Users can adjust the following parameters in the indicator settings:
Smoothing: Enable/disable dynamic level smoothing; set length and MA type.
RSI: Set the RSI calculation length.
Signal Line: Set the signal line smoothing length and MA type.
Levels: Define Overbought and Oversold numeric thresholds.
Visuals: Configure colors and widths for the RSI line, signal line, OB/OS lines, mid-line, zone fills, and OB/OS fills.
Gradients: Enable/disable and configure colors for the RSI line gradient; enable/disable and configure colors/transparency for the background gradient.
Interpretation Notes
The oscillator reflects the momentum of the dynamic Fibonacci level, not directly the price. Divergences, OB/OS readings, and signal line crossovers should be interpreted in this context.
The behavior may differ from standard RSI, potentially offering a smoother output or highlighting different momentum patterns depending on market structure and volatility.
As with any indicator, signals should be used in conjunction with other analysis methods and risk management practices. It is not designed as a standalone trading system.
Risk Disclaimer:
Trading involves significant risk. This indicator is provided for analytical purposes only and does not constitute financial advice. Past performance is not indicative of future results. Use sound risk management practices and never trade with capital you cannot afford to lose.

MTF Stochastic RSIOverview: MTF Stochastic RSI
is a momentum-tracking tool that plots the Stochastic RSI oscillator for up to four user-
defined timeframes on a single panel. It provides a compact yet powerful view of how
momentum is aligning or diverging across different timeframes, making it suitable for both
scalpers and swing traders looking for multi-timeframe confirmation.
What it does:
Calculates Stochastic RSI values using the RSI of price as the base input and applies
smoothing for stability.
Aggregates and displays the values for four customizable TF (e.g., 5min, 15min, 1h, 4h).
Highlights potential support and resistance zones in the oscillator space using adaptive zone
logic.
Optionally draws dynamic support/resistance zone lines in the oscillator space based on
historical turning points.
How it works:
Each timeframe uses the same RSI and Stoch calculation settings but runs independently via
the request.security() function.
Stochastic RSI is calculated by first applying the RSI to price, then applying a stochastic
formula on the RSI values, and finally smoothing the %K output.
Adaptive overbought and oversold thresholds adjust based on ATR-based volatility and simple
trend filtering (e.g., price vs EMA).
When a crossover above the oversold zone or a crossunder below the overbought zone
occurs, the script checks for proximity to previously stored zones and either adjusts or
records a new one.
These zones are stored and re-plotted as dotted support/resistance levels within the
oscillator space.
What it’s based on:
The indicator builds upon traditional Stochastic RSI by applying it to multiple timeframes in
parallel.
Zone detection logic is inspired by the idea of oscillator-based support/resistance levels.
Volatility-adjusted thresholds are based on ATR (Average True Range) to make the
overbought/oversold zones responsive to market conditions.
How to use it:
Look for alignment across timeframes (e.g., all four curves pushing into the overbought
region suggests strong trend continuation).
Reversal risk increases when one or more higher timeframes are diverging or showing signs of
cooling while lower timeframes are still extended.
Use the zone lines as soft support/resistance references within the oscillator—retests of
these zones can indicate strong reversal opportunities or continuation confirmation.
This script is provided for educational and informational purposes only. It does not constitute financial advice, trading recommendations, or an offer to buy or sell any financial instrument. Always perform your own due diligence, use proper risk management, and consult a qualified financial professional before making any trading decisions. Past performance does not guarantee future results. Use this tool at your own discretion and risk.

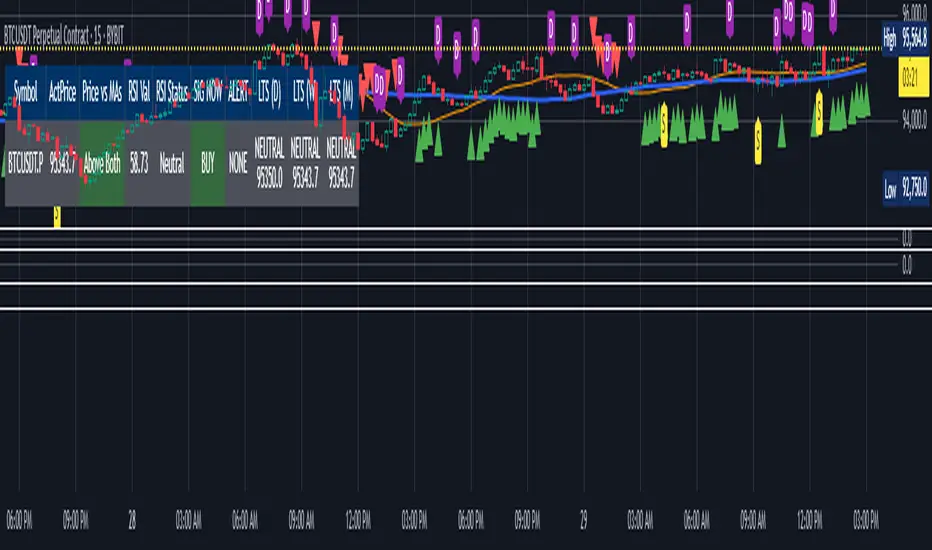
Multi 10 Symbol Scanner Table V1Script Summary: "Multi 10 Symbol Scanner Table V1"
This TradingView indicator acts as a powerful market scanner dashboard. Instead of plotting signals on your main price chart, its primary purpose is to display a table summarizing the technical status of up to 10 different assets (stocks, crypto, forex pairs, etc.) that you choose.
Think of it as a watchlist on steroids. It analyzes each symbol you enter based on a consistent set of rules you define and presents the results side-by-side in the table for quick comparison.
Here's what the table shows for each symbol you add:
Symbol: The ticker name of the asset being scanned.
Actual Price: The current market price of that asset.
Price vs. MAs: Indicates the short-term trend based on whether the price (on the chart's current timeframe) is above two moving average lines ("Above Both"), below them ("Below Both"), or in between ("Mixed"). This column is color-coded (Green/Red/Gray).
RSI Value: Shows the current RSI (Relative Strength Index) number, a measure of momentum (calculated on the chart's current timeframe).
RSI Status: Tells you if the RSI is currently "Overbought," "Oversold," or "Neutral" based on the levels you set. This column is color-coded (Red/Green/Gray).
SIG NOW: A combined "immediate signal" based on the Price vs. MAs and RSI Status conditions (calculated on the chart's current timeframe). It shows "BUY," "SELL," or "NEUTRAL" and is color-coded (Green/Red/Gray).
ALERT: Flags unusual trading volume activity (calculated on the chart's current timeframe). It shows "SPIKE" for high volume, "DUMP" for low volume, or "NONE." This column is color-coded (Orange/Purple/Gray).
LTS (TF1), LTS (TF2), LTS (TF3): These three columns show separate Long-Term Signals for each asset. Each signal is calculated independently using Bollinger Bands on a different, higher timeframe that you specify (e.g., Daily, Weekly, Monthly). It shows "BUY," "SELL," or "NEUTRAL" along with the price at which that signal occurred on that specific higher timeframe. These columns are also color-coded (Green/Red/Gray).
In essence: This script lets you monitor multiple assets simultaneously from one place, checking their short-term trend, momentum, volume activity, and longer-term signals across three different time perspectives, all updated in real-time within the table.
Important Note: This script only displays information in the table. It does not plot any lines or signals on your main chart, nor does it generate built-in TradingView alerts. It's purely a visual dashboard for scanning.
How to Adjust the Script Settings
You can customize the scanner through its "Settings" panel in TradingView. Here’s how to adjust each part:
1. Symbols (Enter Ticker IDs like 'BINANCE:BTCUSDT')
Symbol 1 to Symbol 10: These are the 10 slots where you enter the assets you want to scan.
How to Enter: You need the full Ticker ID, often including the exchange prefix. Examples: NASDAQ:AAPL, BINANCE:BTCUSDT, FX:EURUSD, NYSE:GME. You can find these using TradingView's symbol search.
Leaving Blank: If you don't need all 10 slots, just leave the extra ones blank. The table will only show rows for the symbols you've entered.
2. Indicator Settings (Chart Timeframe)
These settings define the rules for the analysis performed using the timeframe of the chart you currently have open. These rules are applied to all symbols in your list for the "Price vs MAs," "RSI," "SIG NOW," and "ALERT" columns.
MA Source: Choose which price point (Close, Open, High, Low, etc.) the moving averages should be based on. (Default: Close)
Short MA Period: Set the number of bars for the shorter-term moving average. A smaller number reacts faster. (Default: 20)
Long MA Period: Set the number of bars for the longer-term moving average. A larger number shows a smoother trend. (Default: 50)
RSI Source: Choose which price point the RSI momentum calculation should use. (Default: Close)
RSI Period: Set the number of bars for the RSI calculation. (Default: 14)
RSI Overbought Level: The RSI level above which an asset is considered "Overbought" in the table. (Default: 70)
RSI Oversold Level: The RSI level below which an asset is considered "Oversold" in the table. (Default: 30)
SIG NOW RSI Buy Min: The minimum RSI value required (along with price being above MAs) to show a "BUY" signal in the "SIG NOW" column. (Default: 55)
SIG NOW RSI Sell Max: The maximum RSI value required (along with price being below MAs) to show a "SELL" signal in the "SIG NOW" column. (Default: 45)
Volume Lookback (LBV): How many bars (on the chart's timeframe) to look back to calculate the average volume for the Spike/Dump alerts. (Default: 3)
Volume MA Type: The type of averaging method used for the volume calculation. (Default: EMA)
3. Volume Alert Settings
These control the sensitivity of the "ALERT" column (Spike/Dump detection) for all symbols.
Volume Alert Sensitivity: Choose a preset:
"Normal": Standard thresholds.
"Sensitive": Easier to trigger alerts.
"Highly Sensitive": Easiest to trigger alerts.
"Custom": Uses the manual multipliers below.
Custom Spike Multiplier (>1): (Only used if Sensitivity is "Custom") Volume must be this many times greater than average to trigger SPIKE. (e.g., 1.5 = 50% higher).
Custom Dump Multiplier (<1): (Only used if Sensitivity is "Custom") Volume must be this many times smaller than average to trigger DUMP. (e.g., 0.7 = 30% lower).
4. Long Term Signal (LTS) Settings
These settings control the calculations for the three independent "LTS" columns in the table. Each LTS column analyzes data from a specific higher timeframe you choose.
LTS Timeframe 1 / 2 / 3: Select the higher timeframes (e.g., 'D' for Daily, 'W' for Weekly, 'M' for Monthly) for each of the three LTS calculations. These will determine the data used for the corresponding LTS columns in the table.
LTS BB Source: The price source used for the Bollinger Band calculation on the selected LTS timeframes. (Default: Close)
LTS BB Length: The period (number of bars on the chosen LTS timeframe) used for the Bollinger Band calculation. (Default: 20)
LTS BB StdDev: The standard deviation multiplier for the Bollinger Bands used in the LTS calculations. (Default: 2.0)
5. Table Settings
These control the appearance of the scanner table itself.
Table Position: Choose which corner or side of the chart the table should appear on.
Decimal Places (Non-Price): How many decimal places to show for values like the RSI number in the table.
Table Text Size: Adjust the font size inside the table cells ("tiny", "small", "normal", "large", "huge").
By adjusting these settings, you can tailor the scanner to focus on the assets, timeframes, and technical conditions that matter most to your trading strategy. Remember to enter valid ticker symbols for the assets you want to track.

Chart Plotter & Scanner Table V1Script Summary: "Chart Plotter & Scanner Table V1"
This TradingView indicator is designed to give you a comprehensive analysis of the single stock, crypto, or asset currently displayed on your chart. It does this in two main ways:
Visual Signals on the Chart: It draws helpful information directly onto your price chart:
Trend Lines: Plots two moving average lines (one short-term, one long-term) to help you visualize the current price trend.
Buy/Sell Markers ("SIG NOW"): Shows triangle markers below the price (green for potential Buy) or above the price (red for potential Sell) when specific conditions related to price trend and momentum (RSI) are met.
Volume Activity Markers ("ALERT"): Displays small labels ("S" for Spike, "D" for Dump) when the trading volume is unusually high or low compared to its recent average, indicating potentially significant market activity.
Long-Term Signal Markers ("LTS"): Shows small shapes (circles, diamonds, squares) to indicate potential long-term Buy or Sell signals derived from analyzing price action on up to three different, higher timeframes (like Daily, Weekly, Monthly) that you choose.
Status Summary Table: It displays a neat table on your chart (you choose the corner) that acts like a dashboard, summarizing the key findings for the current asset:
Symbol & Price: Shows the ticker symbol and the latest price.
Price vs. Trend: Tells you if the current price is above both trend lines ("Above Both"), below both ("Below Both"), or in between ("Mixed"), with color-coding (Green/Red/Gray).
Momentum (RSI): Shows the current RSI value and its status ("Overbought", "Oversold", or "Neutral"), with color-coding (Red/Green/Gray).
Immediate Signal ("SIG NOW"): Displays the current Buy, Sell, or Neutral status based on the combined trend and momentum rules, with color-coding (Green/Red/Gray).
Volume Alert ("ALERT"): Shows if there's a volume Spike, Dump, or None, with color-coding (Orange/Purple/Gray).
Long-Term Signals (LTS): Shows the Buy, Sell, or Neutral status calculated from each of the three chosen higher timeframes, including the price at which the signal occurred on that timeframe, with color-coding (Green/Red/Gray).
Essentially, this script combines short-term trend and momentum analysis with volume activity monitoring and longer-term perspective signals, presenting the information clearly on your chart and in a summary table for quick assessment. It also allows you to create TradingView alerts based on these signals.
How to Adjust the Script Settings
You can customize how this script works through its "Settings" panel in TradingView. Here’s a breakdown of each section:
1. Indicator Settings (Chart Timeframe)
These settings control the main calculations done on your current chart's timeframe.
MA Source: Choose which price point (Close, Open, High, Low, etc.) the moving averages should be based on. (Default: Close)
Short MA Period: Set the number of bars for the shorter-term moving average. A smaller number makes it react faster to price changes. (Default: 20)
Long MA Period: Set the number of bars for the longer-term moving average. A larger number shows a smoother, longer-term trend. (Default: 50)
RSI Source: Choose which price point the RSI momentum calculation should use. (Default: Close)
RSI Period: Set the number of bars for the RSI calculation. (Default: 14)
RSI Overbought Level: The RSI level above which the asset is considered potentially "Overbought". (Default: 70)
RSI Oversold Level: The RSI level below which the asset is considered potentially "Oversold". (Default: 30)
SIG NOW RSI Buy Min: The minimum RSI value required (along with price being above MAs) to trigger a "SIG NOW" Buy signal. (Default: 55)
SIG NOW RSI Sell Max: The maximum RSI value required (along with price being below MAs) to trigger a "SIG NOW" Sell signal. (Default: 45)
Volume Lookback (LBV): How many bars to look back to calculate the average volume for the Spike/Dump alerts. (Default: 3)
Volume MA Type: The type of averaging method used for the volume calculation (EMA is generally preferred for responsiveness). (Default: EMA)
2. Volume Alert Settings
These control how sensitive the Volume Spike/Dump alerts are.
Volume Alert Sensitivity: Choose a preset sensitivity level:
"Normal": Standard thresholds for spike/dump detection.
"Sensitive": Requires less deviation from the average volume to trigger an alert.
"Highly Sensitive": Triggers alerts on even smaller volume deviations.
"Custom": Ignores the presets and uses the manual multipliers below.
Custom Spike Multiplier (>1): (Only used if Sensitivity is "Custom") How many times greater than the average volume the current volume must be to trigger a SPIKE. (e.g., 1.5 means 50% higher).
Custom Dump Multiplier (<1): (Only used if Sensitivity is "Custom") How many times smaller than the average volume the current volume must be to trigger a DUMP. (e.g., 0.7 means 30% lower).
3. Long Term Signal (LTS) Settings
These settings control the calculations for the three independent Long-Term Signals, which look at higher timeframes.
LTS Timeframe 1/2/3: Select the higher timeframes (e.g., 'D' for Daily, 'W' for Weekly, 'M' for Monthly) for each of the three LTS calculations.
LTS BB Source: The price source used for the Bollinger Band calculation on the LTS timeframes. (Default: Close)
LTS BB Length: The period (number of bars on the LTS timeframe) used for the Bollinger Band calculation. (Default: 20)
LTS BB StdDev: The standard deviation multiplier for the Bollinger Bands used in the LTS calculation. (Default: 2.0)
4. Plotting Settings
These control what is visually displayed on the price chart itself.
Plot MAs?: Checkbox to show or hide the two moving average lines.
Plot SIG NOW Markers?: Checkbox to show or hide the green/red triangle Buy/Sell markers.
Plot ALERT Markers?: Checkbox to show or hide the "S" / "D" volume Spike/Dump labels.
Plot LTS Markers?: Checkbox to show or hide the long-term signal markers (circles, diamonds, squares).
Plot LTS Markers For: Dropdown to choose whether to show markers for only LTS TF1, TF2, TF3, or "All" of them.
5. Table Settings
These control the appearance and content of the summary table.
Show Status Table?: Checkbox to show or hide the entire summary table.
Table Position: Choose which corner or side of the chart the table should appear on.
Decimal Places (Non-Price): How many decimal places to show for values like the RSI number in the table.
Table Text Size: Adjust the font size inside the table cells.
Setting Up Alerts:
This script creates the conditions for alerts. To actually receive notifications:
Click the "Alert" button (clock icon) in TradingView's top toolbar or right-click on the chart.
In the "Condition" dropdown, select the script name ("Chart Plotter & Scanner Table V1").
You will see a list of available alert conditions created by the script (e.g., "SIG NOW Buy Alert", "RSI Overbought Alert", "LTS TF1 Buy Alert", etc.). Choose the one you want.
Configure the rest of the alert settings (Options, Actions, Message) as desired.
Click "Create". Repeat for any other signals you want alerts for.
By adjusting these settings, you can fine-tune the indicator to match your trading style, the specific asset you are analyzing, and the timeframes you are interested in.