Market Anomaly Detector (MAD)Market Anomaly Detector (MAD) Indicator - Detailed Description:
The Market Anomaly Detector (MAD) Indicator is a unique tool designed to identify potential market anomalies by combining several price action-based and momentum indicators. This indicator is especially useful for traders who seek to identify significant market shifts and anomalies before they become visible in conventional technical indicators.
Key Features of the MAD Indicator:
1. Z-Score Threshold for Anomaly Detection:
• The Z-Score measures how far a current price is from its average over a defined period, normalized by standard deviation. This allows the MAD indicator to detect outliers or anomalies in price movements.
• By adjusting the Z-Score Threshold, traders can tune the sensitivity of the indicator to capture only the most significant price deviations, filtering out noise and reducing false signals.
2. Volume and Liquidity Filter:
• Volume is a key indicator of market participation and sentiment. The MAD Indicator uses a volume multiplier to assess when price movements are supported by sufficient trading volume.
• A volume spike is identified when the current volume exceeds the average volume by a certain multiplier. This ensures that only high-confidence signals are generated, particularly useful for spotting trend reversals and breakout opportunities.
3. Signal Cooldown Period:
• To prevent overfitting and reduce false signals, a signal cooldown period is implemented. Once a buy or sell signal is triggered, the indicator waits for a specified number of bars (e.g., 5) before triggering another signal, even if the price action meets the criteria for a new signal. This helps maintain a cleaner trading environment and avoids confusion when the market is volatile.
4. Upper and Lower Bands for Trend Confirmation:
• The MAD Indicator uses bands based on the mean price and standard deviation, similar to Bollinger Bands. These upper and lower bands help to define the expected price range for a given period, indicating overbought or oversold conditions.
• The combination of Z-Score, volume, and band analysis helps pinpoint when the price breaks out of expected ranges, providing early warning signs for potential market shifts.
5. Trend Confirmation from Higher Timeframes:
• The MAD Indicator includes a multi-timeframe approach to trend confirmation, using the 50-period EMA on a higher timeframe (e.g., 1-hour chart). This ensures that signals are aligned with the overall market trend, enhancing the reliability of buy and sell signals.
How It Works:
• The MAD Indicator continuously monitors price action, volume, and statistical anomalies, using the Z-Score to determine when the price is significantly deviating from its historical average.
• When the price breaks above the upper band and a bullish anomaly is detected, a buy signal is generated. (Green Background)
• Similarly, when the price breaks below the lower band and a bearish anomaly is detected, a sell signal is triggered. (Red Background
• By filtering signals based on volume and using the cooldown period, the MAD Indicator ensures that only high-quality trades are signaled.
How to Use the MAD Indicator:
• Buy Signal: Occurs when the price breaks above the upper band and there is a significant deviation from the mean (bullish anomaly).
• Sell Signal: Occurs when the price breaks below the lower band and there is a significant deviation from the mean (bearish anomaly).
• Volume Confirmation: Ensure that the buy/sell signals are supported by a volume spike, indicating strong market participation.
• Signal Cooldown Period: After a signal is triggered, the indicator waits for the cooldown period to avoid triggering multiple signals in quick succession.
Why It’s Worth Paying For:
The MAD Indicator combines advanced statistical analysis (Z-Score), price action, and volume analysis to identify market anomalies and breakouts before they are visible on standard indicators. By leveraging the power of mean reversion and statistical anomalies, this tool provides traders with high-confidence signals that can lead to profitable trades, especially in volatile markets. The integration of a multi-timeframe trend filter ensures that signals are aligned with the overall market trend, reducing the likelihood of false breakouts.
This indicator is ideal for trend-following traders looking for high-probability entries and mean-reversion traders aiming to capture price deviations. The signal cooldown period and volume filter provide an additional layer of precision, ensuring that you only act on the strongest market signals.
Relative Strength Index (RSI)

Universal Forex Strength Index - UFSIUniversal Forex Strength Index: A Comprehensive Guide for Traders
The Universal Forex Strength Index (UFSI) is a powerful technical analysis tool designed to help traders assess the strength of various currency pairs in the Forex market. This guide will walk you through the functionality of the UFSI, how to interpret its signals, and how to utilize it effectively in your trading strategy.
Understanding the Components of UFSI
1. Relative Strength Index (RSI)
The UFSI utilizes the Relative Strength Index (RSI), a momentum oscillator that measures the speed and change of price movements. The RSI ranges from 0 to 100 and is typically used to identify overbought or oversold conditions:
Above 70: Overbought condition
Below 30: Oversold condition
2. Exponential Moving Averages (EMA)
The indicator also incorporates two Exponential Moving Averages:
EMA 21: A short-term trend indicator.
EMA 50: A longer-term trend indicator.
The difference between these two EMAs is normalized to create a value that reflects market momentum.
3. Strength Index Calculation
The UFSI combines the RSI and the normalized EMA difference to produce a composite strength index. This index ranges from 0 to 100 and provides insights into the overall strength of a currency pair.
4. EMA of the Strength Index
A 50-period EMA of the strength index is calculated to smooth out fluctuations and provide a clearer trend direction.
Color Coding System
The UFSI employs a dynamic color-coding scheme that helps traders quickly assess market conditions:
Strength Index Colors
Green Shades: Indicates a strong bullish trend.
Dark Green (#006400) to Light Green (#008000): Strong bullish momentum.
Orange Shades: Indicates a potential reversal or uncertainty.
Orange (#FFA500) to Gold (#FFD700): Bullish but losing momentum.
Red Shades: Indicates a strong bearish trend.
Dark Red (#FF4500) to Bright Red (#FF0000): Strong bearish momentum.
Blue Shades: Indicates neutral or indecisive market conditions.
Light Blue (#1E90FF) to Dark Blue (#0000FF): No clear trend.
EMA Gradient Color
The color of the 50 EMA of the Strength Index changes based on its value:
Above 50: Indicates bullish sentiment, transitioning from light green to dark green as strength increases.
Below 50: Indicates bearish sentiment, transitioning from red to orange as strength decreases.
How to Use the Universal Forex Strength Index in Trading
Step-by-Step Trading Strategy
Identify Market Conditions
Look at the color of the strength index line:
If it’s predominantly green, consider looking for buying opportunities.
If it’s predominantly red, consider looking for selling opportunities.
If it’s blue, be cautious as there may be no clear trend.
Confirm with EMA
Check the position of the strength index relative to its EMA:
If the strength index is above its EMA and both are above 50, this confirms a strong bullish trend.
If the strength index is below its EMA and both are below 50, this confirms a strong bearish trend.
Set Entry and Exit Points
Use traditional support and resistance levels or other indicators (like moving averages or Fibonacci retracement levels) for setting entry and exit points.
Consider entering trades when there’s a crossover between the strength index and its EMA, especially when confirmed by color changes.
Risk Management
Always use stop-loss orders to protect against unexpected market movements.
Adjust your position size based on your risk tolerance and account size.
Conclusion
The Universal Forex Strength Index is an invaluable tool for traders seeking to gauge market sentiment and make informed trading decisions. By understanding its components, interpreting its color-coded signals, and integrating it into your trading strategy, you can enhance your ability to navigate the complexities of the Forex market successfully.
Feel free to share this guide on TradingView or use it as part of your trading toolkit! Happy trading!

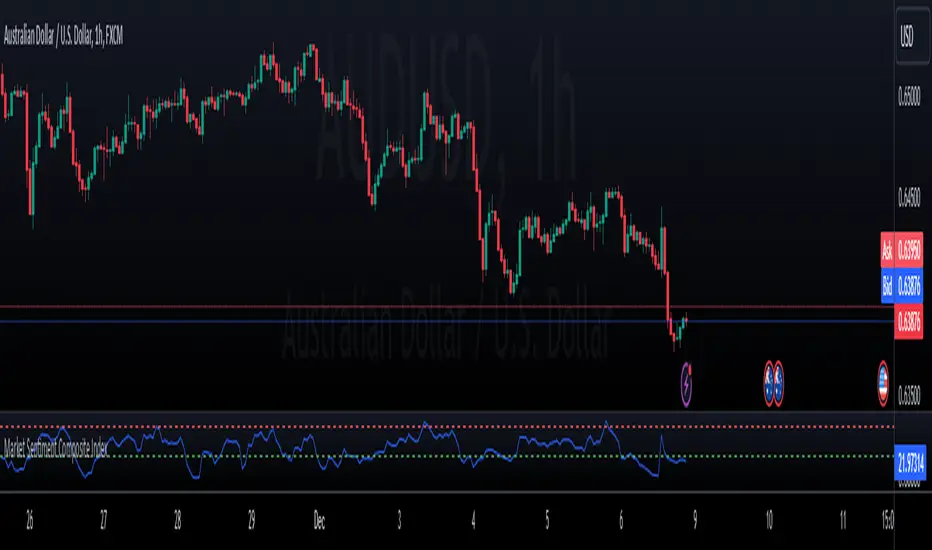
Market Sentiment Composite IndexDescription
The Market Sentiment Composite Index is an advanced indicator designed to provide traders with a comprehensive view of market sentiment by aggregating data from multiple key indicators. This tool helps traders identify potential overbought and oversold conditions, enabling more informed trading decisions.
How It Works
Indicator Components:
Relative Strength Index (RSI): Measures the magnitude of recent price changes to evaluate overbought or oversold conditions.
Average True Range (ATR): Gauges market volatility by analyzing the range of price movements.
MACD (Moving Average Convergence Divergence): Indicates momentum and potential buy/sell signals based on moving average crossovers.
Volume Score: Assesses trading volume in relation to its historical average to detect unusual activity.
Normalization: Each component is normalized to a 0-100 scale, ensuring consistency across different metrics.
Composite Calculation: The normalized values are averaged to form the Composite Sentiment Score. This score ranges from 0 to 100, providing a unified measure of market sentiment.
Visual Representation:
Sentiment Score Plot: The composite sentiment score is plotted on the chart.
Overbought/Oversold Levels: Default levels set at 70 (overbought) and 30 (oversold), customizable by the user.
Horizontal Lines: Dashed lines at the overbought and oversold levels for easy reference.
Alerts: Custom alerts notify traders when the sentiment score crosses the overbought or oversold thresholds, helping them stay informed of significant market conditions.
Usage
The Market Sentiment Composite Index is ideal for traders who seek a holistic view of market sentiment. By combining multiple indicators into a single score, it provides a robust tool to identify potential reversal points and confirm trends.
Key Benefits
Comprehensive Insight: Integrates multiple indicators for a well-rounded sentiment analysis.
Customization: Adjustable overbought and oversold levels to fit individual trading strategies.
User-Friendly: Clear visual representation and alerts to keep traders informed..
Dynamic RSI with Overbought/Oversold LinesDynamic RSI with Overbought/Oversold Lines
This indicator enhances the traditional RSI (Relative Strength Index) by dynamically adjusting the overbought and oversold levels based on the highest and lowest RSI values over a user-defined period. The indicator plots these levels as horizontal lines, allowing traders to visually identify when the market is "overbought" or "oversold."
Features:
Dynamic Overbought/Oversold Levels: Automatically adjusts the overbought and oversold levels based on the highest and lowest RSI values within the defined period, ensuring more accurate signals tailored to the current market conditions.
Customizable RSI Period: Choose your preferred RSI period to suit your trading strategy.
Signal Alerts: Visual signals are displayed when the RSI crosses into the overbought or oversold zone, indicating potential reversal points.
Background Color Alerts: The background changes color when the RSI exceeds overbought or oversold levels, making it easier to spot these important zones at a glance.
Clean and Simple: A minimalist design focusing on the key elements, making it suitable for all traders.
How to Use:
Overbought Zone: When the RSI moves above the overbought line (red), it may indicate that the asset is overbought, signaling a potential price reversal or pullback.
Oversold Zone: When the RSI moves below the oversold line (green), it may indicate that the asset is oversold, signaling a potential price bounce or reversal.
This dynamic RSI indicator is perfect for those looking to capture market extremes and improve their trading decisions. It's especially useful for timeframes like 30-minute and 1-hour charts, where market conditions tend to shift more rapidly.

Adapted RSI w/ Multi-Asset Regime Detection v1.1The relative strength index (RSI) is a momentum indicator used in technical analysis. RSI measures the speed and magnitude of an asset's recent price changes to detect overbought or oversold conditions in the price of said asset.
In addition to identifying overbought and oversold assets, the RSI can also indicate whether your desired asset may be primed for a trend reversal or a corrective pullback in price. It can signal when to buy and sell.
The RSI will oscillate between 0 and 100. Traditionally, an RSI reading of 70 or above indicates an overbought condition. A reading of 30 or below indicates an oversold condition.
The RSI is one of the most popular technical indicators. I intend to offer a fresh spin.
Adapted RSI w/ Multi-Asset Regime Detection
Our Adapted RSI makes necessary improvements to the original Relative Strength Index (RSI) by combining multi-timeframe analysis with multi-asset monitoring and providing traders with an efficient way to analyse market-wide conditions across different timeframes and assets simultaneously. The indicator automatically detects market regimes and generates clear signals based on RSI levels, presenting this data in an organised, easy-to-read format through two dynamic tables. Simplicity is key, and having access to more RSI data at any given time, allows traders to prepare more effectively, especially when trading markets that "move" together.
How we calculate the RSI
First, the RSI identifies price changes between periods, calculating gains and losses from one look-back period to the next. This look-back period averages gains and losses over 14 periods, which in this case would be 14 days, and those gains/losses are calculated based on the daily closing price. For example:
Average Gain = Sum of Gains over the past 14 days / 14
Average Loss = Sum of Losses over the past 14 days / 14
Then we calculate the Relative Strength (RS):
RS = Average Gain / Average Loss
Finally, this is converted to the RSI value:
RSI = 100 - (100 / (1 + RS))
Key Features
Our multi-timeframe RSI indicator enhances traditional technical analysis by offering synchronised Daily, Weekly, and Monthly RSI readings with automatic regime detection. The multi-asset monitoring system allows tracking of up to 10 different assets simultaneously, with pre-configured major pairs that can be customised to any asset selection. The signal generation system provides clear market guidance through automatic regime detection and a five-level signal system, all presented through a sophisticated visual interface with dynamic RSI line colouring and customisable display options.
Quick Guide to Use it
Begin by adding the indicator to your chart and configuring your preferred assets in the "Asset Comparison" settings.
Position the two information tables according to your preference.
The main table displays RSI analysis across three timeframes for your current asset, while the asset table shows a comparative analysis of all monitored assets.
Signals are colour-coded for instant recognition, with green indicating bullish conditions and red for bearish conditions. Pay special attention to regime changes and signal transitions, using multi-timeframe confluence to identify stronger signals.
How it Works (Regime Detection & Signals)
When we say 'Regime', a regime is determined by a persistent trend or in this case momentum and by leveraging this for RSI, which is a momentum oscillator, our indicator employs a relatively simple regime detection system that classifies market conditions as either Bullish (RSI > 50) or Bearish (RSI < 50). Our benchmark between a trending bullish or bearish market is equal to 50. By leveraging a simple classification system helps determine the probability of trend continuation and the weight given to various signals. Whilst we could determine a Neutral regime for consolidating markets, we have employed a 'neutral' signal generation which will be further discussed below...
Signal generation occurs across five distinct levels:
Strong Buy (RSI < 15)
Buy (RSI < 30)
Neutral (RSI 30-70)
Sell (RSI > 70)
Strong Sell (RSI > 85)
Each level represents different market conditions and probability scenarios. For instance, extreme readings (Strong Buy/Sell) indicate the highest probability of mean reversion, while neutral readings suggest equilibrium conditions where traders should focus on the overall regime bias (Bullish/Bearish momentum).
This approach offers traders a new and fresh spin on a popular and well-known tool in technical analysis, allowing traders to make better and more informed decisions from the well presented information across multiple assets and timeframes. Experienced and beginner traders alike, I hope you enjoy this adaptation.

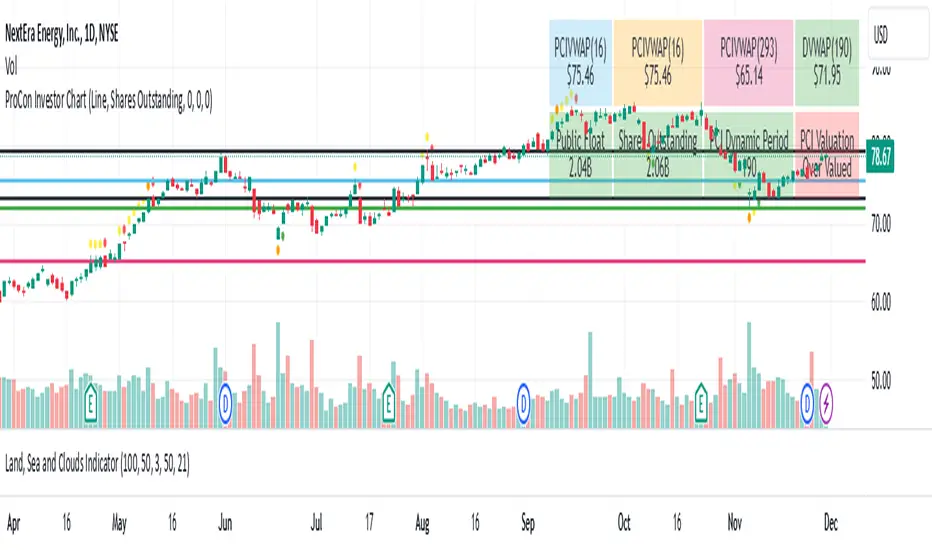
ProCon Investor ChartProCon Investor Chart: Originality and Usefulness
The ProCon Investor Chart is a unique integration of multiple technical indicators designed to provide actionable insights for traders. Unlike standalone indicators such as RSI, Stochastic, or Bollinger Bands, this script combines them into a proprietary framework that evaluates market conditions holistically.
Each component is enhanced to complement the others:
Dots: Proprietary algorithms combine RSI, Stochastic, MACD, and Bollinger Bands to determine overbought/oversold conditions and high-volume reversals. This combination adds a unique dimension by accounting for both momentum and market participation.
VWAP-Based Support and Resistance: The VWAP lines are calculated dynamically by combining trade volume with shares outstanding or public float, making them adaptable to specific securities and timeframes. This approach provides more precise levels compared to static support/resistance calculations.
Colored Bars: SMA-based trend analysis identifies short- and long-term trends while ensuring transparency for trend traders. The inclusion of SMA (5, 20, 50) allows users to spot transitions and key moments of trend reversal.
By integrating these components, the ProCon Investor Chart helps traders identify opportunities that standalone indicators might miss, providing a comprehensive view of market behavior.
Indicator Description and How to Use
The ProCon Investor Chart is a multi-layered analytical tool designed for identifying trends, market sentiment, and dynamic support/resistance levels. Here's how it works:
Dots for Overbought/Oversold Conditions:
Calculated using RSI, Stochastic, MACD, and Bollinger Bands.
Yellow dots (above/below bars) signify overbought/oversold levels.
Orange dots highlight high-volume oversold/overbought areas, combining price action and market participation.
Red and green dots mark potential reversals in price trends.
VWAP Support and Resistance Lines:
VWAP lines are calculated using a proprietary metric that integrates trade volume with public float or shares outstanding.
These levels adapt dynamically and are reset based on trading activity, offering precise support/resistance points.
Trend-Driven Colored Bars:
Bars are color-coded based on SMA values (5, 20, 50) to identify trends and market transitions.
Table Summary:
Displays VWAP levels, sentiment analysis, and dynamic metrics, offering traders a snapshot of critical data.
This approach ensures that the script provides unique insights beyond what individual indicators can achieve. By integrating multiple dimensions of technical analysis, the ProCon Investor Chart is a reliable companion for day traders, swing traders, and investors seeking actionable market analytics.
Value Proposition for Invite-Only Script
While the ProCon Investor Chart uses classic indicators like RSI, Bollinger Bands, and VWAP, it integrates these elements into a proprietary system that offers unique advantages:
Advanced Calculations:
The VWAP-based support and resistance levels go beyond standard VWAP by integrating trade volume with float data, making them highly adaptable to specific securities.
Actionable Visuals:
The dot-based system simplifies the detection of overbought/oversold levels, incorporating volume and momentum into one visual cue.
Trend-Specific Features:
By combining SMAs with custom color coding, the script allows trend traders to identify transitions at a glance.
Additional Features
Table Display: Support and resistance lines are conveniently displayed in a table in the top-right corner of the chart, along with a simple valuation of the stock relative to these levels.
This multi-dimensional approach justifies the script’s originality and ensures that users receive actionable insights tailored to their trading strategies.
The ProCon Investor Chart is designed to consolidate multiple data points into a unified tool, helping traders make informed decisions with greater confidence. Its custom dynamic VWAP calculations and sentiment analysis provide a clear and actionable view of market conditions.
RSI + Normalized Fisher Transform with SignalsThis indicator combines three tools for market analysis: the Relative Strength Index (RSI), the RSI's moving average, and the Fisher Transform. RSI is a momentum oscillator that measures the speed and change of price movements, helping identify overbought and oversold conditions. The RSI moving average is a smoothed version of the RSI that filters noise and confirms trends. The Fisher Transform is a mathematical technique that transforms price data into a Gaussian normal distribution, making it easier to identify turning points. It has been normalized to the same scale as the RSI (0-100) for consistency.
Purpose
The goal of this indicator is to identify potential buy and sell opportunities with varying degrees of strength (strong and weak). By combining the RSI, its moving average, and the Fisher Transform, the indicator ensures signals are based on both momentum and reversals, making it highly versatile across different market conditions.
Key Features
This indicator provides strong and weak buy and sell signals. A strong buy occurs when the RSI crosses above its moving average while both the RSI and its moving average are oversold (below the default threshold of 30), and the Fisher Transform reverses direction within the same or prior bar while also being oversold. A weak buy occurs when the Fisher Transform is oversold, and the RSI crosses above its moving average while its value is between the default oversold threshold (30) and 50. A strong sell occurs when the RSI crosses below its moving average while both the RSI and its moving average are overbought (above the default threshold of 70), and the Fisher Transform reverses direction within the same or prior bar while also being overbought. A weak sell occurs when the Fisher Transform is overbought, and the RSI crosses below its moving average while its value is between 50 and the default overbought threshold (70).
The indicator includes customizable thresholds and lengths. Users can adjust the oversold and overbought thresholds to suit their trading style. The RSI length, moving average length, and Fisher Transform length are also customizable. The Fisher Transform is scaled to the RSI’s range of 0-100 to simplify analysis and signal interpretation.
How to Use the Indicator
On the chart, you will see the RSI line in blue, the RSI moving average in orange, and the Fisher Transform in purple. Horizontal lines at the default oversold (30) and overbought (70) levels mark critical zones for signals. Adjust these thresholds in the indicator settings as needed.
Strong buy signals are shown as larger, darker green arrows below the price. Weak buy signals are small lime arrows below the price. Strong sell signals are larger, darker red arrows above the price. Weak sell signals are small fuchsia arrows above the price.
Signal Interpretation
A strong buy indicates a highly favorable buying opportunity. This typically occurs when the asset is in a downtrend but shows signs of reversal, particularly in oversold zones. A weak buy suggests a potential buying opportunity but with less conviction, often when the market is neutral to slightly bearish but showing upward momentum. A strong sell indicates a highly favorable selling opportunity, usually occurring when the asset is in an uptrend but shows signs of reversal, particularly in overbought zones. A weak sell suggests a potential selling opportunity but with less conviction, often in neutral to slightly bullish markets showing downward momentum.
Practical Tips
Avoid using signals in isolation. Combine this indicator with other tools such as trendlines, moving averages, or support/resistance levels for greater accuracy. Adjust the parameters for different assets to match their volatility. For volatile assets, consider wider thresholds like 20/80 for oversold/overbought levels. For less volatile assets, tighter thresholds like 35/65 may be more appropriate. Use higher timeframes to confirm signals before trading on lower timeframes. Be cautious in sideways markets, as both RSI and the Fisher Transform perform better in trending conditions.
Instructions for Adjustments
To change the oversold or overbought levels, open the indicator settings by clicking the gear icon and modify the "Oversold Threshold" and "Overbought Threshold" values. To adjust lengths for RSI and Fisher Transform, update the "RSI Length," "RSI Moving Average Length," and "Fisher Transform Length" settings. If needed, toggle signal visibility by enabling or disabling specific arrows (Strong Buy, Weak Buy, Strong Sell, Weak Sell) in the "Style" tab.
Best Practices
Risk management is essential. Always set appropriate stop-loss levels and position sizes based on your risk tolerance. Backtest the indicator on historical data to understand its performance and behavior for your chosen asset and timeframe. Combining this indicator with volume or volatility analysis (Bollinger Band Width, for example) can help confirm signal validity.
This indicator simplifies decision-making by identifying high-probability trading opportunities using a combination of momentum, trend, and reversals. Follow these instructions to fully utilize its capabilities without needing to analyze the underlying code.

RS Cycles [QuantVue]The RS Cycles indicator is a technical analysis tool that expands upon traditional relative strength (RS) by incorporating Beta-based adjustments to provide deeper insights into a stock's performance relative to a benchmark index. It identifies and visualizes positive and negative performance cycles, helping traders analyze trends and make informed decisions.
Key Concepts:
Traditional Relative Strength (RS):
Definition: A popular method to compare the performance of a stock against a benchmark index (e.g., S&P 500).
Calculation: The traditional RS line is derived as the ratio of the stock's closing price to the benchmark's closing price.
RS=Stock Price/Benchmark Price
Usage: This straightforward comparison helps traders spot periods of outperformance or underperformance relative to the market or a specific sector.
Beta-Adjusted Relative Strength (Beta RS):
Concept: Traditional RS assumes equal volatility between the stock and benchmark, but Beta RS accounts for the stock's sensitivity to market movements.
Calculation:
Beta measures the stock's return relative to the benchmark's return, adjusted by their respective volatilities.
Alpha is then computed to reflect the stock's performance above or below what Beta predicts:
Alpha=Stock Return−(Benchmark Return×β)
Significance: Beta RS highlights whether a stock outperforms the benchmark beyond what its Beta would suggest, providing a more nuanced view of relative strength.
RS Cycles:
The indicator identifies positive cycles when conditions suggest sustained outperformance:
Short-term EMA (3) > Mid-term EMA (10) > Long-term EMA (50).
The EMAs are rising, indicating positive momentum.
RS line shows upward movement over a 3-period window.
EMA(21) > 0 confirms a broader uptrend.
Negative cycles are marked when the opposite conditions are met:
Short-term EMA (3) < Mid-term EMA (10) < Long-term EMA (50).
The EMAs are falling, indicating negative momentum.
RS line shows downward movement over a 3-period window.
EMA(21) < 0 confirms a broader downtrend.
This indicator combines the simplicity of traditional RS with the analytical depth of Beta RS, making highlighting true relative strength and weakness cycles.

Indicator DashboardThis script creates an 'Indicator Dashboard' designed to assist you in analyzing financial markets and making informed decisions. The indicator provides a summary of current market conditions by presenting various technical analysis indicators in a table format. The dashboard evaluates popular indicators such as Moving Averages, RSI, MACD, and Stochastic RSI. Below, we'll explain each part of this script in detail and its purpose:
### Overview of Indicators
1. **Moving Averages (MA)**:
- This indicator calculates Simple Moving Averages (“SMA”) for 5, 14, 20, 50, 100, and 200 periods. These averages provide a visual summary of price movements. Depending on whether the price is above or below the moving average, it determines the market direction as either “Bullish” or “Bearish.”
2. **RSI (Relative Strength Index)**:
- The RSI helps identify overbought or oversold market conditions. Here, the RSI is calculated for a 14-period window, and this value is displayed in the table. Additionally, the 14-period moving average of the RSI is also included.
3. **MACD (Moving Average Convergence Divergence)**:
- The MACD indicator is used to determine trend strength and potential reversals. This script calculates the MACD line, signal line, and histogram. The MACD condition (“Bullish,” “Bearish,” or “Neutral”) is displayed alongside the MACD and signal line values.
4. **Stochastic RSI**:
- Stochastic RSI is used to identify momentum changes in the market. The %K and %D lines are calculated to determine the market condition (“Bullish” or “Bearish”), which is displayed along with the calculated values for %K and %D.
### Table Layout and Presentation
The dashboard is presented in a vertical table format in the top-right corner of the chart. The table contains two columns: “Indicator” and “Status,” summarizing the condition of each technical indicator.
- **Indicator Column**: Lists each of the indicators being tracked, such as SMA values, RSI, MACD, etc.
- **Status Column**: Displays the current status of each indicator, such as “Bullish,” “Bearish,” or specific values like the RSI or MACD.
The table also includes rounded indicator values for easier interpretation. This helps traders quickly assess market conditions and make informed decisions based on multiple indicators presented in a single location.
### Detailed Indicator Status Calculations
1. **SMA Status**: For each moving average (5, 14, 20, 50, 100, 200), the script checks if the current price is above or below the SMA. The status is determined as “Bullish” if the price is above the SMA and “Bearish” if below, with the value of the SMA also displayed.
2. **RSI and RSI Average**: The RSI value for a 14-period is displayed along with its 14-period SMA, which provides an average reading of the RSI to smooth out volatility.
3. **MACD Indicator**: The MACD line, signal line, and histogram are calculated using standard parameters (12, 26, 9). The status is shown as “Bullish” when the MACD line is above the signal line, and “Bearish” when it is below. The exact values for the MACD line, signal line, and histogram are also included.
4. **Stochastic RSI**: The %K and %D lines of the Stochastic RSI are used to determine the trend condition. If %K is greater than %D, the condition is “Bullish,” otherwise it is “Bearish.” The actual values of %K and %D are also displayed.
### Conclusion
The 'Indicator Dashboard' provides a comprehensive overview of multiple technical indicators in a single, easy-to-read table. This allows traders to quickly gauge market conditions and make more informed decisions. By consolidating key indicators like Moving Averages, RSI, MACD, and Stochastic RSI into one dashboard, it saves time and enhances the efficiency of technical analysis.
This script is particularly useful for traders who prefer a clean and organized overview of their favorite indicators without needing to plot each one individually on the chart. Instead, all the crucial information is available at a glance in a consolidated format.

Rate of Change of OBV with RSI ColorThis indicator combines three popular tools in technical analysis : On-Balance Volume (OBV), Rate of Change (ROC), and Relative Strength Index (RSI). It aims to monitor momentum and potential trend reversals based on volume and price changes.
Calculation:
ROC(OBV) = ((OBV(today) - OBV(today - period)) / OBV(today - period)) * 100
This calculates the percentage change in OBV over a specific period. A positive ROC indicates an upward trend in volume, while a negative ROC suggests a downward trend.
What it Monitors:
OBV: Tracks the volume flow associated with price movements. Rising OBV suggests buying pressure, while falling OBV suggests selling pressure.
ROC of OBV:
Measures the rate of change in the OBV, indicating if the volume flow is accelerating or decelerating.
RSI: Measures the strength of recent price movements, indicating potential overbought or oversold conditions.
How it can be Used:
Identifying Trend Continuation: Rising ROC OBV with a rising RSI might suggest a continuation of an uptrend, especially if the color is lime (RSI above 60).
Identifying Trend Reversal: Falling ROC OBV with a declining RSI might suggest a potential trend reversal, especially if the color approaches blue (RSI below 40).
Confirmation with Threshold: The horizontal line (threshold) can be used as a support or resistance level. Bouncing ROC OBV off the threshold with a color change could suggest a pause in the trend but not necessarily a reversal.
When this Indicator is Useful:
This indicator can be useful for assets with strong volume activity, where tracking volume changes provides additional insights.
It might be helpful during periods of consolidation or trend continuation to identify potential breakouts or confirmations.
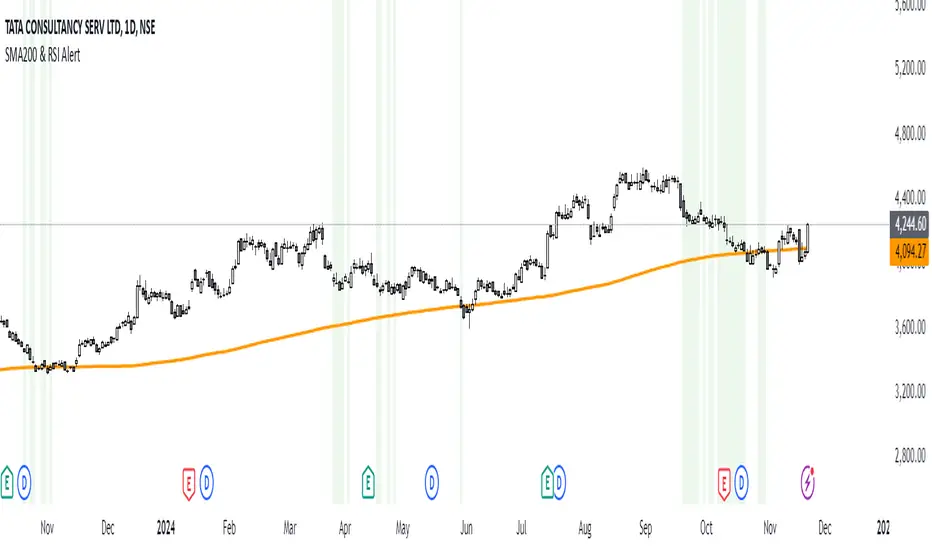
SMA200 & RSI [Tarun]The SMA200 & RSI Signal Indicator is a powerful tool designed for traders who want to identify potential entry zones based on a combination of price action and momentum. This indicator combines two essential trading components:
SMA200 (Simple Moving Average): A widely used trend-following tool that highlights the overall direction of the market.
RSI (Relative Strength Index): A momentum oscillator that measures the speed and change of price movements.
How It Works:
Price Above SMA200: Indicates bullish market conditions.
RSI Between 40 and 20: Suggests that the asset is in a potential oversold or pullback zone within a bullish trend.
When both conditions are met, the indicator triggers:
Background Highlight: The chart background turns green to indicate a potential signal zone.
Disclaimer:
This indicator is not a standalone trading strategy. Use it in conjunction with other analysis methods such as support and resistance, candlestick patterns, or volume analysis. Always practice proper risk management.
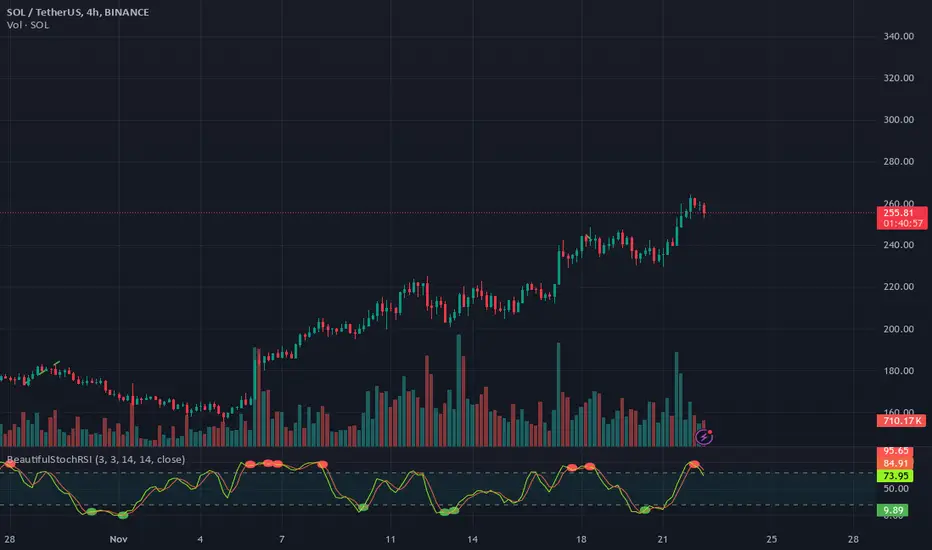
BeautifulStochRSIBeautifulStochRSI: A Unique and Clear Approach to Stochastic RSI
Introducing the BeautifulStochRSI, an colorfull approach to the popular Stochastic RSI indicator. This script goes beyond the standard representation by offering visually distinct and intuitive signals to enhance your trading experience.
The BeautifulStochRSI is ideal for traders who value both precision and simplicity. It combines functional enhancements with a polished design, ensuring that crucial market insights are presented clearly and effectively. Created by rektbyhielke, this script leverages the capabilities of Pine Script™ v5 for optimal performance.
By sharing this script, the aim is not only to provide a practical trading solution but also to inspire others to create indicators that are both beautiful and efficient.
the script includes fully customizable parameters for RSI length, stochastic length, and smoothing factors, allowing traders to tailor the indicator to their specific strategies. Overbought and oversold zones are marked with dots at levels 80 and 20, complemented by a subtle teal background fill to emphasize these areas.
Weighted Average Strength Index (WASI)Weighted Average Strength Index (WASI)
The Weighted Average Strength Index (WASI) is a variation of the standard RSI. It uses the Weighted Moving Average (WMA) instead of the Running Moving Average (RMA), making it more responsive to recent price changes. The hypothesis is that this weighted calculation might better capture momentum shifts, providing traders with more timely insights.
How to Use:
Backtest WASI on your preferred assets and timeframes to evaluate its effectiveness for your strategy.
Use for trend following or mean reversion :
- Overbought/Oversold (OB/OS) levels can signal potential mean-reversion opportunities.
- Midline (50 level) crossovers can be used for trend-following strategies.
- WASI and its moving average (MA) crossovers offer additional trend-following or reversal signals.
Parameters and Their Functions:
WASI Length: Determines the number of periods for WASI calculation. A longer length smooths the indicator but increases lag, while a shorter length makes it more sensitive. (When in doubt, go longer).
Source: The price source for the calculation (e.g., close, open, high, or low).
MA Type: Specifies the type of moving average applied to the WASI (options include SMA, EMA, WMA, HMA, and others).
MA Length: The number of periods for the moving average used on the WASI. Higher will lead to a smoother moving average.
Indicator Features:
Dynamic OB/OS Levels: Default overbought (70) and oversold (30) levels help identify potential reversal zones.
Midline Crossover: WASI crossing above or below the 50 level may indicate a trend shift.
WASI-MA Crossover: Crossovers between WASI and its moving average can signal trend-following or mean-reversion opportunities.
Disclaimer:
This indicator is a tool for analysis and should be used in conjunction with other forms of analysis or confirmation. Past performance does not guarantee future results.

Multiple RSITitle: MultiRSI: A Versatile Multi-Timeframe RSI Indicator
Short Description:
A powerful RSI-based indicator that incorporates three RSI lengths (Fast, Medium, and Slow) to help traders analyze trends, momentum, and potential reversals with clear visual signals.
Full Description:
Overview:
The MultiRSI script provides traders with a dynamic tool to assess market conditions across multiple RSI timeframes. It calculates Fast, Medium, and Slow RSI values, assigns meaningful colors based on trend analysis, and highlights key crossover points for actionable insights.
Key Features:
Triple RSI Display:
Fast RSI (default: 8): Ideal for capturing short-term momentum.
Medium RSI (default: 12): Provides a balanced perspective.
Slow RSI (default: 16): Helps identify longer-term trends.
Trend Analysis:
Color-coded RSI lines:
Green, blue, and aqua for uptrends.
Yellow, orange, and red for potential downtrends.
Visual differentiation for easy interpretation.
Crossover Signals:
Upward Cross (triangle up): Indicates potential bullish momentum.
Downward Cross (triangle down): Suggests possible bearish momentum.
Marked directly on the chart for clarity.
Customizable Inputs:
Adjust RSI lengths to suit your trading strategy.
Grouped input settings for a seamless configuration experience.
Usage Scenarios:
Identify trend strength and reversals in different timeframes.
Spot key momentum shifts with crossover signals.
Combine with other indicators for a comprehensive trading strategy.
How It Works:
The script compares the Fast RSI against the Medium RSI and the Medium RSI against the Slow RSI to determine short-, medium-, and long-term trends. Crossovers between Medium and Slow RSI values signal potential momentum shifts.
Visualization:
Clear, color-coded plots for the three RSI levels.
Highlighted crossovers for quick decision-making.
License:
This script is open-source under the Mozilla Public License 2.0. Feel free to use, modify, and share!

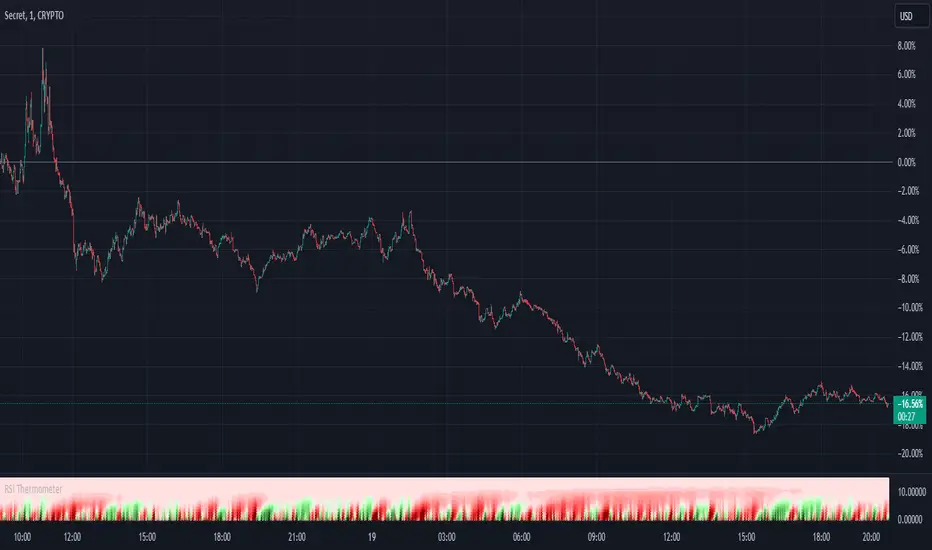
RSI ThermometerOverview:
The RSI Thermometer Indicator is a custom tool designed to help traders quickly gauge relative strength and potential overbought/oversold conditions across multiple timeframes. This indicator employs a series of color-coded RSI values to provide a visual representation of trend momentum, with a gradient ranging from deep red (indicating lower RSI values) to white (neutral around RSI 50) and up to deep green (indicating higher RSI values). By using this color-coding scheme, traders can easily identify shifts in market sentiment and momentum as they develop from shorter to longer timeframes.
Key Features:
Linear Color Gradient for RSI Levels (0-100): The indicator uses 41 distinct colors to visually represent RSI values. Lower RSI values are shown in darker reds, signaling potential oversold conditions, while higher RSI values appear in darker greens, suggesting potential overbought levels. Mid-range RSI values around 50 are shown in white, representing a neutral state. This color progression allows traders to evaluate trend conditions at a glance.
Multi-Timeframe Momentum Visualization: By observing color transitions across a sequence of RSI values from short to long timeframes, traders can assess how market momentum develops across different periods. This feature provides insight into the depth and potential strength of current trends.
Incremental RSI Periods: The RSI Thermometer applies RSI calculations across a range of periods (starting from 8 and increasing incrementally up to 488). This structure allows traders to capture both short-term fluctuations and longer-term trends, providing a balanced view of momentum across multiple timeframes.
Sequential Color Analysis: Each RSI value is represented by a unique color, offering a sequential analysis tool to easily observe trend direction. Consistent colors across the RSI periods indicate momentum in a particular direction, while mixed colors suggest consolidation or transitional phases.
Example Interpretations:
Bullish Momentum: When shorter-period RSI values (e.g., RSI 8, 24, 40) turn green and this color shift extends through to longer-period RSIs (up to RSI 488), it suggests that buying strength is present across timeframes. This pattern can help identify areas where bullish sentiment may be building.
Bearish Momentum: If shorter-period RSI values turn red and this trend continues through longer-period RSIs, it suggests that selling pressure is permeating across multiple timeframes, indicating potential bearish momentum.
How to Use the RSI Thermometer Indicator:
Observe Color Progression: Watch for consistent shifts in color across the RSI periods to determine the direction of momentum. Unified red or green colors across half or more of the periods indicate a stronger trend, while white or mixed colors may suggest a neutral or transitional phase.
Identify Potential Entry/Exit Zones: Look for green hues across multiple RSI periods to identify bullish momentum for potential entry points. Red hues, especially when consistent across several periods, may indicate selling pressure, signaling possible exit points.
Monitor for Reversals: Diverging colors across the RSI periods (e.g., shorter RSIs turning green while longer RSIs remain red) may indicate a trend reversal, providing an early warning for potential market shifts.
Application in Trading Strategy:
The RSI Thermometer Indicator is useful for both intraday and swing traders seeking to align trades with multi-timeframe momentum. By showing trend depth and the potential strength of momentum across timeframes, this tool simplifies market analysis and supports more informed decision-making.
Unlock deeper insights into market momentum with the RSI Thermometer Indicator—an intuitive tool that enhances your trading precision by visualizing trend strength and direction across multiple timeframes.
DT-DB - waynebrogenzaThis Pine Script™ indicator, DT-DB by waynebrogenza, is designed to help traders identify potential Double Tops (DT) and Double Bottoms (DB) on a price chart. These formations are powerful signals in technical analysis, often indicating reversals or key turning points in the market. Here's how it works and why it could change your trading game:
What It Does:
Detects Reversal Patterns:
Double Tops (DT): These typically signal a bearish reversal, meaning the price might start dropping after forming this pattern.
Double Bottoms (DB): These usually indicate a bullish reversal, suggesting the price could rise after forming this pattern.
Automates Signal Detection:
You don’t need to manually spot these patterns; the script does it for you in real time.
It plots Buy and Sell signals directly on your chart, making it easy to act quickly.
Volume and RSI Filters:
Ensures patterns are confirmed using volume and RSI (Relative Strength Index) divergence for better reliability.
Filters out weak or unreliable signals.
Custom Alerts:
You can set alerts for Buy and Sell signals, so you’re notified whenever an opportunity arises.
Visual Representation:
Highlighted zones (boxes) on the chart help you see where the patterns are forming and how price action evolves.
How It Can Help You:
Clarity in Chaos: Eliminates guesswork and provides clear trading signals, reducing emotional decision-making.
Time-Saving: Automatically scans the market for patterns so you can focus on strategy, not searching.
Confidence Booster: Filters like volume and RSI divergence ensure you’re acting on more reliable signals.
Beginner-Friendly: Even if you're new to trading, this indicator gives straightforward Buy and Sell cues, making it easy to get started.
Why It’s Life-Changing:
Trading can be overwhelming, especially if you’re not sure where to begin. This tool simplifies the process by giving you a structured way to identify profitable opportunities. By focusing on proven chart patterns and integrating confirmation signals, it helps you make better-informed trades and potentially achieve more consistent results.
Use this indicator to gain confidence, save time, and take your trading skills to the next level. Whether you're trading stocks, forex, or crypto, this script could become your new trading companion!

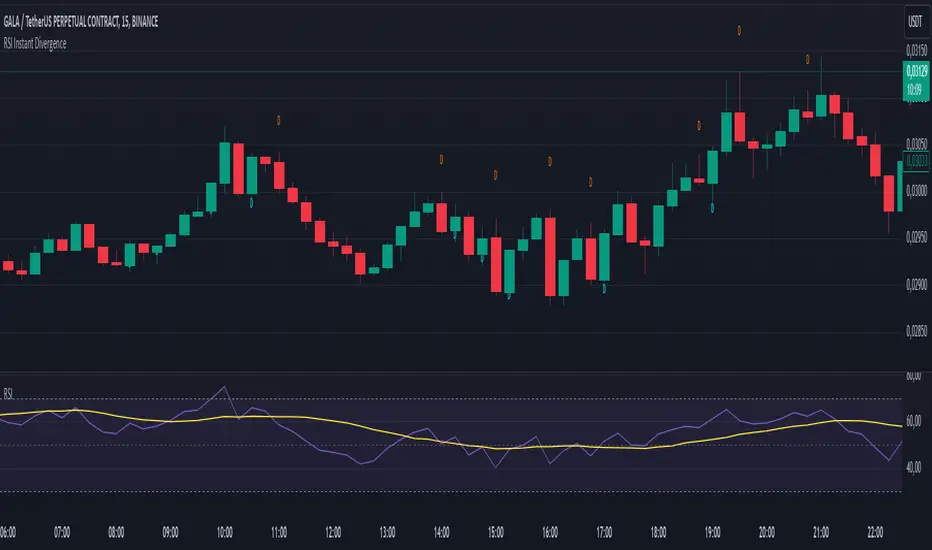
RSI Instant DivergenceThis script detects RSI divergence—a common signal indicating potential trend reversals. It compares price action and RSI behavior to identify two types of divergences:
1- Bearish Divergence (Sell Signal):
Occurs when the price forms a higher high while RSI drops (weaker momentum).
A label appears above the candle, and an alert is triggered: "Divergence: Sell Signal."
2 -Bullish Divergence (Buy Signal):
Occurs when the price makes a lower low while RSI rises (stronger momentum).
A label appears below the candle, and an alert is triggered: "Divergence: Buy Signal."
The labels are color-coded (orange for sell, blue for buy) and include detailed RSI and price info in a tooltip. Alerts help you act immediately when divergence is detected.
This tool is perfect for spotting potential trend reversals and refining your entry/exit strategy. Let me know if you'd like to customize it further! 😊
Tooltip Feature: Each label includes a tooltip with precise RSI and price details (current and previous values) as well as the percentage change in RSI, giving you deeper insight into the divergence. This tool is great for identifying trend reversal points and includes visual labels, tooltips, and alerts to make real-time trading decisions easier. Let me know if you’d like adjustments!
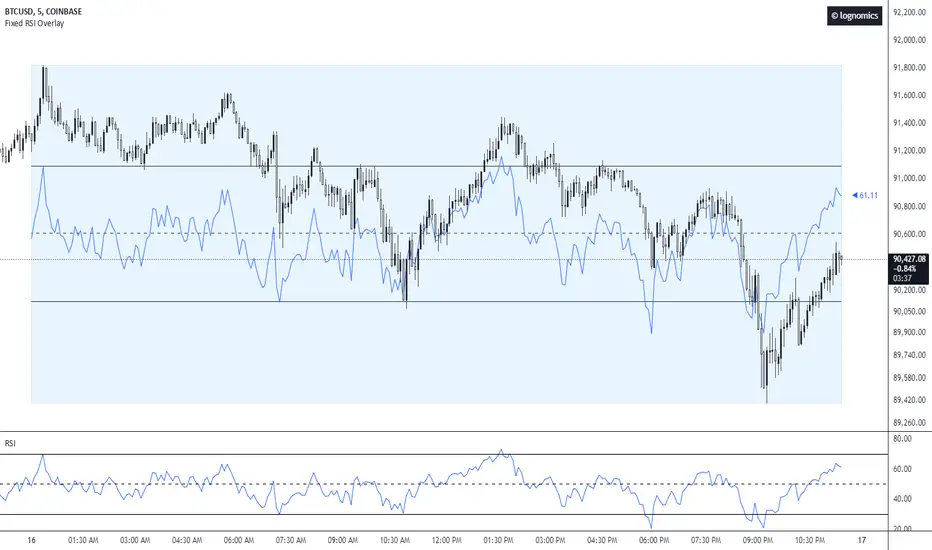
Fixed RSI Overlay [lognomics]This overlay indicator provides a dynamic visualization of the RSI on the instrument price chart. It enhances the standard RSI oscillator by scaling it relative to the anchor's maximum & minimum range, conceptualizing how price reacts at standard oscillation levels.
Starting at the anchor's open, the tool collects all the RSI values from each candle within the range, and stores them inside an array corresponding to each candle index. It then pulls relative values and plots a line connecting each point accordingly to the 0-100 range scale.
While determining each maximum and/or minimum the script will plot a box from the opening time of the anchor, encapsulating the high & low of the range, to end at the next anchor time. To the right to of the box, a label is plotted which is pushed to the current time & current RSI y value within the fixed scale.
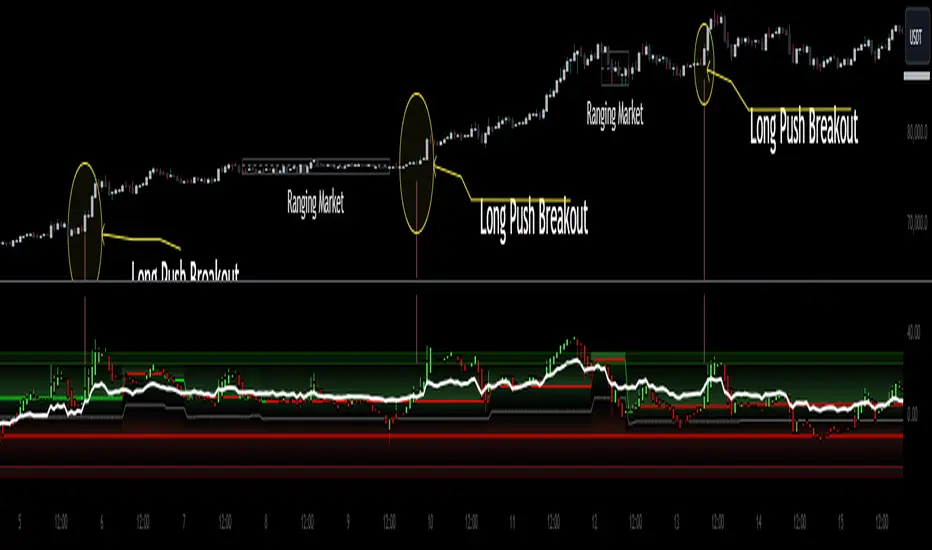
Heiken Ashi Algo Premium KillZoneTraders face daily challenges in navigating the fast-paced market, from waiting for higher timeframe data to delayed confirmation signals. This innovative system changes everything, offering tools that have never before been available in the trading community. With groundbreaking features like
KillZones
High Timeframe RSI (HTF RSI) and
True Midline
this system is seeks to solve major problems that hurt traders every day.
KillZones give traders an edge by pinpointing critical price levels where momentum and liquidity shift.
The Custom High Timeframe RSI brings real-time higher timeframe trend confirmation directly to your chart, eliminating the need to wait for candles to close. A totally new way to calculate HTF RSI without waiting for higher time candles to close.
The True Midline adjusts dynamically, showing exactly when the market is in equilibrium or transitioning between bullish and bearish momentum.
Custom Heiken-Ashi Oscillator Candles:
It uses customized Heiken Ashi candle calculations that allow it present trends more accurately while the candles are limited to an oscillator as opposed to price values. Candle up or candle down doesnt always mean long or short. Ive included a setting called "Secret Sauce Colors" to alter the colors of the Heiken Ashi candles so they will be colored to the actual trend taking place instead of just bullish or bearish closing.
The Liquidity Ribbon:
This indicator contains a built in customized version of a Stochastic Oscillator called "The Liquidity Ribbon" which shows you when liquidity of either side is entering and existing the market. It uses calculations of market and volume pressure to give you a visual representation of who is trying to alter asset pricing. This is NOT the stochastic RSI but I've given you guys an visual approach of something that looks similar.
The ribbon has bullish and bearish sides that flip over eachother. As one grows, the other shrinks so yo u can see in real time the flow of money from either side and whos winning.
Bullish and Bearish Premium and Discount Zones
What Are They?
Bullish and Bearish Premium and Discount Zones are visualized on the indicator as distinct colored sections within the oscillator, providing a quick snapshot of market conditions:
Bearish Premium Zone: Indicates areas of overextension in bearish momentum, often associated with ranging markets.
Bearish Discount Zone: Highlights opportunities where bearish trends are gaining strength and momentum is trending.
Bullish Discount Zone: Marks areas in bullish conditions where the market is consolidating or ranging.
Bullish Premium Zone: Identifies zones where bullish momentum is strong and trends are more pronounced.
How to Use Them?
For long trades, consider the following:
Scalping Opportunities: When the market is trending higher and Heiken-Ashi candles are closing above the high-timeframe RSI, short-term long scalps can be executed in the Discount Bullish Zone, where consolidation occurs.
Trending Trades: Larger, more sustained long trades can be taken when price moves into the Premium Bullish Zone, signaling stronger upward momentum.
Breakout Trading: When price crosses into a trending zone and simultaneously breaks through previous price resistance or support, this confluence solidifies entries for breakout trades across previous highs or lows, providing a higher probability for successful trades.
This structured use of Premium and Discount Zones gives traders a clear edge, offering insights into both market range and trend strength.
True Midline
What Is It?
The True Midline represents the dynamic equilibrium between buyers and sellers, adapting to real-time market activity. Unlike fixed midlines in traditional oscillators, it adjusts based on where buyers and sellers enter and exit the market.
How Does It Work?
The midline accounts for four key activities: buyer entry, buyer exit, seller entry, and seller exit. This holistic approach highlights shifts in momentum and periods of reduced activity, such as when both buyers and sellers exit simultaneously, creating larger ranging zones.
How to Use It?
Consolidation Zones: Narrow midline ranges signal market indecision, often preceding breakouts.
Momentum Shifts: Crossing above or below the midline indicates transitions into bullish or bearish conditions.
Ranging Markets: Identifies reduced interest during simultaneous buyer and seller exits, helping avoid false signals.
The True Midline offers a clearer picture of market balance, helping traders navigate trends and consolidations with confidence.
Dynamic Trending Zones:
What Are They?
Dynamic Trending Zones represent areas of high volatility and breakout potential, reflecting shifts in market momentum and participation. These zones are self-adjusting and directly influence the midline's position.
There are two zones:
Bullish Trending Zone: Signals increased buyer momentum.
Bearish Trending Zone: Signals increased seller momentum.
How Are They Calculated?
The zones are derived using a combination of volume pressure and momentum changes, but these changes need to be sufficient to have moved price over time:
The indicator tracks sudden shifts in momentum relative to volume changes to identify critical thresholds for breakouts.
A "need-to-cross" point is established in each zone, acting as a breakout trigger.
If opposing or additional volume and momentum are insufficient, the zone remains unchanged until market conditions shift.
This ensures the zones dynamically adapt to real-time market activity while maintaining accuracy during periods of indecision or consolidation.
How to Use Them?
Bullish Breakouts: Crossing into the bullish zone and breaking a previous resistance signals strong buyer momentum. Check for contraction in the bearish zone to confirm dominance.
Bearish Breakouts: Similarly, crossing into the bearish zone while breaking a support level confirms seller strength.
Momentum Confirmation: Ensure current momentum is leading the high-timeframe RSI for more reliable trade setups.
Zone Analysis : Expansion of a zone signals increased participation (e.g., more buyers or sellers entering), while contraction indicates reduced activity or that buyers and or sellers are closing their positions.
These zones provide actionable insights into breakout potential and market momentum, helping traders make informed decisions in volatile conditions.
High Timeframe RSI (HTF RSI)
What Is It?
The High Timeframe RSI gives you real-time higher timeframe RSI values directly on your lower timeframe chart. This means you don’t have to wait for the higher timeframe candle to close before seeing the RSI updates—it’s always live.
Why Is It Needed?
Normally, to see the RSI on a higher timeframe, you have to wait for that timeframe to close. This can be slow and lead to missed opportunities. The HTF RSI solves this by showing you the higher timeframe RSI values as soon as each lower timeframe candle closes, giving you faster insights and no delays.
How It works?
Rather than just using the standard RSI, the HTF RSI compares the momentum on your current timeframe with what it would be on the higher timeframe. It takes into account how many candles on your current chart fit into each higher timeframe candle. This makes sure that the higher timeframe RSI is accurate and reflects the real momentum, even when switching between timeframes.
How to Use It?
Trend Confirmation:
When the HTF RSI is above the midline, it shows a bullish trend on the higher timeframe, and if your current momentum is also bullish, it strengthens your trade setup.
When the HTF RSI is below the midline, it shows a bearish trend, and if your current momentum is bearish, it supports short trade setups.
If bearish momentum is above the HTF RSI, it suggests a local downtrend within a larger bullish trend.
Major Benefits
Custom Timeframes: You can use any higher timeframe you choose, not just the typical ones.
Real-Time Updates: Get higher timeframe RSI values with each candle, without delays.
Better Trading Insights: Align your trades with both lower and higher timeframe trends to make more informed decisions.
With HTF RSI, you get a clear view of higher timeframe trends in real time, so you can act faster and smarter on your trades.
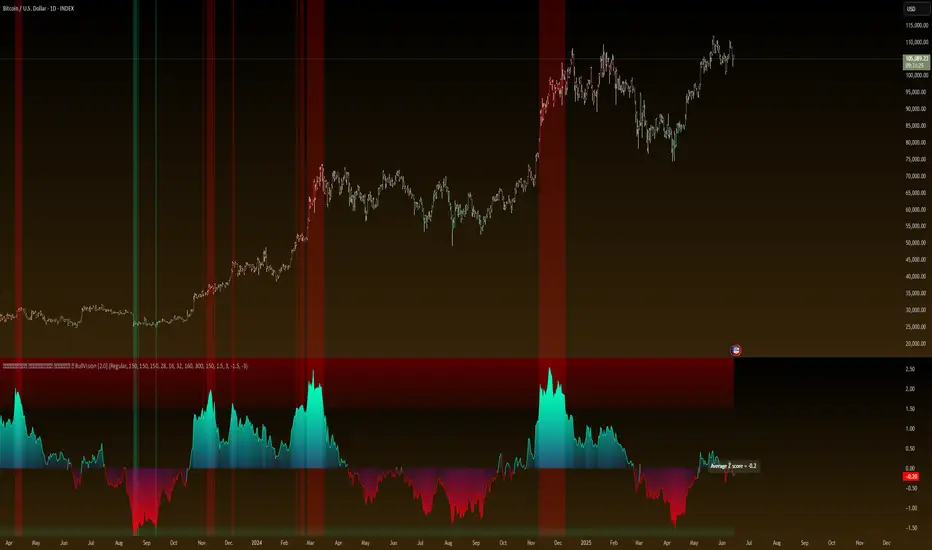
Universal Valuation System Overview 🔍
The Universal Valuation System (UVS) is an advanced valuation-focused indicator that provides insights into whether an asset is statistically overvalued or undervalued, helping traders understand where an asset sits within its historical value range. Unlike trend indicators, UVS emphasizes value analysis through a unique combination of performance ratios and statistical metrics, synthesizing this data into an overall Z-score. This score reflects the asset’s position within a typical normal distribution curve, allowing traders to make data-driven decisions based on historical valuation patterns.
Normal Distribution: A Statistical Foundation for Valuation 📊
The UVS leverages the normal distribution model as its core statistical framework. In a normal distribution, values tend to cluster around a central mean, with predictable probabilities for deviation. In financial markets, this means that most price or valuation levels hover around an average range, while extreme highs or lows are less frequent.
Under normal distribution:
68% of values lie within one standard deviation of the mean.
95% of values lie within two standard deviations.
99.7% of values lie within three standard deviations.
Using Z-scores, UVS calculates where current valuation metrics fall relative to this distribution, identifying overvalued (above-average) or undervalued (below-average) zones. This helps traders interpret an asset’s relative value, showing whether it is more likely to revert toward its mean or is experiencing an exceptional deviation.
Key Components and Ratios in UVS 🔀
UVS includes a range of valuation metrics that work together to determine the Z-score:
Sharpe Ratio: Measures return relative to risk, offering insight into the quality of returns.
Sortino Ratio: Focuses on downside deviation, helping gauge negative returns’ impact.
Omega Ratio: Assesses the likelihood of gains versus losses, providing a risk-adjusted performance measure.
Crosby Ratio: Examines volatility patterns, adding dimension to the valuation signal.
VWAP (Volume-Weighted Average Price) Z-Score: Assesses price relative to volume, highlighting valuation when volume supports price movements.
Price ROC Z-Score: Uses the rate of price change to give a volatility-adjusted price movement signal.
By averaging these ratios, UVS forms a composite Z-score representing an overall valuation signal. This Z-score directly reflects the asset’s position within its historical distribution, indicating whether it’s in a typical, overbought, or oversold range.
DCA (Dollar-Cost Averaging) Application with UVS 💵
The UVS provides powerful insights for those using Dollar-Cost Averaging (DCA) by signaling periods when an asset may be overvalued or undervalued relative to its historical distribution. This model-based approach helps traders strategically adjust their DCA timing:
Overvalued (Overbought) Zones:
When the Z-score indicates that an asset is in an overbought zone (typically above +2 standard deviations), DCA buyers may choose to reduce purchases or pause, as this zone suggests the asset is currently at a premium relative to its historical norms.
Undervalued (Oversold) Zones:
In undervalued regions (typically below -2 standard deviations), the UVS suggests a favorable accumulation point for DCA. These periods allow traders to buy at below-average valuations, optimizing their cost basis over time.
Valuation Zone Display and Accessibility 🌈
UVS includes several user-friendly display options, helping traders interpret its signals easily:
Composite Zone Highlighting: Displays overbought and oversold zones with color gradients, clearly visualizing statistical extremes.
Ratio Breakdown: Allows users to view individual Z-scores for each component, understanding the specific contributions to the overall valuation signal.
Color Blindness Mode: Offers multiple color settings to ensure clear interpretation across different visual needs.
Summary: Structured Value Analysis for Informed DCA Decisions
UVS is designed to be a reliable tool for traders looking to anchor their DCA and valuation-based strategies in statistical reality. By identifying valuation zones within a normal distribution framework, UVS enables a disciplined approach to asset accumulation based on relative value rather than price trends.
Important Note: UVS does not predict future performance. It provides a statistical view of historical valuation, which should be supplemented with additional analysis and risk management practices. Past patterns do not guarantee future results.
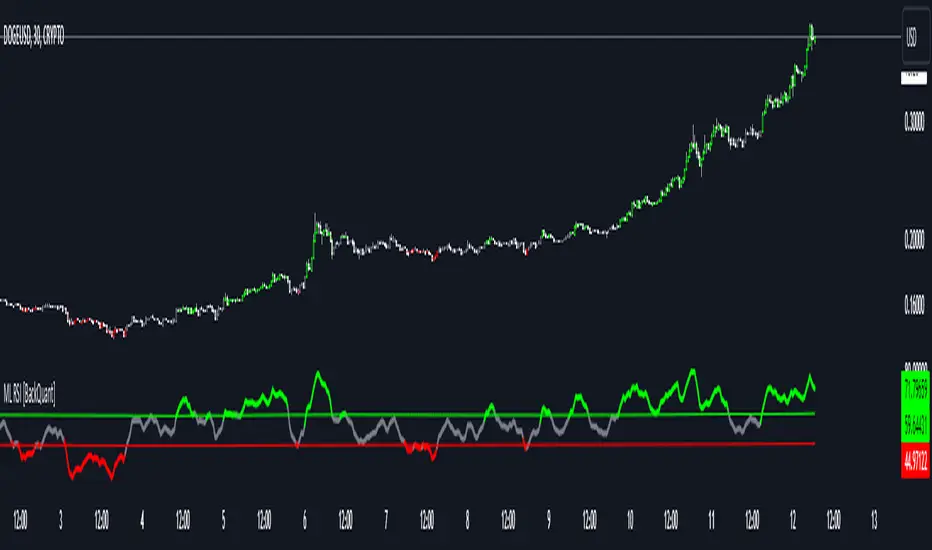
Machine Learning RSI [BackQuant]Machine Learning RSI
The Machine Learning RSI is a cutting-edge trading indicator that combines the power of Relative Strength Index (RSI) with Machine Learning (ML) clustering techniques to dynamically determine overbought and oversold thresholds. This advanced indicator adapts to market conditions in real-time, offering traders a robust tool for identifying optimal entry and exit points with increased precision.
Core Concept: Relative Strength Index (RSI)
The RSI is a well-known momentum oscillator that measures the speed and change of price movements, oscillating between 0 and 100. Typically, RSI values above 70 are considered overbought, and values below 30 are considered oversold. However, static thresholds may not be effective in all market conditions.
This script enhances the RSI by integrating a dynamic thresholding system powered by Machine Learning clustering, allowing it to adapt thresholds based on historical RSI behavior and market context.
Machine Learning Clustering for Dynamic Thresholds
The Machine Learning (ML) component uses clustering to calculate dynamic thresholds for overbought and oversold levels. Instead of relying on fixed RSI levels, this indicator clusters historical RSI values into three groups using a percentile-based initialization and iterative optimization:
Cluster 1: Represents lower RSI values (typically associated with oversold conditions).
Cluster 2: Represents mid-range RSI values.
Cluster 3: Represents higher RSI values (typically associated with overbought conditions).
Dynamic thresholds are determined as follows:
Long Threshold: The upper centroid value of Cluster 3.
Short Threshold: The lower centroid value of Cluster 1.
This approach ensures that the indicator adapts to the current market regime, providing more accurate signals in volatile or trending conditions.
Smoothing Options for RSI
To further enhance the effectiveness of the RSI, this script allows traders to apply various smoothing methods to the RSI calculation, including:
Simple Moving Average (SMA)
Exponential Moving Average (EMA)
Weighted Moving Average (WMA)
Hull Moving Average (HMA)
Linear Regression (LINREG)
Double Exponential Moving Average (DEMA)
Triple Exponential Moving Average (TEMA)
Adaptive Linear Moving Average (ALMA)
T3 Moving Average
Traders can select their preferred smoothing method and adjust the smoothing period to suit their trading style and market conditions. The option to smooth the RSI reduces noise and makes the indicator more reliable for detecting trends and reversals.
Long and Short Signals
The indicator generates long and short signals based on the relationship between the RSI value and the dynamic thresholds:
Long Signals: Triggered when the RSI crosses above the long threshold, signaling bullish momentum.
Short Signals: Triggered when the RSI falls below the short threshold, signaling bearish momentum.
These signals are dynamically adjusted to reflect real-time market conditions, making them more robust than static RSI signals.
Visualization and Clustering Insights
The Machine Learning RSI provides an intuitive and visually rich interface, including:
RSI Line: Plotted in real-time, color-coded based on its position relative to the dynamic thresholds (green for long, red for short, gray for neutral).
Dynamic Threshold Lines: The script plots the long and short thresholds calculated by the ML clustering process, providing a clear visual reference for overbought and oversold levels.
Cluster Plots: Each RSI cluster is displayed with distinct colors (green, orange, and red) to give traders insights into how RSI values are grouped and how the dynamic thresholds are derived.
Customization Options
The Machine Learning RSI is highly customizable, allowing traders to tailor the indicator to their preferences:
RSI Settings : Adjust the RSI length, source price, and smoothing method to match your trading strategy.
Threshold Settings : Define the range and step size for clustering thresholds, allowing you to fine-tune the clustering process.
Optimization Settings : Control the performance memory, maximum clustering steps, and maximum data points for ML calculations to ensure optimal performance.
UI Settings : Customize the appearance of the RSI plot, dynamic thresholds, and cluster plots. Traders can also enable or disable candle coloring based on trend direction.
Alerts and Automation
To assist traders in staying on top of market movements, the script includes alert conditions for key events:
Long Signal: When the RSI crosses above the long threshold.
Short Signal: When the RSI crosses below the short threshold.
These alerts can be configured to notify traders in real-time, enabling timely decisions without constant chart monitoring.
Trading Applications
The Machine Learning RSI is versatile and can be applied to various trading strategies, including:
Trend Following: By dynamically adjusting thresholds, this indicator is effective in identifying and following trends in real-time.
Reversal Trading: The ML clustering process helps identify extreme RSI levels, offering reliable signals for reversals.
Range-Bound Trading: The dynamic thresholds adapt to market conditions, making the indicator suitable for trading in sideways markets where static thresholds often fail.
Final Thoughts
The Machine Learning RSI represents a significant advancement in RSI-based trading indicators. By integrating Machine Learning clustering techniques, this script overcomes the limitations of static thresholds, providing dynamic, adaptive signals that respond to market conditions in real-time. With its robust visualization, customizable settings, and alert capabilities, this indicator is a powerful tool for traders seeking to enhance their momentum analysis and improve decision-making.
As always, thorough backtesting and integration into a broader trading strategy are recommended to maximize the effectiveness!
NASI +The NASI + indicator is an advanced adaptation of the classic McClellan Oscillator, a tool widely used to gauge market breadth. It calculates the McClellan Oscillator by measuring the difference between the 19-day and 39-day EMAs of net advancing issues, which are optionally adjusted to account for the relative strength of advancing vs. declining stocks.
To enhance this analysis, NASI + applies the Relative Strength Index (RSI) to the cumulative McClellan Oscillator values, generating a unique momentum-based view of market breadth. Additionally, two extra EMAs—a 10-day and a 4-day EMA—are applied to the RSI, providing further refinement to signals for overbought and oversold conditions.
With NASI +, users benefit from:
-A deeper analysis of market momentum through cumulative breadth data.
-Enhanced sensitivity to trend shifts with the applied RSI and dual EMAs.
-Clear visual cues for overbought and oversold conditions, aiding in intuitive signal identification.

MACD+RSI+BBDESCRIPTION
The MACD + RSI + Bollinger Bands Indicator is a comprehensive technical analysis tool designed for traders and investors to identify potential market trends and reversals. This script combines three indicators: the Moving Average Convergence Divergence (MACD), the Relative Strength Index (RSI), and Bollinger Bands. Each of these indicators provides unique insights into market behavior.
FEATURES
MACD (Moving Average Convergence Divergence)
The MACD is a trend-following momentum indicator that shows the relationship between two moving averages of a security’s price.
The script calculates the MACD line, the signal line, and the histogram, which visually represents the difference between the MACD line and the signal line.
RSI (Relative Strength Index)
The RSI is a momentum oscillator that measures the speed and change of price movements. It ranges from 0 to 100 and is typically used to identify overbought or oversold conditions.
The script allows users to set custom upper and lower thresholds for the RSI, with default values of 70 and 30, respectively.
Bollinger Bands
Bollinger Bands consist of a middle band (EMA) and two outer bands (standard deviations away from the EMA). They help traders identify volatility and potential price reversals.
The script allows users to customize the length of the Bollinger Bands and the multiplier for the standard deviation.
Color-Coding Logic
The histogram color changes based on the following conditions:
Black: If the RSI is above the upper threshold and the closing price is above the upper Bollinger Band, or if the RSI is below the lower threshold and the closing price is below the lower Bollinger Band.
Green (#4caf50): If the RSI is above the upper threshold but the closing price is not above the upper Bollinger Band.
Light Green (#a5d6a7): If the histogram is positive and the RSI is not above the upper threshold.
Red (#f23645): If the RSI is below the lower threshold but the closing price is not below the lower Bollinger Band.
Light Red (#faa1a4): If the histogram is negative and the RSI is not below the lower threshold.
Inputs
Bollinger Bands Settings
Length: The number of periods for the moving average.
Basis MA Type: The type of moving average (SMA, EMA, SMMA, WMA, VWMA).
Source: The price source for the Bollinger Bands calculation.
StdDev: The multiplier for the standard deviation.
RSI Settings
RSI Length: The number of periods for the RSI calculation.
RSI Upper: The upper threshold for the RSI.
RSI Lower: The lower threshold for the RSI.
Source: The price source for the RSI calculation.
MACD Settings
Fast Length: The length for the fast moving average.
Slow Length: The length for the slow moving average.
Signal Smoothing: The length for the signal line smoothing.
Oscillator MA Type: The type of moving average for the MACD calculation.
Signal Line MA Type: The type of moving average for the signal line.
Usage
This indicator is suitable for various trading strategies, including day trading, swing trading, and long-term investing.
Traders can use the MACD histogram to identify potential buy and sell signals, while the RSI can help confirm overbought or oversold conditions.
The Bollinger Bands provide context for price volatility and potential breakout or reversal points.
Example:
From the example, it can clearly see that the Selling Climax and Buying Climax, marked as orange circle when a black histogram occurs.
Conclusion
The MACD + RSI + Bollinger Bands Indicator is a versatile tool that combines multiple technical analysis methods to provide traders with a comprehensive view of market conditions. By utilizing this script, traders can enhance their analysis and improve their decision-making process.
