Simple Buy Sell SignalsIt is a simple indicator that provides buy or sell signals based on the intersection of two EMAs and a simple moving average (SMA). once the Relative Strength Index has confirmed it. For greater accuracy, add additional indicators like stochastic RSI, MACD, etc. Use only for intraday trading, Not for Positional Trading
Relative Strength Index (RSI)

RSI OS/OS Levels MTFThis plots the overbought and oversold (70 and 30) levels from RSI on price, there are often levels where a market will bounce or retrace/reverse.
By default it shows 15 min, 60 min and 4 hour levels but I intend to make these configurable along with some other stuff. For now it works how I use it, nice and simple

Range Strat - MACD/RSIThis strategy uses a trend based indicator (MACD) for entry/exit signals with a momentum oscillator (RSI) to act as confirmation. Although relying on a trend based indicator this has been created for range bound crypto markets, which have been in a period of chop since June 2022.
Long/Short signals are generated from MACD with the RSI oscillator thresholds suppressing entries at price extremes. This is not a mean reversion RSI strategy! As the indicators are contrary to each other you will need to be generous with the RSI settings in order for signals to trigger.
Strategy is designed for use on the 4h timeframe, it may work well on higher timeframes, but lower time frames will lead to false signals. Use fixed percentage of equity for order size to capture the compounding effect. As a reversal strategy bear in mind that should market trend strongly in either direction stops will be required.
The RSI thresholds can be tailored to provide higher frequency or safer signals. Similarly tweaking MACD settings will provide earlier/more frequent or safer signals. As this is intended to enter near range high / low you should check the visual cues to ensure a ping-pong effect is observed, so that peaks and troughs are captured. Once an observable range is established the strategy works well across a range of crypto markets,
The script is open source, so feel free to amend as you wish. Using a different momentum oscillator may provide better results. I have prior coding experience, but first time using PineScript was last night, so it's not very tidy. I will update this with some additional customisation and TP/SL in the near future.
Usage: Range bound markets
Markets: Cryptocurrency Alts/BTC/ETH
Timeframe: 4h

Take Profit On Trend v2 (by BHD_Trade_Bot)The purpose of strategy is to detect long-term uptrend and short-term downtrend so that you can easy to take profit.
The strategy also using BHD unit to detect how big you win and lose, so that you can use this strategy for all coins without worry about it have different percentage of price change.
ENTRY
The buy order is placed on assets that have long-term uptrend and short-term downtrend:
- Long-term uptrend condition: ema200 is going up
- Short-term downtrend condition: 2 last candles are down price (use candlestick for less delay)
CLOSE
The sell order is placed when take profit or stop loss:
- Take profit: price increase 2 BHD unit
- Stop loss: price decrease 3 BHD unit
The strategy use $1000 for initial capital and trading fee is 0.1% for each order.
Pro tip: The 1-hour time frame for ETH/USDT has the best results on average.

RSI TrendRSI Hull Trend is a hybrid indicator with RSI of HULL Signal. The Hull MA is combined with RSI to see if the Hull MA Buy/Sell Signal is in overbought or oversold condition. Buy Sell Signals are plotted based on settings of OB/OS or RSI. This indicator is very useful to see if the Trend is in Exhaustion or Beginning of a Trend. Entry and Exit conditions can be more precise based on OB/OS condition of price action. In addition normal RSI trend is plotted with trend color from Hull MA. Best Performance with Heiken Ashi Candles.
OB/OS Settings provided
Hull Buy/Sell Signals plotted
Double RSI FAST and DEFAULT signal with crossover
Bar Color applied based on Hull RSI Trend
Hull Trend + RSI + Price Action

Triple RSI strategyThis strategy is commonly used both in forex and stock markets for reversal trading. when the rsi line reaches and crosses simultaneously at 3 rsi setups i.e at 7, 14, and 21, a signal is generated.
This strategy works best in 1-hour timeframe. It provides over 60 to 80 percent accuracy in 1-hour timeframe.
In the stock market, this strategy provides an excellent entry point, if one is seeking small profits.
One can expect to make around 10 to 50 pips in the forex market easily. However, I advise seeking support from price action from the lower timeframe in the forex market.
I hope you like it.
Follow for more strategies and scripts like this.

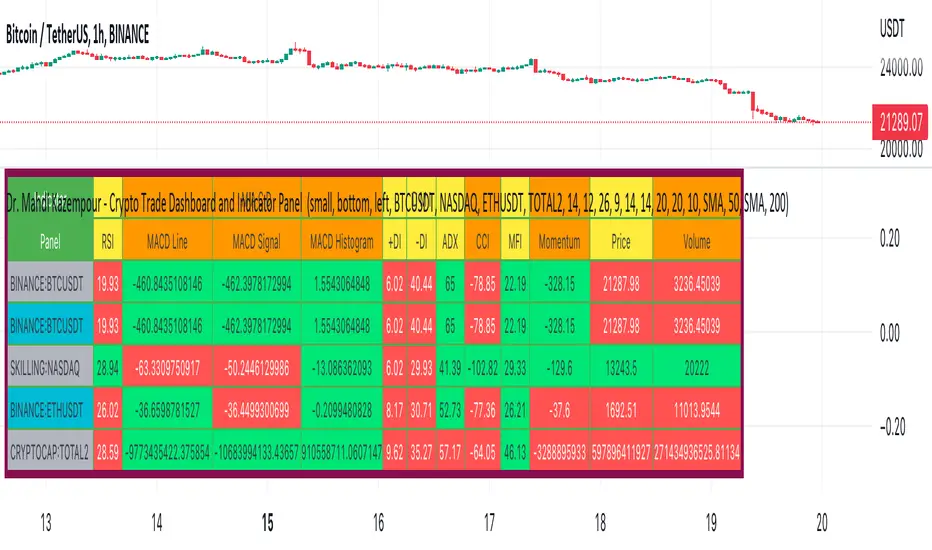
Dr. Mahdi Kazempour - Crypto Trade Dashboard and Indicator PanelA great panel for crypto traders all in one table:
Price, Volume, RSI, MACD, ADI, MOM
1) current symbol
2) BTCUSDT
3) NASDAQ
4) ETHUSDT
5) TOTAL2
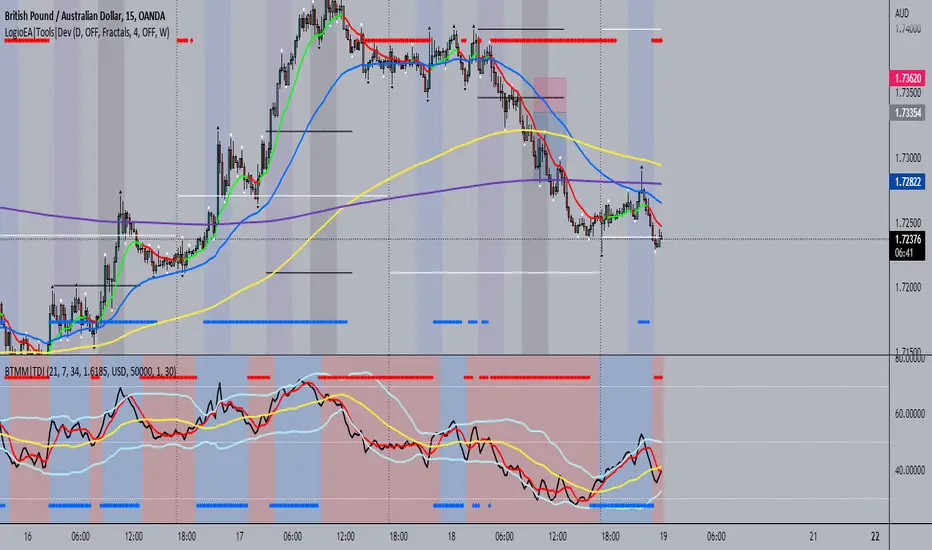
BTMM|TDIThis is the trader's dynamic index inspired by Steve Mauro's BTMM strategy.
In addition to the RSI, Trendline, Baseline, Volatility Bands I have also included additional trend biases that are painted in the background to provide more confluence when the markets break out in either direction.
For convenience, a position size calculator is included for all users to quickly calculate lot sizes on forex pairs with difference account balance currencies. The calculator works accurately on forex pairs. DO NOT USE for crypto or indices as some brokers have unique contract sizes that could not be fully incorporated into the tool.
There is also data table that displays historical values of the RSI, Trendline, Baseline, and an EMA vs Price scoring procedure that covers the current candle (t0) and up to 3 candles back. The table is meant to provide a snapshot view of either bullish or bearish dominance that can be deciphered with a quick glance.
Rsi/W%R/Stoch/Mfi: HTF overlay mini-plotsOverlay mini-plots for various indicators. Shows current timeframe; and option to plot 2x higher timeframes (i.e. 15min and 60min on the 5min chart above).
The idea is to de-clutter chart when you just want real-time snippets for an indicator.
Useful for gauging overbought/oversold, across timeframes, at a glance.
~~Indicators~~
~RSI: Relative strength index
~W%R: Williams percent range
~Stochastic
~MFI: Money flow index
~~Inputs~~
~indicator length (NB default is set to 12, NOT the standard 14)
~choose 2x HTFs, show/hide HTF plots
~choose number of bars to show (current timeframe only; HTF plots show only 6 bars)
~horizontal position: offset (bars); shift plots right or left. Can be negative
~vertical position: top/middle/bottom
~other formatting options (color, line thickness, show/hide labels, 70/30 lines, 80/20 lines)
~~tips~~
~should be relatively easy to add further indicators, so long as they are 0-100 based; by editing lines 9 and 11
~change the vertical compression of the plots by playing around with the numbers (+100, -400, etc) in lines 24 and 25

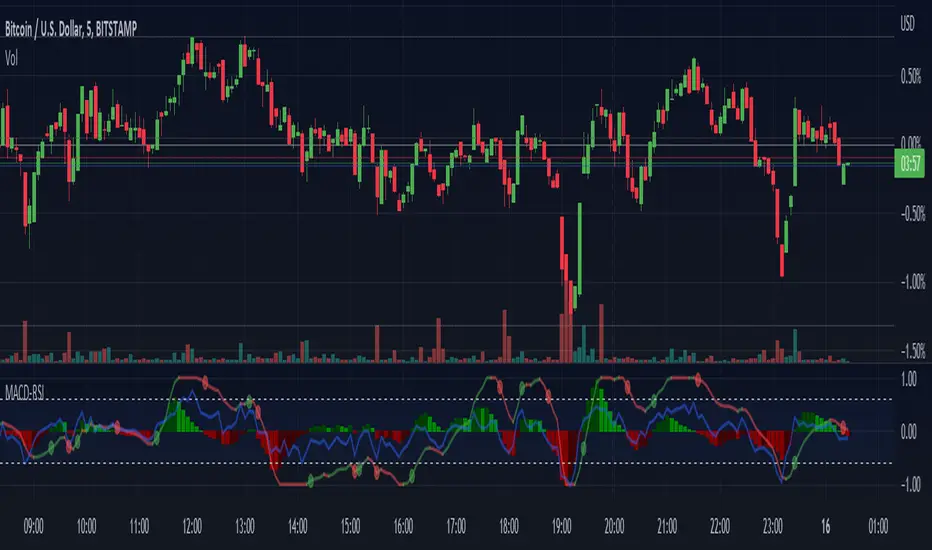
Normalized MACD with RSI [bkeevil]This indicator normalizes the MACD and RSI indicators to a range between -1.0 and 1.0 so they can be displayed together on the same chart to save screen real-estate.
While the MACD is a good indicator to detect trend changes, in some circumstances (such as a sideways range market) it can give false signals. The MACD is more likely to give a false signal when the RSI indicator is close to the centerline than if the RSI is signaling an overbought or oversold condition. Thus the RSI indicator and MACD indicator are commonly used together.
I have included a few features found in other MACD indicators that I have found helpful:
MACD line changes color if it is rising or falling
Dots at the MACD line to signal crossovers
The MACD signal line is hidden it by default as the information it contains is redundant. Hiding the signal line makes the indicator less busy.
Short Term RSI and SMA Percentage ChangeThis strategy utilises common indicators like RSI and moving averages in order to enter and exit trades. The Relative Strength Index (RSI) is a momentum indicator that has a value between 0 and 100, where a value greater than 70 is considered overbought and a value less than 30 is oversold. If the RSI value is above or below these values, then it can signal a possible trend reversal.
The second indicator used in this strategy is the Simple Moving Average (SMA). A SMA is an arithmetic moving average calculated by adding recent prices and then dividing that figure by the number of time periods in the calculation average. For example, one could add the closing price of a coin for a number of time periods and then divide this total by that same number of periods. Short-term averages respond quickly to changes in the price of the underlying coin, while long-term averages are slower to react.
Long/Exit orders are placed when three basic signals are triggered.
Long Position:
RSI is greater than 50
MA9 is greater than MA100
MA9 increases by 6%
Exit Position:
Price increases 5% trailing
Price decreases 5% trailing
The script is backtested from 1 May 2022 and provides good returns.
A trading fee of 0.1% is also taken into account and is aligned to the base fee applied on Binance.
This script also works well on AVAX 45m/1h, MATIC 15m/45m/1h and ETH 4h.

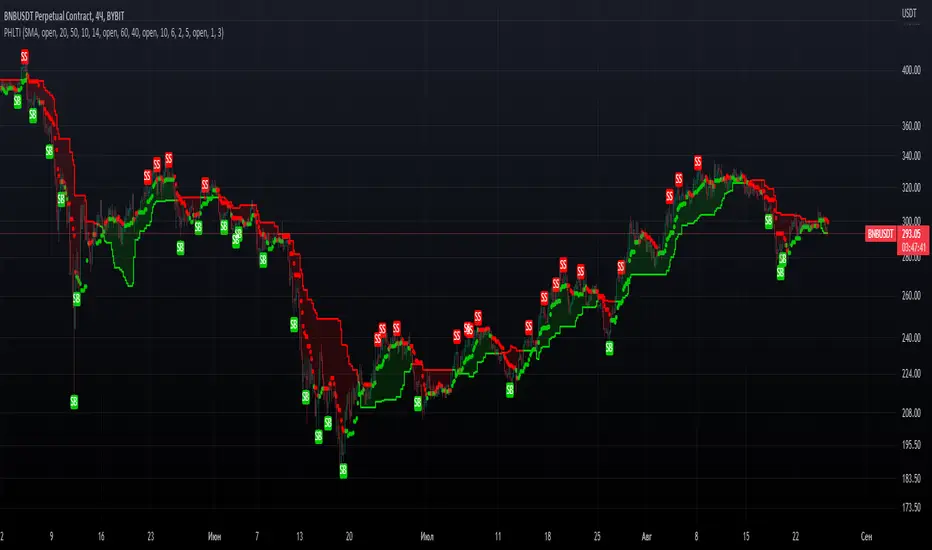
PrevHighLow Trend IndicatorPrevHighLow Trend Indicator which is calculated by using prev lowest and highest of p1 -period and p2 -period for two MAs.
First MA is made of prev highest of p1-period / prev lowest of p1-period.
Second MA is faster, made up of p2(<p1)- period(same formula).
Can be used in the next way: slower MA(straight line) shows main trend, faster shows temporary trend.
BUY, when first MA and second MA are green; Exit: second MA changes from green to red.
SELL, when first MA and second MA are red; Exit: second MA changes from red to green.
RSI Assistant basically filtres signals in the way, when signals from RSI and Faster MA are similar? it signals about it with labels: BUY for long, SELL for short. You can either enable or disable it. Also customizable so you can find your setup. RSI Assistant, depending on you customize it, can help you either follow trend or show reversals. Just find your own setup and watch things happen!
Feel free to leave valuable feedback and your setups which you consider to be good.
Hope you PHLTI usefull. Good luck!
Ultimate RSI - Divergence + S/R + Reverse RSIThis is a modification of the TradingView RSI with some of my favourite RSI features added.
This includes Divergence indicators. EMA with colour change on cross, Support and resistance lines and reverse RSI.
A reverse calc has also been added. This will allow you to input 3 different RSI values for a price prediction. This is good to use with the support and resistance lines and can give you key areas on the chart where the price may bounce/reject.
All colours and modifications can be turned on/off.
Enjoy! :)

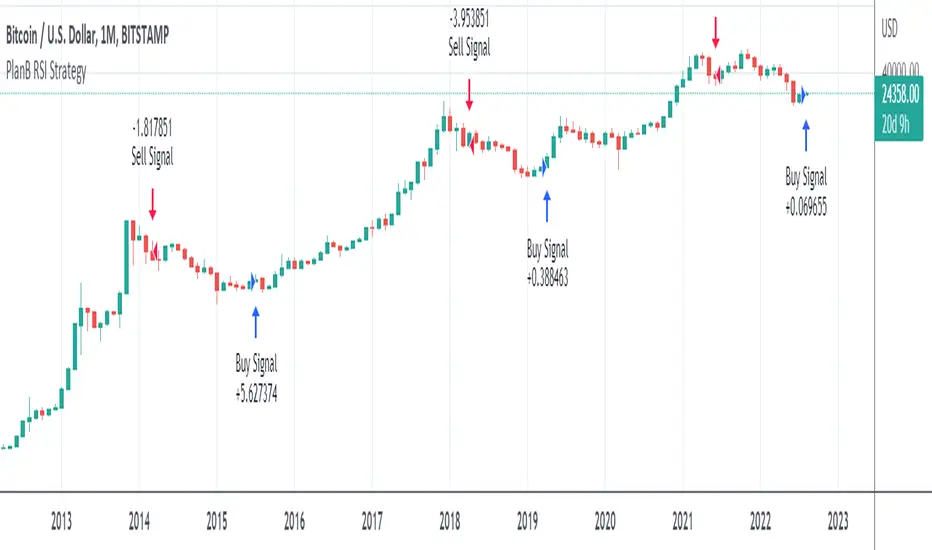
PlanB Quant Investing 101 v2This script has been Inspired by PlanB Article Quant Investing 101.
With this script, I implemented Plan B strategy outlined in that article, trying to reproduce his findings independently and allowing TradeView Users to do the same.
PlabB is aware of this effort, and he's positive about it, via Twitter commenting, liking and sharing of this resource .
Trading Idea:
This script uses RSI index to determine the Buy And Sell signal.
As per the original PlanB article:
IF ( RSI was above 90% last six months AND drops below 65%) THEN sell,
IF ( RSI was below 50% last six months AND jumps +2% from the low) THEN buy, ELSE hold
My simple code is aimed at replicating his study in Pine so that every TV user can check his signal.
Multi Type RSI [Misu]█ This Indicator is based on RSI ( Relative Strength Index ) & multiple type of MA (Moving Average) to show different variations of RSI.
The relative strength index (RSI) is a momentum indicator used in technical analysis to evaluate overvalued or undervalued conditions in the price of that security.
█ Usages:
The purpose of this indicator is to obtain the RSI calculated with different MAs modes instead of the classic RMA.
The red and green zones indicate the oversold and overbought zones.
Buy or sell signals are marked by the green and red circles
We have 2 different signal modes : when the different size RSIs cross and when the fast RSI crosses the extreme bands.
Alerts are setup.
█ Parameters:
Lenght RSI: The lenght of the RSI. (14 by default)
RSI MA Type: The type of MA with which the rsi will be calculated. ("SMA", "EMA", "SMMA (RMA)", "WMA", "VWMA")
Fast Lenght MA: The fast lenght smoothing MA.
Slow Lenght MA: The Slow lenght smoothing MA.
Lower Band: The lenght of the lower band. (25 by default)
Upper Band: The lenght of the upper band. (75 by default)
Signal Type: The mode with which buy and sell signals are triggered. ("Cross 2 Mas", "Cross Ma/Bands")

Commodity Channel Relative StrengthNew concept(I think atleast) I've joined the Standard RSI and CCI at the hip with another plotcandle, which gives a picture of a larger candle With more interesting movement imo. Includes Fib Retracement Levels, High/Low and a couple of coppock curves for more confirmation. Broadening candles seem to indicate a weakening of trend strength (from what i've seen atleast) although exceptions do occur. Vice versa for tapering to a lesser degree I imagine. RSI has been shifted down to 0 to align the center point with the CCI , so the usual 30/70 RSI Levels are now -20/20 (although I have 30/-30 instead for the hlines).
