RSI of Zero Lag MA (ValueRay)The RSI of a Zero Lag Moving Average a powerful tool for for reliable exit signals.
The Relative Strength Index (RSI) is a widely recognized momentum oscillator that measures the speed and change of price movements. It provides valuable insights into overbought and oversold conditions, enabling traders to identify potential reversal points and take advantage of market inefficiencies.
The RSI of a Zero Lag Indicator takes this concept a step further by incorporating the Zero Lag Moving Average. The Zero Lag Moving Average is a cutting-edge indicator that minimizes lag and provides a smoother representation of price action, allowing for quicker and more precise responses to market movements.
By combining the RSI with the Zero Lag Moving Average, this indicator offers traders a superior exit strategy. When the RSI reaches extreme levels of overbought or oversold conditions, it indicates a potential reversal in the market. The Zero Lag Moving Average further enhances this signal by reducing delays and providing timely exit points.
Moreover, the RSI of a Zero Lag Indicator is not limited to mean reversion strategies. While it excels in identifying mean reversion opportunities, it can also be used in conjunction with other trading approaches. Traders can take advantage of its objective signals to exit trades profitably, regardless of their chosen strategy.
With its ability to accurately pinpoint overbought and oversold conditions, the RSI of a Zero Lag Indicator offers traders a competitive edge in the market. By providing timely exit signals and minimizing lag, it helps traders optimize their trading decisions and increase their chances of success.
Relative Strength Index (RSI)

Multi-Divergence Buy/Sell IndicatorThe "Multi-Divergence Buy/Sell Indicator" is a technical analysis tool that combines multiple divergence signals from different indicators to identify potential buy and sell opportunities in the market. Here's a breakdown of how the indicator works and how to use it:
Input Parameters:
RSI Length: Specifies the length of the RSI (Relative Strength Index) calculation.
MACD Short Length: Specifies the short-term length for the MACD (Moving Average Convergence Divergence) calculation.
MACD Long Length: Specifies the long-term length for the MACD calculation.
MACD Signal Smoothing: Specifies the smoothing length for the MACD signal line calculation.
Stochastic Length: Specifies the length of the Stochastic oscillator calculation.
Stochastic Overbought Level: Defines the overbought level for the Stochastic oscillator.
Stochastic Oversold Level: Defines the oversold level for the Stochastic oscillator.
Calculation of Indicators:
RSI: Calculates the RSI based on the specified RSI Length.
MACD: Calculates the MACD line, signal line, and histogram based on the specified MACD parameters.
Stochastic: Calculates the Stochastic oscillator based on the specified Stochastic parameters.
Divergence Detection:
RSI Divergence: Identifies a bullish divergence when the RSI crosses above its 14-period simple moving average (SMA).
MACD Divergence: Identifies a bullish divergence when the MACD line crosses above the signal line.
Stochastic Divergence: Identifies a bullish divergence when the Stochastic crosses above its 14-period SMA.
Buy and Sell Conditions:
Buy Condition: Triggers a buy signal when all three divergences (RSI, MACD, and Stochastic) occur simultaneously.
Sell Condition: Triggers a sell signal when both RSI and MACD divergences occur, but Stochastic divergence does not occur.
Plotting Buy/Sell Signals:
The indicator plots green "Buy" labels below the price bars when the buy condition is met.
It plots red "Sell" labels above the price bars when the sell condition is met.
Usage:
The indicator can be used on any timeframe and for any trading instrument.
Look for areas where all three divergences (RSI, MACD, and Stochastic) align to generate stronger buy and sell signals.
Consider additional technical analysis and risk management strategies to validate the signals and manage your trades effectively.
Remember, no indicator guarantees profitable trades, so it's essential to use this indicator in conjunction with other tools and perform thorough analysis before making trading decisions.
Feel free to ask any questions

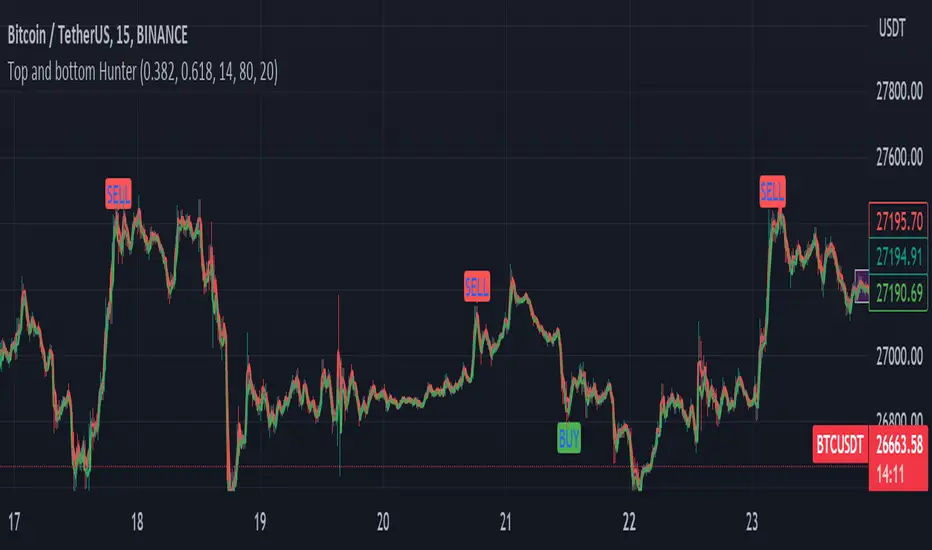
Fib top and bottom Hunter - No Repaint "Top and bottom Hunter" indicator combines two popular technical analysis tools, Fibonacci retracement levels and the Relative Strength Index (RSI), to identify potential trading opportunities in the market.
Fibonacci retracement levels are based on the Fibonacci sequence, a mathematical series where each number is the sum of the two preceding ones. In trading, Fibonacci retracement levels are used to identify potential support and resistance levels based on the recent price action. The indicator uses two Fibonacci levels, fib_0 and fib_1, which are typically set to 0.382 and 0.618, respectively. These levels represent common retracement ratios.
To calculate the Fibonacci levels, the indicator considers the highest and lowest prices within a specified range, typically the highest and lowest of the last two bars. It calculates the fib_range, which is the difference between the highest and lowest prices. Then, fib_level_0 and fib_level_1 are determined by subtracting the Fibonacci ratios from the highest price.
The RSI is a momentum oscillator that measures the speed and change of price movements. It helps identify overbought and oversold conditions in the market. The RSI parameters used in this indicator are rsi_length (length of the RSI calculation), rsi_overbought (upper threshold indicating overbought conditions), and rsi_oversold (lower threshold indicating oversold conditions). The RSI value is calculated based on the closing prices.
The indicator generates buy and sell signals based on specific conditions:
Buy Condition: A buy signal is triggered when the RSI crosses above the oversold level (rsi_oversold) and the closing price is higher than fib_level_1. This indicates a potential reversal or bounce from the Fibonacci support level.
Sell Condition: A sell signal is triggered when the RSI crosses below the overbought level (rsi_overbought) and the closing price is lower than fib_level_0. This suggests a potential reversal or pullback from the Fibonacci resistance level.
In summary, this indicator combines the power of Fibonacci retracement levels and the RSI to identify potential trading opportunities. It helps traders find confluence between the Fibonacci support or resistance levels and the RSI readings, indicating potential trend reversals or bounces. Traders can use this information to make informed decisions about entering or exiting positions in the market.
Feel free to change the settings for what works best for you and use this with other confluences. I personally use RSI overbought and oversold values as 80 and 20
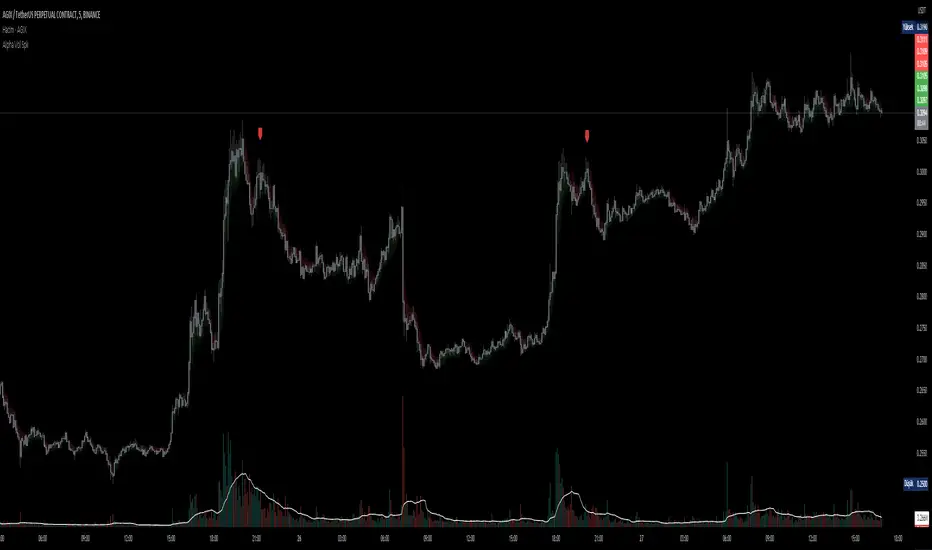
D-BoT Alpha Volume SpikeHello traders, Let me explain the code and provide an example of how to trade using this indicator.
The code you provided is a Pine Script indicator that combines multiple technical indicators, such as Supertrend, ADX, RSI, and MFI, to generate buy and sell signals. Here's a breakdown of the code:
User Settings:
The user can adjust parameters like overbought_limit, oversold_limit, volume_multiplier, volume_ma_length, volume_spike_multiple, lookback_period, and use_extremities_confirmation according to their preference.
Calculate Supertrend:
The Supertrend indicator is calculated using three different ATR lengths (supertrend_atr_period1, supertrend_atr_period2, supertrend_atr_period3) and corresponding factors (supertrend_factor1, supertrend_factor2, supertrend_factor3).
The supertrend_value1, supertrend_value2, and supertrend_value3 represent the Supertrend values, while trend_direction1, trend_direction2, and trend_direction3 indicate the trend direction (negative for downtrend, positive for uptrend).
Candle calculations:
The high and low values are checked to identify bullish and bearish candles based on specific conditions.
Volume Spikes:
Volume spikes are detected by comparing the current volume with a median volume over a specified lookback period.
If the volume exceeds a certain multiple of the median volume and the DI+ value is greater than the DI- value, an "up" signal is generated. Similarly, if the DI- value is greater than the DI+ value, a "down" signal is generated.
Additional Filters (RSI and MFI):
Relative Strength Index (RSI) and Money Flow Index (MFI) are used as additional filters.
The RSI and MFI parameters can be adjusted according to the user's preference.
The signals generated by the volume spikes are filtered based on RSI and MFI conditions.
Plotting:
The indicator plots shapes (triangles) to represent buy and sell signals.
The Supertrend lines are plotted using different colors and transparency levels based on the distance from the current price.
The "bodyMiddle" plot is used for filling the area between the Supertrend lines.
Example Trade Scenario:
Let's consider an example trade scenario using this indicator:
When the indicator generates an "up" signal (trendBuy = true), indicating a potential bullish trend, and all the confirmation conditions (RSI, MFI, Supertrend) are met, you can consider opening a long position.
Conversely, when the indicator generates a "down" signal (trendSell = true), indicating a potential bearish trend, and all the confirmation conditions are met, you can consider opening a short position.
Remember, this is just an example, and it's crucial to perform thorough analysis and consider other factors before making trading decisions. It's recommended to backtest the strategy, assess risk management, and apply appropriate position sizing techniques.
Please note that the code provided is a simplified version, and there might be additional factors and considerations specific to your trading strategy that are not included in this code. *******"I have also reviewed the following indicators, and the volume calculation approaches of my friends have been very helpful in creating this indicator: "Volume Spikes " © tradeforopp and "Volume Spikes & Growing Volume Signals With Alerts & Scanner" © FriendOfTheTrend."*******
TTP NVT StudioNVT Studio is an indicator that aims to find areas of reversal of the Bitcoin price based on the extreme areas of Network Value Transaction.
Instructions:
- We recommend using it on INDEX:BTCUSD
- Use the daily or weekly timeframe
The indicator works as an oscillator and offers to visualisation modes.
1) Showing the short term oscillations of NVT showing signals in potential areas of reversal.
2) The actual value of NVT displayed. When in green is an area of value and in red when its overextended.
This indicator can be used based on the signals or based on breakouts of trend lines drawn in the oscillator mode.
Red/green dots: signal type 1 - extremes with confirmation, these might trigger late
Yellow/Orange: signal type 2 - extremes without confirmation, might trigger too soon

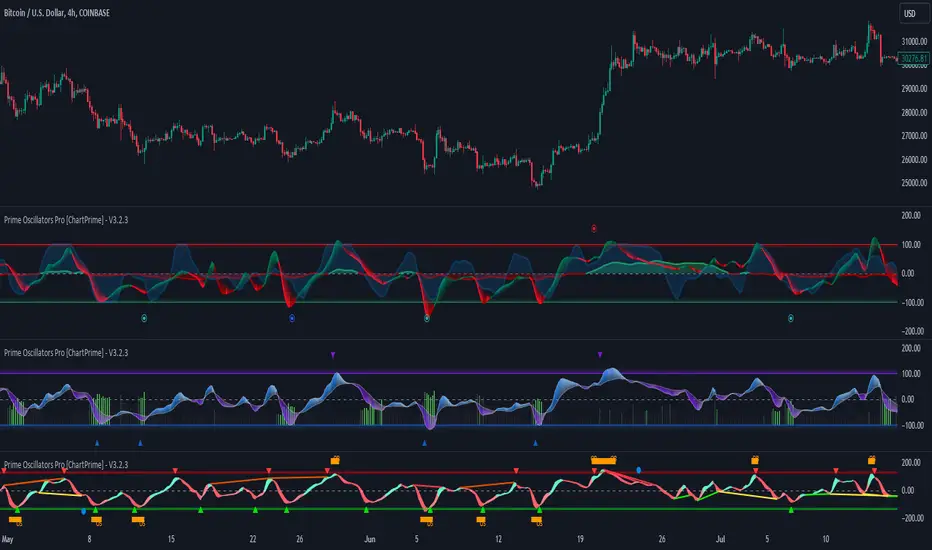
Prime Oscillators Pro [ChartPrime]The Prime Oscillators Pro suite provides two unique oscillators that provide useful insights on divergences, overbought and over sold conditions, momentum reversals, confluence alerts, amongst a myriad of other features.
The Trend Fusion Oscillator
This oscillator uses an amalgamation of price and volume to give market participants useful insight into possible future price action. It is designed in the format of a classical oscillator to be recogniseable and have a easy learning curve.
The main features of the Trend Fusion Oscillator:
Trend mode: The price volume oscillator uses an adaptive calculation to signify when price is entering a downtrend or and uptrend. When the price volume oscillator intersects with the adaptive plot the color of the price volume band will change to signify an uptrend or a down trend. This is easy to interpret with red signifying a down trend and green signifying an uptrend.
Oversold or overbought conditions: A reasonable range calculation was implemented and normalized in order to extrapolate areas of overbought an oversold conditions.
Divergences: When the price volume oscillator ribbon peaks and valleys are diverging with price action a thin line will connect the two diverging peaks or vallyes to indicate to market participants that there is a higher probability of a reversal. Divergences can be used in a classical fashion for trading.
Areas of reversal: These signals incorporate an algorithm that takes the median length of the assets trends, average true range, price deviation, volatility, and gap conditions, to signal areas with high a probability of reversal.
Main Settings
Oscillator Mode: Select the desired type of oscillator via this dropdown
Bands On/Off: Display deviation bands on the oscillators
Bearish Divergences On/Off: Allow for toggling of bearish divergences
Hidden Bearish Divergences On/Off: Allow for toggling of hidden bearish divergences
Bullish Divergences On/Off: Allow for toggling of bullish divergences
Hidden Bullish Divergences On/Off: Allow for toggling of bullish divergences
Max disatance between points: Input to adjust the distances between divergences in terms of candles
Use cases
The Trend Fusion Oscillator can be used in a simple fashion using the red/green waves to idenfity market direction. Using the waves of the market, a trader can filter other indicators and build confluence. This can also apply to contrarian logic. Divergences and oversold/bought levels can be used in confluence with other factors such as classical SR or other user selected indicators.
The Prime oscillator
Reversal signals: These are in essence a contrarian signal predicting the reversal of the market and the oscillator.
The peak seekers are blue dots that analyse multiple indicators to deduce more accurate and confluence within divergences. Settings here are auto optimised depending on the user selected timeframe.
The momentum ribbon analyses market volatility and produces an actionable ribbon on which other calculations are deduced. When it twists it can indicate a shift in the trend.
Divergences are calculated so the indicator can catch the maxmimum number of divergences in order to avoid possible reversals being missed by the trader.
Risk Disclaimer
All content and developments created by ChartPrime are purely for informational & educational purposes only. Past performance does not guarantee future results.
Skrip berbayar
Volume-Weighted RSI with Adaptive SmoothingThis indicator is designed to provide traders with insights into the relative strength of a security by incorporating volume-weighted elements, effectively combining the concepts of Relative Strength Index (RSI) and volume-weighted averages to generate meaningful trading signals.
The indicator calculates the traditional RSI, which measures the speed and change of price movements, as well as the volume-weighted RSI, which considers the influence of trading volume on price action. It then applies adaptive smoothing to the volume-weighted RSI, allowing for customization of the smoothing process. The resulting smoothed volume-weighted RSI is plotted alongside the original RSI, providing traders with a comprehensive view of the price strength dynamics.
The line coloration in this indicator is designed to provide visual cues about the relationship between the RSI and the volume-weighted RSI. When the RSI line is above or equal to the volume-weighted RSI line, it suggests a potentially bullish condition with positive market momentum. In such cases, the line is colored lime. Conversely, when the RSI line (fuchsia) is below the volume-weighted RSI line, it indicates a potentially bearish condition with negative market momentum. The line color is set to fuchsia. By observing the line color, traders can quickly assess the relative strength between the RSI and the volume-weighted RSI, aiding their decision-making process.
The bar color and background color further enhance the visual interpretation of the indicator. The bar color reflects the RSI's relationship with the volume-weighted RSI and the predefined thresholds. If the RSI line is above both the volume-weighted RSI line and the overbought threshold (70), the bar color is set to lime, indicating a potentially overbought condition. Conversely, if the RSI line is below both the volume-weighted RSI line and the oversold threshold (30), the bar color is set to fuchsia, suggesting a potentially oversold condition. When the RSI line is between these two thresholds, the bar color is set to yellow, indicating a neutral or intermediate state. The background color, displayed with a semi-transparent shade, provides additional context by reflecting the prevailing market conditions. It turns lime if the volume-weighted RSI is above the overbought threshold, fuchsia if below the oversold threshold, and yellow if it falls between these two thresholds. This coloration scheme aids traders in quickly assessing market conditions and potential trading opportunities.
Calculations:
-- RSI Calculation : The traditional RSI is calculated based on the price movements of the asset. The up and down movements are determined, and exponential moving averages are used to smooth the values. The RSI value ranges from 0 to 100, with levels above 70 indicating overbought conditions and levels below 30 indicating oversold conditions.
-- Volume-Weighted RSI Calculation : The volume-weighted RSI incorporates the trading volume of the asset into the calculations. The closing price is multiplied by the corresponding volume, and the average is taken over a specific length. The up and down movements are smoothed using exponential moving averages to generate the volume-weighted RSI value.
-- Adaptive Smoothing : The indicator offers an adaptive smoothing option, allowing traders to customize the smoothing process of the volume-weighted RSI. By adjusting the smoothing length, traders can fine-tune the responsiveness of the indicator to changes in market conditions. Smoothing helps reduce noise and enhances the clarity of the signals.
Interpretation:
The indicator provides two main components for interpretation:
-- RSI : The traditional RSI reflects the price momentum and potential overbought or oversold conditions. Traders can look for RSI values above 70 as potential overbought signals, suggesting a possible price reversal or correction. Conversely, RSI values below 30 indicate potential oversold signals, indicating a potential price rebound or rally.
-- Volume-Weighted RSI : The volume-weighted RSI incorporates trading volume, which provides insights into the strength of price movements. When the volume-weighted RSI is above the traditional RSI, it suggests that the buying pressure supported by higher volume is stronger, potentially indicating a more reliable trend. Conversely, when the volume-weighted RSI is below the traditional RSI, it suggests that the selling pressure supported by higher volume is stronger, potentially indicating a more significant price reversal.
Potential Strategies:
-- Overbought and Oversold Signals : Traders can utilize the RSI component of the indicator to identify overbought and oversold conditions. A potential strategy is to consider taking short positions when the RSI is above 70 and long positions when the RSI is below 30. These levels can act as dynamic support and resistance areas, indicating possible price reversals.
-- Confirmation with Volume : Traders can use the volume-weighted RSI as a confirmation tool to validate price movements. When the volume-weighted RSI is above the traditional RSI, it may provide additional confirmation for long positions, suggesting stronger buying pressure. Conversely, when the volume-weighted RSI is below the traditional RSI, it may provide confirmation for short positions, indicating stronger selling pressure.
-- Trend Reversal Strategy : Watch for the volume-weighted RSI to reach extreme levels above 70 (overbought) or below 30 (oversold). Look for a reversal signal where the RSI line (green or fuchsia) crosses below or above the volume-weighted RSI line. Enter a trade when the reversal signal occurs, and the RSI line changes color. Exit the trade when the RSI line crosses back in the opposite direction or reaches the opposite extreme level.
-- Divergence Strategy : Compare the direction of the RSI line (green or fuchsia) with the volume-weighted RSI line. A bullish divergence occurs when the RSI line makes higher lows while the volume-weighted RSI line makes lower lows. A bearish divergence occurs when the RSI line makes lower highs while the volume-weighted RSI line makes higher highs. Once a divergence is identified, wait for the RSI line to cross above or below the volume-weighted RSI line as confirmation of a potential trend reversal. Consider using additional indicators or price action analysis to time the entry more accurately. Use stop-loss orders and profit targets to manage risk and secure profits.
-- Trend Continuation Strategy : Assess the overall trend direction by observing the RSI line's position relative to the volume-weighted RSI line. When the RSI line consistently stays above the volume-weighted RSI line, it indicates a bullish trend, while the opposite suggests a bearish trend. Look for temporary pullbacks within the ongoing trend where the RSI line (green or fuchsia) touches or crosses the volume-weighted RSI line. Enter trades in the direction of the dominant trend when the RSI line crosses back in the trend direction. Exit the trade when the RSI line starts to deviate significantly from the volume-weighted RSI line or when the trend shows signs of weakening through other technical or fundamental factors.
Limitations:
-- False Signals : Like any indicator, the "Volume-Weighted RSI with Adaptive Smoothing" may produce false signals, especially during periods of low liquidity or choppy market conditions. Traders should exercise caution and consider using additional confirmation indicators or tools to validate the signals generated by this indicator.
-- Lagging Nature : The indicator relies on historical price data and volume to calculate the RSI and volume-weighted RSI. As a result, the signals provided may have a certain degree of lag compared to real-time price action. Traders should be aware of this inherent lag and consider combining the indicator with other timely indicators to enhance the accuracy of their trading decisions.
-- Parameter Sensitivity : The indicator's effectiveness can be influenced by the choice of parameters, such as the length of the RSI, smoothing length, and adaptive smoothing option. Different market conditions may require adjustments to these parameters to optimize performance. Traders are encouraged to conduct thorough testing and analysis to determine the most suitable parameter values for their specific trading strategies and preferences.
-- Market Conditions : The indicator's performance may vary depending on the prevailing market conditions. It is essential to understand that no indicator can guarantee accurate predictions or consistently profitable trades. Traders should consider the broader market context, fundamental factors, and other technical indicators to complement the insights provided by the "Volume-Weighted RSI with Adaptive Smoothing" indicator.
-- Subjectivity : Interpretation of the indicator's signals involves subjective judgment. Traders may have varying interpretations of overbought and oversold levels, as well as the significance of the volume-weighted RSI in relation to the traditional RSI. It is crucial to combine the indicator with personal analysis and trading experience to make informed trading decisions.
Remember, no single indicator can provide foolproof trading signals. The "Volume-Weighted RSI with Adaptive Smoothing" indicator serves as a valuable tool for analyzing price strength and volume dynamics. It can assist traders in identifying potential entry and exit points, validating trends, and managing risk. However, it should be used as part of a comprehensive trading strategy that considers multiple factors and indicators to increase the likelihood of successful trades.

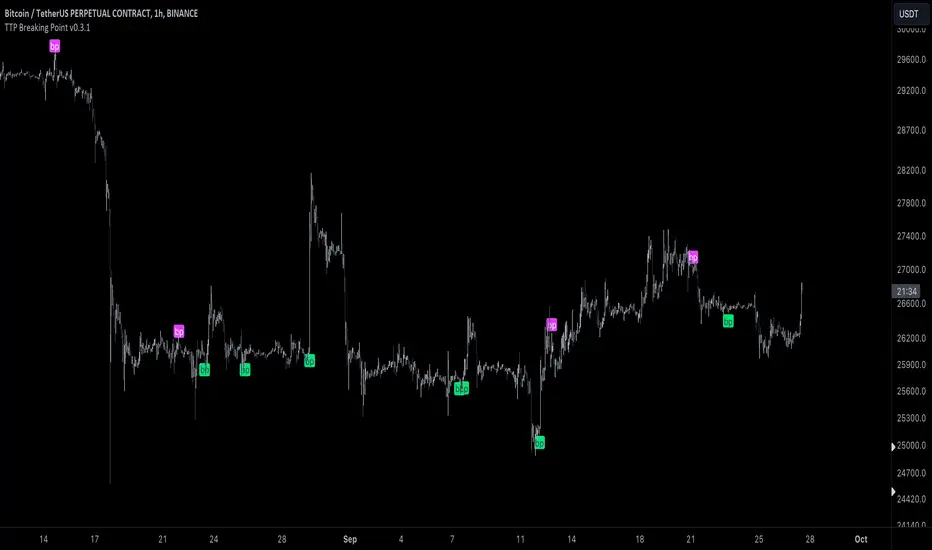
TTP Breaking PointThis signal uses information from BITFINEX:BTCUSDLONGS and BITFINEX:BTCUSDSHORTS to forecast tops and bottoms.
The idea behind is very simple.
We calculate the RSI of the ratio of longs vs shorts and find areas where both the SMA of this RSI and the RSI itself are overextended.
You might notice that the win rate is not high but most of the wins provide a decent move that, if combined with proper risk management, can be used to build profitable strategies.
The signal offers a backtesting stream: 1 for buy and 2 for sell.
Shortly I'll be adding new features including: alerts, support for other symbols, filters, etc.
AlphaTrend - ScreenerScreener version of AlphaTrend indicator:
BUY / LONG when AlphaTrend line crosses above its 2 bars offsetted line, and there would be a green filling between them
SELL / SHORT when AlphaTrend line crosses below its 2 bars offsetted line, and filling would be red then.
Default values:
Coefficient: 1, which is the factor of the trailing ATR value
Common Period: 14, which is the length of ATR MFI and RSI
AlphaTrend default uses MFI in the calculation, and MFI (Money Flow Index) needs the volume data of the chart.
If your chart doesn't have the volume data, please select the "Change Calculation" option to use RSI instead of MFI.
Screener Panel:
You can explore 20 different and user-defined tickers, which can be changed from the SETTINGS (shares, crypto, commodities...) on this screener version.
The screener panel shows up right after the bars on the right side of the chart.
Tickers seen in green are the ones that are in an uptrend, according to AlphaTrend.
The ones that appear in red are those in the SELL signal, in a downtrend.
The numbers in front of each Ticker indicate how many bars passed after the last BUY or SELL signal of AlphaTrend.
For example, according to the indicator, when BTCUSDT appears in (3) and in GREEN, Bitcoin switched to BUY signal 3 bars ago.

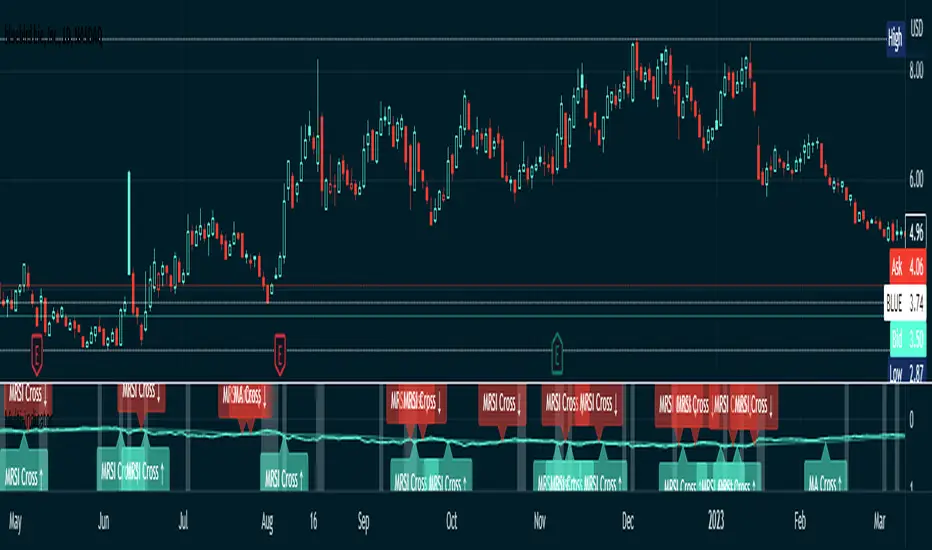
Multi-indicator by TonyMontanovThe indicator was made at the request of the subscriber of the "The trader sometimes answers"
The indicator displays:
1. Anomalous spikes in volume (i.e. the value of the volume is greater than the moving average of the volume plus a few standard deviations
2. Crossing moving averages
3. Crossing the MRSI zero line
The user can change the settings:
1. Types of moving average
2. Length sliding average
3. Number of volume standard deviations
4. Display mode
5. Index ticker
Chuff by Monty V2This is the second version of the indicator ‘Chuff by Monty’ we made a while back.
This indicator uses multiple previously available indicators as well as some newly calculated scripts to provide information on chart that uses one indicator slot but is telling you more than what one indicator could’ve.
The indicator also includes alerts which can be used to find potential signals generated by the indicator, So be sure to check those out as well.
Features of the indicator:
Ichimoku Cloud
TK Crosses: Label on chart when the Conversion Line (Tenken Sen) and Base line (Kijun Sen) is crossing each other. There are five types of crosses that are marked in the indicator. Each will have Bullish or Bearish aspect but, you have to look at the image below to really understand which is worth considering signal.
TK Lines: This checkbox will enable the Conversion and Base line, the crosses of which are labeled through the TK Crosses Checkbox above.
Bullish TK: Now when the orange line crosses the red line to the up side which should be flat at that time, this generates a bullish signal showing that this can lead price to the upwards direction. And a label print as Bullish TK in red color.
Bearish TK: Now when the orange line crosses the red line to the down side which should be flat at that time, this generates a bearish signal showing that this can lead price to the downwards direction. And a label print as Bearish TK in Golden color.
Kumo Cloud: There are two types of clouds in the indicator as well, This is calculated with a bit different approach then conventional Ichimoku Cloud indicator. Both red and green Kumo cloud acts as resistance and support respectively.
Trading Edge to Edge: This phenomenon in ichimoku suggests that when there’s a close in the cloud as 1. For longs, Green candles should close in the red cloud and at that time, The other side of the cloud should be flat and 2. For shorts, Red candles should close in the green cloud and at that time, the other side of the cloud should be flat. This opens up the window for the price to go to the other flat side of the cloud after retesting the cloud through the inside. An example is shared in the snapshot.
Divergences:
This part of the indicator uses 10 different types of oscillators including MACD, Histogram, RSI, Stochastic, CCI, Momentum, On-Balance Volume, Volume Weighted MACD, CMF, Money Flow Index and EXT to calculate divergences. By default, the indicator will show hidden and regular divergences at once, but you can choose to have just hidden or just regular divergences as per your liking. I specifically hard coded the indicator to calculate divergences from candle closes rather than from wicks, so that’s what it’s doing.
Harmonic Patterns:
I personally trade three and only three harmonics, these are bat, butterfly and Gartley. This part of indicator will analyze each swing and check if these swings are falling in any of those three harmonic pattern ranges. As we all know that these patterns don’t complete their retracement to the last digit exactly each time, so there’s a liberty range that has 10% error flexibility. Which means that if a retracement is supposed to be at 0.618, the error flexibility will check it in a range of +10% and -10% of 0.618 which comes out to be 0.556-0.678. Three of the harmonics, bullish (Green) and bearish (Red) is posted in the snapshot.
You can trade these harmonics by either waiting for the indicator to print them, either by putting an alert for each type of a harmonic pattern or by pre-predicting a harmonic which is taught in our community’s premium discord discord.gg .
Golden/Death cross:
Just like TK Crosses, this will print you Goldencross and Deathcross labels each time 55sma and 200sma cross each other. If the 55sma is crossing the 200sma to the upside, A Goldencross label will appear and if 55sma is crossing the 200sma to the downside, A Deathcross label will appear. Golden cross means the coin is turning bullish and can go high. Death cross shows that the coin is turning bearish and the price can fall.
Moving Averages:
Default lengths are 13EMA, 21EMA, 55SMA, 200SMA and 355SMA. You can change it as you like but I use these lengths for my analysis. One feature that this set of moving average has is that each MA is labeled as it’s length and the calculation method (SMA or EMA). So, when you are analyzing with multiple Moving Averages enabled, you can easily know which MA is which.
SR Band:
It has three mods. Fast/Weak which is going to be quick and sensitive to the price but will a weak support and resistance area. Slow/Strong which is going to be slow and less sensitive to the price but will be a very strong support and resistance area. The normal settings which is set as default is kind of in-between these two. You can use this SR band as a way of getting in and out of the trades as it represents Supports and resistances. The colors of the band changes when the price is above, below and is in the band.
Here’s an example trade using the confluences provided by the indicator.
This is how that trade would’ve looked like with indicator:
And this is how that trade would’ve looked like without the indicator:
Do ask questions in the comment section about the indicator or the trading strategy here if you feel like this is too complex. I’ll be glad to help.
All the settings and features which were worth customizing are customizable in this version of the indicator. Feel free to change those settings as per your liking.
Thank you.

Step RSI [Loxx]Enhanced Moving Average Calculation with Stepped Moving Average and the Advantages over Regular RSI
Technical analysis plays a crucial role in understanding and predicting market trends. One popular indicator used by traders and analysts is the Relative Strength Index (RSI). However, an enhanced approach called Stepped Moving Average, in combination with the Slow RSI function, offers several advantages over regular RSI calculations.
Stepped Moving Average and Moving Averages:
The Stepped Moving Average function serves as a crucial component in the calculation of moving averages. Moving averages smooth out price data over a specific period to identify trends and potential trading signals. By employing the Stepped Moving Average function, traders can enhance the accuracy of moving averages and make more informed decisions.
Stepped Moving Average takes two parameters: the current RSI value and a size parameter. It computes the next step in the moving average calculation by determining the upper and lower bounds of the moving average range. It accomplishes this by adjusting the values of smax and smin based on the given RSI and size.
Furthermore, Stepped Moving Average introduces the concept of a trend variable. By comparing the previous trend value with the current RSI and the previous upper and lower bounds, it updates the trend accordingly. This feature enables traders to identify potential shifts in market sentiment and make timely adjustments to their trading strategies.
Advantages over Regular RSI:
Enhanced Range Boundaries:
The inclusion of size parameters in Stepped Moving Average allows for more precise determination of the upper and lower bounds of the moving average range. This feature provides traders with a clearer understanding of the potential price levels that can influence market behavior. Consequently, it aids in setting more effective entry and exit points for trades.
Improved Trend Identification:
The trend variable in Stepped Moving Average helps traders identify changes in market trends more accurately. By considering the previous trend value and comparing it to the current RSI and previous bounds, Stepped Moving Average captures trend reversals with greater precision. This capability empowers traders to respond swiftly to market shifts and potentially capture more profitable trading opportunities.
Smoother Moving Averages:
Stepped Moving Average's ability to adjust the moving average range bounds based on trend changes and size parameters results in smoother moving averages. Regular RSI calculations may produce jagged or erratic results due to abrupt market movements. Stepped Moving Average mitigates this issue by dynamically adapting the range boundaries, thereby providing traders with more reliable and consistent moving average signals.
Complementary Functionality with Slow RSI:
Stepped Moving Average and Slow RSI function in harmony to provide a comprehensive trading analysis toolkit. While Stepped Moving Average refines the moving average calculation process, Slow RSI offers a more accurate representation of market strength. The combination of these two functions facilitates a deeper understanding of market dynamics and assists traders in making better-informed decisions.
Extras
-Alerts
-Signals

RSI Divergences on price chart - Open Source CodeHello Traders,
I have some exciting news to share with you all! Recently, I came across an incredible RSI divergences indicator developed by Socrate_FR. This indicator, in my opinion has an exceptional accuracy in detecting RSI divergences. However, during my exploration of other indicators in the TradingView library that display signals on the price chart, I found that many of them were often unreliable and missed out on important divergences.One such example is the Prices / RSI Divergences Detector by vtllr. Although vtllr did an amazing job with the indicator, I noticed that it didn't capture several relevant divergences accurately.
This observation inspired me to enhance the most accurate RSI divergences indicator available by showcasing the signals directly on the price chart. By doing so, I aimed to address the issue of unreliable and missed divergences in other price chart indicators. With this enhanced version, you can now effortlessly identify and track RSI regular divergences on the price chart itself:
-Regular bullish divergence occurs when the price forms lower lows while the RSI indicator forms higher lows. It suggests a potential bullish reversal (green line plot)
-Regular bearish divergence occurs when the price forms higher highs while the RSI indicator forms lower highs. It suggests a potential bearish reversal (red line plot)
Another key mofication:
This Indicator introduces a simpler approach compared to the original Socrate indicator. While Socrate differentiated divergences into eight types for both bullish and bearish scenarios, our enhanced version focuses on two distinct categories: small and big divergences. This decision was made to provide a clearer and more user-friendly experience. By condensing the divergence types into two groups, traders can easily identify and analyze the significance of the divergences without getting overwhelmed by excessive variations. The small divergences represent relatively minor divergences, while the big divergences indicate stronger and more significant signals.
-Small divergences represent relatively minor divergences (plotshape small circle)
-Big divergences indicate stronger signals (plotshape big circle)
I firmly believe that this enhanced RSI Divergences Indicator will be an invaluable tool for traders who rely on RSI analysis in their trading strategies. It combines the accuracy of Socrate_FR's original indicator with the enhanced visibility of signals on the price chart, ensuring you never miss any important divergences.
If you're interested in trying out this enhanced version of the indicator, please feel free to access the open-source code. If you want to visit and try the original version of the code visit Socrate_FR profile.
www.tradingview.com
Keep attention!
It is important to note that no trading indicator or strategy is foolproof, and there is always a risk of losses in trading. While this indicator may provide useful information for making conclusions, it should not be used as the sole basis for making trading decisions. Traders should always use proper risk management techniques and consider multiple factors when making trading decisions.
Support us:)
If you find this new indicator helpful in your trading analysis, I would greatly appreciate your support! Please consider to follow, giving it a like, leaving feedback, or sharing it with your trading network. Your engagement will not only help me improve this tool but will also help other traders discover it and benefit from its features. Thank you for your support!

DB Zero Lag Smoothed Tops & Bottoms RSI (No Repaint)The DB ZPS RSI indicator is a designed to detect tops and bottoms using a zero lag smoothed RSI. This indicator has been specifically designed not to repaint by default. Which means the value at the opening of the bar will not change and can be used at the start of the period to make trading choices.
The RSI line has 4 different colors:
- Red = Sell Zone
- Maroon = Bear Zone
- Aqua = Trend Changing Upward
- Lime = Bull Zone
The indicator comes with zones outlined with horizontal lines. Typically when the ZPS RSI is above 90 the top is near. Typically when the ZPS RSI is below 10 the local bottom is near. However, at times the ZPS RSI may treat the 50 as the top depending on the amount of market momentum.
Since this indicator (by default) does not repaint, this means traders can use this to make market entry or exit choices at the start of the period.
For example, trader may decide to enter a long when the ZPS RSI is below 2 and the ZPS RSI color is aqua or lime at the OPEN of the bar period. A trader may choose exit a trade when the ZPS RSI is above 95 or the ZPS RSI color is maroon at the OPEN of the bar period. No waiting. Remember it does not repaint.
For example, trader may decide to enter a short when the ZPS RSI crosses under 95 on the OPEN of the bar period. The trader may then choose to close the short when the ZPS RSI color turn aqua at the OPEN of the bar period.
For those traders who live on the wild side. You may disable the no-repaint mode in the settings (not recommended). With no repaint disabled, the ZPS RSI will be subject to change as the price changes during the current period. However, for those who are willing to take this risk, you could take the example above and then enter/exit (or short) in the current bar as the example conditions are present (not recommended).
The indicator includes a simple threshold buy/sell setting and the ability to display buy sell signals (triangles, disabled by default). Additionally, the indicator has alerts for threshold levels and the different ZPS RSI color changes.
The default ZPS RSI length in the settings is 10 but can be changed.
Hope you enjoy!
p.s. ZPS RSI stands for Zero Lag Percent Change Smoothed Sum RSI
Market Cycle IndicatorThe Market Cycle Indicator is a tool that integrates the elements of RSI, Stochastic RSI, and Donchian Channels. It is designed to detect market cycles, enabling traders to enter and exit the market at the most opportune times.
This indicator provides a unique perspective on the market, combining multiple strategies into one unified and weighted approach. By factoring in the inputs from each of these popular technical analysis methods, it offers a more holistic view of the market trends and cycles.
Parameter Details:
Donchian Channels (DCO):
- donchianPeriod: Sets the period for the Donchian Channel calculation. Default is set to 14.
- donchianSmoothing: Sets the smoothing factor for the Donchian Channel calculation. Default is set to 3.
- donchianPrice: Selects the price type to be used in the Donchian Channel calculation. Default is set to the closing price.
Relative Strength Index (RSI):
- rsiPeriod: Sets the period for the RSI calculation. Default is set to 14.
- rsiSmoothing: Sets the smoothing factor for the RSI calculation. Default is set to 3.
- rsiPrice: Selects the price type to be used in the RSI calculation. Default is set to the closing price.
Stochastic RSI (StochRSI):
- srsiPeriod: Sets the period for the Stochastic RSI calculation. Default is set to 20.
- srsiSmoothing: Sets the smoothing factor for the Stochastic RSI calculation. Default is set to 3.
- srsiK: Sets the period for the %K line in the Stochastic RSI calculation. Default is set to 5.
- srsiD: Sets the period for the %D line in the Stochastic RSI calculation. Default is set to 5.
- srsiPrice: Selects the price type to be used in the Stochastic RSI calculation. Default is set to the closing price.
Weights:
- rsiWeight: Sets the weight for the RSI in the final aggregate calculation. Default is set to 1.
- srsiWeight: Sets the weight for the Stochastic RSI in the final aggregate calculation. Default is set to 1.
- dcoWeight: Sets the weight for the Donchian Channel in the final aggregate calculation. Default is set to 1.
Limits:
- limitHigh: Sets the upper limit for the indicator. Default is set to 80.
- limitLow: Sets the lower limit for the indicator. Default is set to 20.
By customizing these parameters, users can tweak the indicator to align with their own trading strategies and risk tolerance levels. Whether you're a novice or an experienced trader, the Comprehensive Market Cycle Indicator provides valuable insights into the market's behavior.
Uses library HelperTA

Broadview Underpriced & OverpricedIntroducing the groundbreaking Broadview Underpriced & Overpriced indicator—a convergence of science, technology, and mathematical finance. This cutting-edge development takes the highly acclaimed Overbought & Oversold Heatmap and elevates it to an entirely new level by infusing it with price trends through the application of special moving averages. The result is a revolutionary approach to asset classification, allowing traders, investors, and institutions to categorize assets into four distinct categories: Underpriced, Overpriced, Discounted, and Inflated.
The Broadview Underpriced & Overpriced indicator combines the power of the Overbought & Oversold Heatmap with a sophisticated methodology that leverages special moving averages. These unique moving averages enhance the precision and accuracy of the asset classification process, providing traders with unparalleled insights into market conditions.
Under the Broadview Underpriced & Overpriced framework, assets that are deemed oversold and positioned below the special moving average are identified as Underpriced. This designation implies that the asset's current price is undervalued relative to its intrinsic worth, presenting an opportune moment to consider initiating a buying position. Underpriced assets are represented by a vibrant purple color on the indicator, symbolizing the potential for significant buying opportunities.
Conversely, assets that are considered overbought and situated above the special moving average are labeled as Overpriced. This classification indicates that the asset's current price has exceeded its intrinsic value, suggesting a favorable moment to contemplate selling or reducing exposure to the asset. Overpriced assets are visually depicted by a striking teal color, signifying the potential for optimal selling opportunities.
Moreover, the Broadview Underpriced & Overpriced indicator recognizes a third category known as Discounted assets. These assets are characterized by being positioned above the special moving average while simultaneously experiencing oversold conditions. This classification suggests that although the asset's price may be above its average value, it is currently available at a discounted price relative to its long-term potential. Discounted assets are represented by a deep purple hue, indicating an opportunity for buyers to consider making purchases with a lower aggression dollar-cost averaging (DCA) strategy.
Lastly, the indicator identifies Inflated assets as those positioned below the special moving average while concurrently exhibiting overbought conditions. This classification implies that the asset's price may be temporarily inflated compared to its intrinsic worth. Inflated assets are depicted by a rich teal color, representing an indication for trend traders or those looking to capitalize on consolidations.
The Broadview Underpriced & Overpriced indicator brings forth a groundbreaking evolution in asset classification, meticulously combining the Overbought & Oversold Heatmap with the influence of special moving averages. Through this unique fusion, traders and investors gain access to an unprecedented level of insight, enabling them to make informed decisions based on a comprehensive evaluation of market trends.
The Broadview Underpriced & Overpriced indicator represents a paradigm shift in asset classification, uniting science, technology, and mathematical finance to deliver an innovative and comprehensive trading tool. By leveraging special moving averages in conjunction with the Overbought & Oversold Heatmap, this indicator enables traders, investors, and institutions to categorize assets as Underpriced, Overpriced, Discounted, or Inflated. Its visually captivating color scheme and strategic insights empower market participants to navigate market trends with precision, enhancing their ability to capitalize on optimal buying and selling opportunities while employing various trading strategies.
