RenkoNow you can plot a "Renko" chart on any timeframe for free! As with my previous algorithm, you can plot the "Linear Break" chart on any timeframe for free!
I again decided to help TradingView programmers and wrote code that converts a standard candles / bars to a "Renko" chart. The built-in renko() and security() functions for constructing a "Renko" chart are working wrong. Do not try to write strategies based on the built-in renko() function! The developers write in the manual: "Please note that you cannot plot Renko bricks from Pine script exactly as they look. You can only get a series of numbers similar to OHLC values for Renko bars and use them in your algorithms". However, it is possible to build a "Renko" chart exactly like the "Renko" chart built into TradingView. Personally, I had enough Pine Script functionality.
For a complete understanding of how such a chart is built, you can read to Steve Nison's book "BEYOND JAPANESE CANDLES" and see the instructions for creating a "Renko" chart:
Rule 1: one white brick (or series) is built when the price rises above the base price by a fixed threshold value or more.
Rule 2: one black brick (or series) is built when the price falls below the base price by a fixed threshold or more.
Rule 3: if the rise or fall of the price is less than the minimum fixed value, then new bricks are not drawn.
Rule 4: if today's closing price is higher than the maximum of the last brick (white or black) by a threshold or more, move to the column to the right and build one or more white bricks of equal height. A new brick begins with the maximum of the previous brick.
Rule 5: if today's closing price is below the minimum of the last brick (white or black) by a threshold or more, move to the column to the right and build one or more black bricks of equal height. A new brick begins with the minimum of the previous brick.
Rule 6: if the price is below the maximum or above the minimum, then new bricks are not drawn on the chart.
So my algorithm can to plot Traditional Renko with a fixed box size. I want to note that such a "Renko" chart is slightly different from the "Renko" chart built into TradingView, because as a base price I use (by default) close of first candle. How the developers of TradingView calculate the base price I don’t know. Personally, I do as written in the book of Steve Neeson.
The algorithm is very complicated and I do not want to explain it in detail. I will explain very briefly. The first part of the get_renko () function — // creating lists — creates two lists that record how many green bricks should be and how many red bricks. The second part of the get_renko () function — // creating open and close series — creates open and close series to plot bricks. So, this is a white box - study it!
As you understand, one green candle can create a condition under which it will be necessary to plot, for example, 10 green bricks. So the smaller the box size you make, the smaller the portion of the chart you will see.
I stuffed all the logic into a wrapper in the form of the get_renko() function, which returns a tuple of OHLC values. And these series with the help of the plotcandle() annotation can be converted to the "Renko" chart. I also want to note that with a large number of candles on the chart, outrages about the buffer size uncertainty are heard from the TradingView blackbox. Because of it, in the annotation study() set the value of the max_bars_back parameter.
In general, use this script (for example, to write strategies)!
Renkochart

Brick IndicatorBrick Indicator :-
A wonderful book written by "Prashant Shah" named "The profitable trading with renko chart" has been mentioned many technical indicator in this book. But today we are going to tell about an indicator who does a lot of amazing work inside the Renko chart. The Indicator name is "Brick Indicator" works on very simple calculations. Inside it, it is seen how much Brick Bullish was and how Brick was Bearish. Which shows whether the trend is upwards or downwards. At the same time, inside it we use the line of EMA. So that we can catch the trend quickly.
Brick Line Formula: - Numbers of periods bullish candles - Numbers of periods bearish candles
With this line, we put the line of EMA, so that the signals of the market get even better.

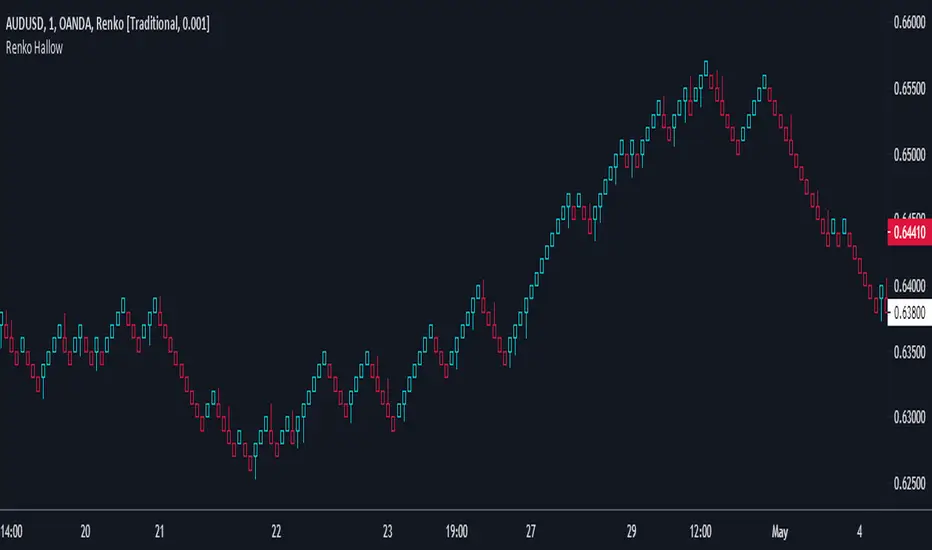
Renko HallowPersonal style, I prefer my candlestick to be hallow, so I design one for Renko Chart since TV does not has it on preset. To use this indicator, u have to open a Renko chart and hide the actual Renko chart.
Renko Weis Wave VolumeThis is live and non-repainting Renko Weis Wave Volume tool. The tool has it’s own engine and not using integrated function of Trading View.
Renko charts ignore time and focus solely on price changes that meet a minimum requirement. Time is not a factor on Renko chart but as you can see with this script Renko RSI created on time chart.
Renko chart provide several advantages, some of them are filtering insignificant price movements and noise, focusing on important price movements and making support/resistance levels much easier to identify.
As source Closing price or High/Low can be used.
Traditional or ATR can be used for scaling. If ATR is chosen then there is rounding algorithm according to mintick value of the security. For example if mintick value is 0.001 and brick size (ATR/Percentage) is 0.00124 then box size becomes 0.001. And also while using dynamic brick size (ATR), box size changes only when Renko closing price changed.
This tool is based on the Weis Wave described by David H. Weis (a Wyckoff specialist). The Weis Waves Indicator sums up volumes in each wave. This is how we receive a bar chart of cumulative volumes of alternating waves and The cumulative volume makes the Weis wave charts unique.
If there is no volume information for the security then this tool has an option to use “True Range” instead of volume .
Better to use this script with the following one:
Enjoy!

Renko RSIThis is live and non-repainting Renko RSI tool. The tool has it’s own engine and not using integrated function of Trading View.
Renko charts ignore time and focus solely on price changes that meet a minimum requirement. Time is not a factor on Renko chart but as you can see with this script Renko RSI created on time chart.
Renko chart provide several advantages, some of them are filtering insignificant price movements and noise, focusing on important price movements and making support/resistance levels much easier to identify.
As source Closing price or High/Low can be used.
Traditional or ATR can be used for scaling. If ATR is chosen then there is rounding algorithm according to mintick value of the security. For example if mintick value is 0.001 and brick size (ATR/Percentage) is 0.00124 then box size becomes 0.001. And also while using dynamic brick size (ATR), box size changes only when Renko closing price changed.
Renko RSI is calculated by own Renko RSI algorithm.
Alerts added:
Renko RSI moved below Overbought level
Renko RSI moved above Overbought level
Renko RSI moved below Oversold level
Renko RSI moved above Oversold level
RSI length is 2 by default, you can set as you wish.
You better to use this script with the following one:
Enjoy!

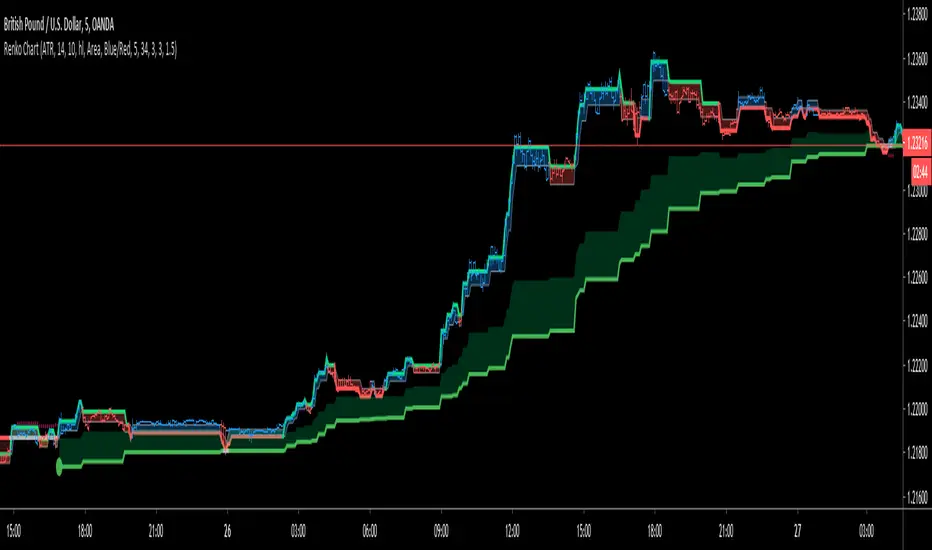
Renko ChartHello All. This is live and non-repainting Renko Charting tool. The tool has it’s own engine and not using integrated function of Trading View.
Renko charts ignore time and focus solely on price changes that meet a minimum requirement. Time is not a factor on Renko chart but as you can see with this script Renko chart created on time chart.
Renko chart provide several advantages, some of them are filtering insignificant price movements and noise, focusing on important price movements and making support/resistance levels much easier to identify.
in the script Renko Trend Line with threshold area is included. and also there is protection from whipsaws, so you can catch big waves with very good entry points. Trend line is calculated by EMA of Renko closing price.
As source Closing price or High/Low can be used. Traditional or ATR can be used for scaling. If ATR is chosen then there is rounding algorithm according to mintick value of the security. For example if mintick value is 0.001 and brick size (ATR/Percentage) is 0.00124 then box size becomes 0.001. And also while using dynamic brick size (ATR), box size changes only when Renko closing price changed.
Renko bar can be seen as area or candle and also optionally bar color changes when Renko trend changed.
Soon other Renko scripts (Renko RSI, Renko Weis Wave, Renko MACD etc) are coming ;)
ENJOY!
Renko Chart Alerts with PivotsAdd alerts to renko charts to be notified when:
new brick
brick up
brick down
direction change
direction change up
direction change down
Also shows pivots based on brick reversals. Alerts also available for:
pivot breakout
pivot high breakout
pivot low breakout
You can hide the plots for pivot high/low and breakouts in the style tab of the settings for the indicator.
To add the alerts:
add the indicator to your renko chart
click add alert
click the condition dropdown and choose Renko Alerts
you should see all the alerts there and you can add any one or more to your chart

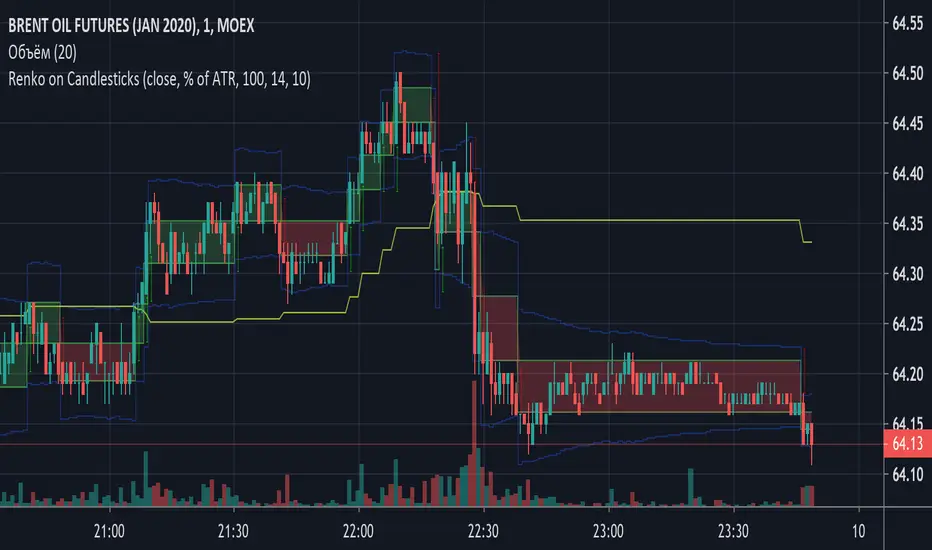
Renko on CandlesticksThis script drowse renkoboxes on top of candlesticks. This script does not repaint and can be used for alerts generation. If you add Renko to the same chart using security function it won't be the same (which seems to be a bug in TV). To check if my implementation is correct you can open Renko in a separate window and check timestamps.
Unlike standard implementation, when you use ATR based Renko bars, every box can have different size! The current ATR is applied after every bar. The standard implementation takes the current ATR value and applies it to the whole chart, so the chart may look totally different when you reload the page.
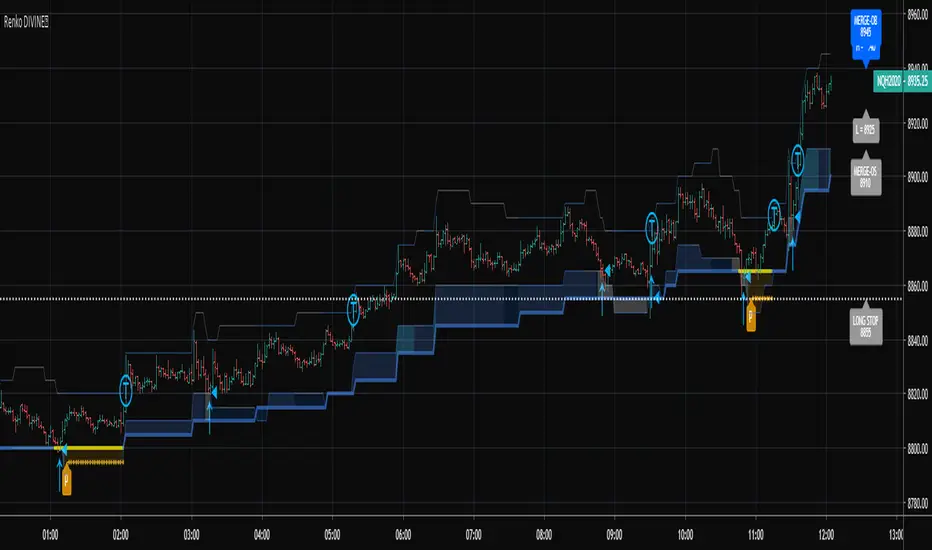
Renko Dynamic Index ZonesThe goal of this indicator is to plot the Dynamic Index, Signal, and Histogram values "as if" the chart is a true price action based Renko chart. It can be used on a time series chart or Renko series chart. The Dynamic Index is derived from the raw price action of a time-based chart, where the historic and live price values are clustered into Renko bricks. The Renko brick production algorithm is entirely backed by Renko Overlay Ribbon and thoroughly tested. The Dynamic Index gets its inspiration from the Commodity Channel Index.
The algorithm takes into account rapid brick production within a single time candle and adjusts accordingly. The output may vary slightly between different chart time frames for the same indicator settings, but this is due to the lack of price fluctuation visibility that can occur in higher chart time frames. If the brick tick size is low, an appropriate chart interval should be selected that maximizes the amount of price volatility visible to the indicator. A bad setting would be something like a 1 tick EURUSD Renko setting on an H4 or Day chart, there simply is no way to derive the exact and ordered price fluctuations in a single candle, 1 pip at a time. A more appropriate chart time frame would be 1-5 minutes for this selected Renko brick size.
The difference between this indicator and the companion Renko Dynamic Index oscillator can be understood in the following video. The indicator plots the current Dynamic Index - Signal cross and Dynamic Index - Zero cross thresholds on the chart so that you know exactly where the most important crossing values are at all times. These can be used as a dynamic stop or a dynamic entry location for trades. The overbought and oversold dynamic zones are also plotted on the chart.
If you are interested in the RSI-RENKO DIVINE™ Strategy please have a look here:
Contact me in Trading View or telegram for more information and access instructions.

Swing Wave Helper by 2tmHello Everyone.
I'd inspired from Renko Chart and make to find Waves.
As you know guys, the candle make Waves and the node of Waves make 3 Points.
With those 3 Points we can find where these candle go. Up? or Down.
With This script you can find easily those 3 Points easily.
Thank you and have a nice day.

Fractal Framer added buy sellThis script was written by Brobear and published. I only modified by adding buy and sell signal when price crossover fractal channel.
buy_breakout=crossover(close,fracLevelHigh) and OsMA >OsMA and emaRSI >emaRSI
sell_breakout=crossunder(close,fracLevelLow) and OsMA
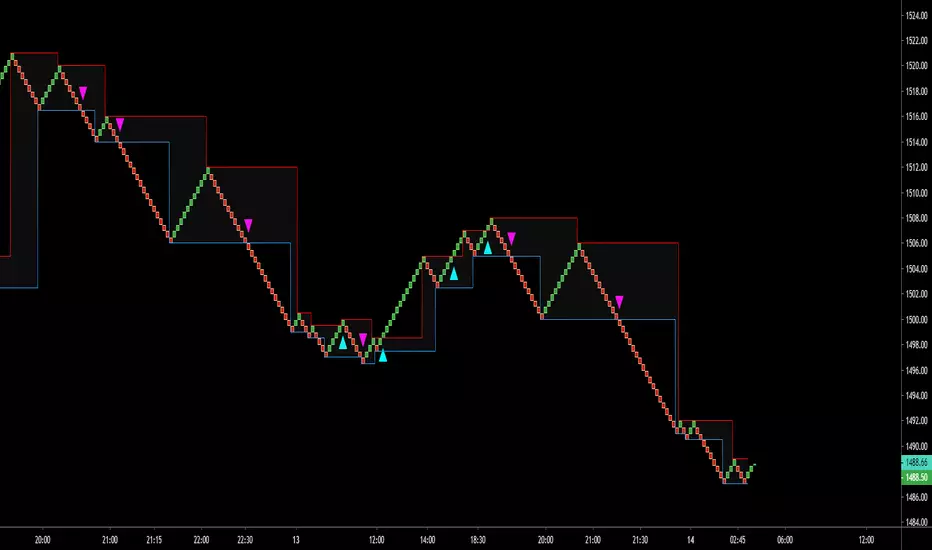
Use On Renko Chart - Cheap Entry Signals HI BIG PLAYERS,
in according of an enquiry from an user of tradingview I coded this script for free.
This script allows to identify a trend on the basis of higher high & higher low and lower high & lower low. And only after this fulfill conditions the entry signal comes out. The enquiry relates to Renko-charts, this is why it was build more usable on Renko-Charts.
In addition, it is possible to choise yourself the view of highest/lowest peaks and signals in the options.
Please give me a like to this indicator and of course: you are invited to follow me or visit my other scripts in relation to Wolfe Wave and Elliott Wave.
King regards
NXT2017

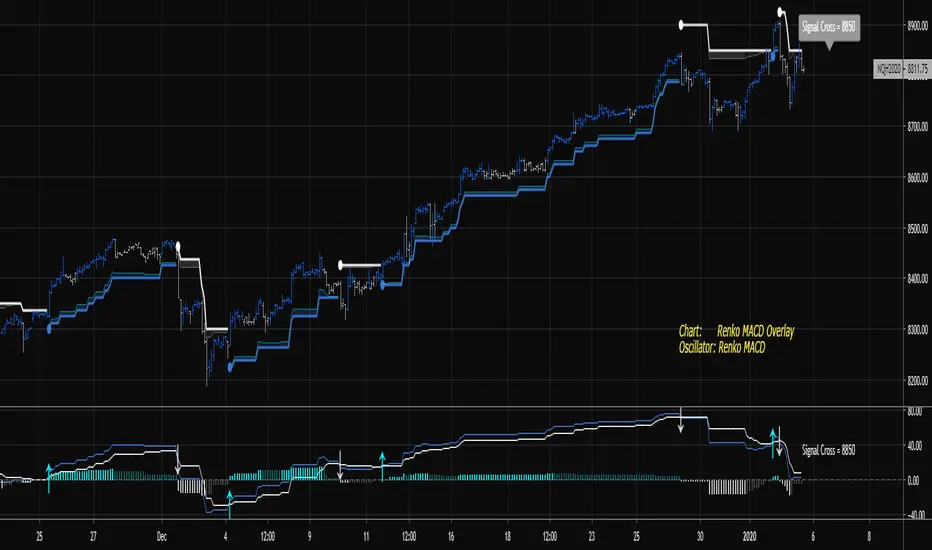
Renko MACD TrendThe goal of this indicator is to plot the MACD, Signal, and Histogram values "as if" the chart is a true price action based Renko chart. It can be used on a time series chart or Renko series chart. The MACD is derived from the raw price action of a time-based chart, where the historic and live price is clustered into Renko bricks. The Renko brick production algorithm is entirely backed by Renko Overlay Ribbon and thoroughly tested.
The algorithm takes into account rapid brick production within a single time candle and adjusts accordingly. The output may vary slightly between different chart time frames for the same indicator settings, but this is due to the lack of price fluctuation visibility that can occur in higher chart time frames. If the brick tick size is low, an appropriate chart interval should be selected that maximizes the amount of price volatility visible to the indicator. A bad setting would be something like a 1 tick EURUSD Renko setting on an H4 or Day chart, there simply is no way to derive the exact and ordered price fluctuations in a single candle, 1 pip at a time. A more appropriate chart time frame would be 1-5 minutes for this selected Renko brick size.
The difference between this indicator and the companion Renko MACD indicator can be understood in the following video. The indicator plots the current MACD - Signal cross and MACD - Zero cross thresholds on the chart so that you know exactly where the most important crossing values are at all times. This can be used as a dynamic stop or a dynamic entry location for trades.
If you are interested in the RSI-RENKO DIVINE Strategy please have a look here:
Contact me in Trading View or telegram for more information and access instructions.
Telegram: t.me
Daily Edge: www.daily-edge.com
Renko MACDThe goal of this indicator is to plot the MACD, Signal, and Histogram values "as if" the chart is a true price action based Renko chart. It can be used on a time series chart or Renko series chart. The MACD is derived from the raw price action of a time-based chart, where the historic and live price is clustered into Renko bricks. The Renko brick production algorithm is entirely backed by Renko Overlay Ribbon and thoroughly tested.
The algorithm takes into account rapid brick production within a single time candle and adjusts accordingly. The output may vary slightly between different chart time frames for the same indicator settings, but this is due to the lack of price fluctuation visibility that can occur in higher chart time frames. If the brick tick size is low, an appropriate chart interval should be selected that maximizes the amount of price volatility visible to the indicator. A bad setting would be something like a 1 tick EURUSD Renko setting on an H4 or Day chart, there simply is no way to derive the exact and ordered price fluctuations in a single candle, 1 pip at a time. A more appropriate chart time frame would be 1-5 minutes for this selected Renko brick size.
Please find the following video introduction helpful for this indicator and the Renko MACD Trend indicator:
If you are interested in the RSI-RENKO DIVINE Strategy please have a look here:
Contact me in Trading View or telegram for more information and access instructions.
Telegram: t.me
Daily Edge: www.daily-edge.com

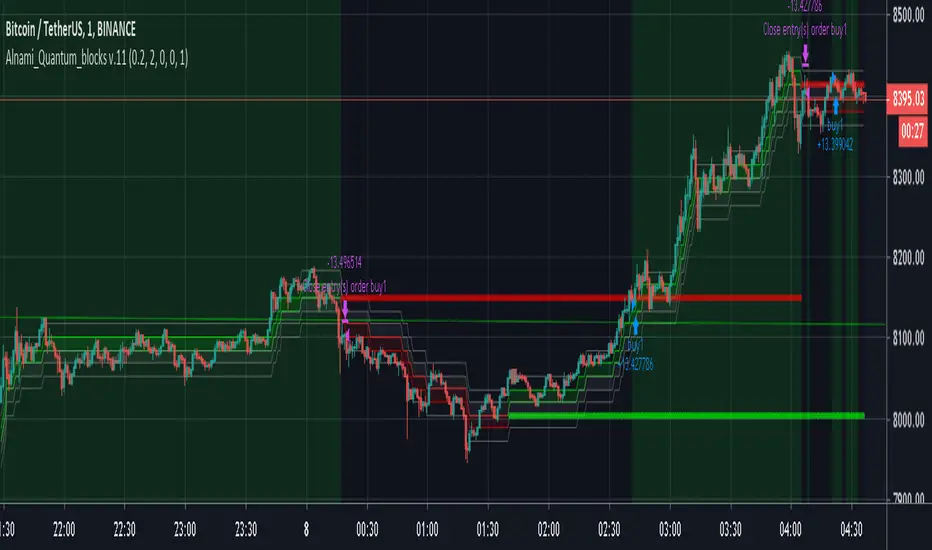
Alnami_Quantum_blocks v.11The (Al Nami Quantum Blocks v.11) script is based on Renko chart that is based on % move of the selected symbol. This is different from the traditional or ATR based Renko charts..
box size = user selected percentage x current price
Alnami Quantum Blocks Channel is composed of 5 levels that are calculated based on the box size:
1- Base
2- Green Box High (GBH) = Base + box size
3- Next Green Box trigger (GBN) = base + (box size x 2)
4- Red Box Low ( RBL ) = Base - box size
5- Next Red Box trigger ( RBN ) = base - (box size x 2)
Those levels will appear in the chart with the following order:
------GBN-------
------GBH-------
------BASE------
------RBL-------
------RBN-------
Usually when prices are trending up, the price will stay above the base for most of the time,, when it trending downwards, price stays below base most of the time..
Now how to time your entries based on the channel?
This strategy draws two levels, breakout level (top red line) and stop level (bottom green line).
If the price is above red line, place a buy order
If the price is below the green line, place a sell order
In version 11 of the Quantum blocks, you can choose to make the those two lines drawn using:
recent/near term price actions (less accurate) and fast - set the number of Legs to low value
or
wider term price actions (more accurate) and slow - set the number of Legs to high value
This version also tracks the last three changes for the red and green lines as following:
1- Above, Above, Above = 3
2- Above, Above, Below = 2
3- Above, Below, Below = 1
4- Below, Below, Below = 0
I did run full optimization for the settings of this strategy on Bitcoin (Binance:BTCUSDT) for the following multiple time frames using Amibroker scrips and data downloaded from Binance through a REST API call. The TFs were for 1min, 15min, 30min, 45min, 90min, 120min, 180min, and 240min.
pair Input Settings
btc TF Profit% Sys DD% Trade DD% sharpe% # Trades Win% Wave% # of Legs up lo
1 204 40.16 15.04 1.33 132 40.15 1.5 4 3 3
15 249 35 14.3 2.96 35 51.43 1.8 3 1 3
30 469 28.95 14.04 3.82 34 67.65 1.4 3 1 3
45 712 54.48 23.3 2.49 46 54.35 1.7 3 3 3
90 1114 40.51 21.41 3.3 48 54.17 1.4 2 3 3
120 602 25.32 16.8 2.82 51 43.14 1.2 2 3 3
180 960 35.9 20.09 3.33 42 52.38 0.9 2 2 3
240 819 46.84 28.27 3.48 46 65.22 0.6 2 3 3
I spent a lot of time and resource in providing the above, If this script/back tests helped in making some profits, then kindly express your appreciation and support to this work by sending some altcoins to any of the following wallets, this will encourage me sharing more stuff with the public:
BTC : 15VLCLZRkEhhZn6E4gNjMLVYnmCcUzKvWU
LTC : LN6mE6aZhEqVVfssmaQ3kk8PPspWQ5wToy
ETH : 0x7901035f2b6f334fa404d0ceb187d7bfcfdb72ce
[RESEARCH] Renko Chart IdentifierDespite I am not a big fan of Renko I spent some time to solve a common problem of chart type identification using absolutely obvious technique: Renko bricks have the same size. That's all. Not a cutting-edge maths.
This tool allows to identify:
ATR Renko charts (see ^)
Traditional Renko charts
Here is example for Traditional Renko:
It also works correctly with other chart types:
Classic Candles
Heikin-Ashi
Kagi
PnF
Range Bars
Remember @everget !
And pay attention to the license before use)

Renko Overlay RibbonThis script has been moved to protected from this location
due to mishandling on multiple trading platforms. Since I have proprietary strategies built on this code, it has caused me to make it protected. This is not an Invite Only script anyone can use it, however the source code is no longer visible.
All calculations are performed against calculated Renko bricks form a price chart. The engine that drives this script is complex, but robust. It attempts to garner the order of nested Renko bricks inside a time candle when multiple bricks are produced. I call these "volatile bricks". In a normal Renko chart where tick data is used, this would be displayed as rapid brick production on the screen.
It is important to choose an appropriate time frame when in Traditional mode. Setting the ribbon to 1 pip on EURUSD using a Day chart is not wise, because there is no way to know just how many 1 pip bricks were produced and in which up/down sequence. ATR mode is different because the bricks are constantly changing in size, adapting to the current ATR of the chart time interval.
Please view these old videos taken from the original page for questions on why this indicator was created in the first place:
My strategy built on this indicator can be found here:
Multiple indicators based on renko bricks on time charts can be found here (they also work on renko charts in Trading View). These are special scripts that use this indicator as the engine to generate indicators "as if" you were operating on a Renko chart.
PM for questions, enjoy.

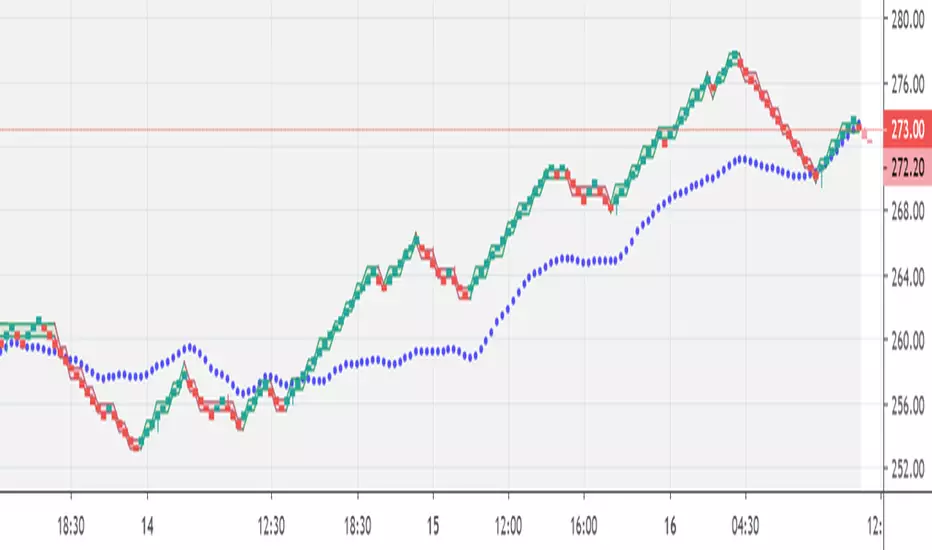
[ssabu] Renko Chart✅ Renko Chart Indicator
실시간으로 캔들 차트를 렌코차트로 바꿔서 배경에 렌코차트를 자동으로 그려주는 인디케이터 입니다.
It is an indicator that automatically draws a Renko chart in the background by changing the candle chart to a Renko chart in real time.
위의 사진은 캔들차트를 렌코로 바꾸고 해당 인디케이터를 적용한 스크린샷
Above picture is a screenshot of changing the candle chart to Renko and applying the indicator

Renko Weis Wave VolumeA volume bulls vs bears power indicator that is based entirely on Wyckoff Weis Wave Volume trends. This indicator is part of my DIVINE series RENKO indicators that run on an engine capable of extracting Renko brick information from a time series. As with the Renko RSI and Renko Trend Momentum indicators, swapping between Renko and time series type charts(bar, candlestick , heikin ashi) is seamless.
The algorithm uses the cumulative volume sum during the lifetime of a Renko brick formation. It tries hard to dissect and distribute volume when multiple bricks are formed during a single time candle (bar, candlestick , heikin ashi). Both positive and negative volume are plotted simultaneously, so that any instance where multiple bricks are created in a single time candle, positive and negative volume will be shown.
4 color themes as with all of the other DIVINE series indicators and strategies.
Shows ares of accumulation, distribution, capitulation. volatility .
Shows volatile brick locations with counts that indicate the number of nested bricks that were contained in a single time based candle.
Works well with Renko Price Bars Overlay script.
Reference to explanation of volatile brick information tips.
All feature requests are welcome. PM for access.

Renkomonster, v. 5.0RenkoMonster Elite
A radical redesign of our other approaches, RenkoMonster uses deep algorithmic and pattern tracking against standard systems to produce trade logic with the quietest, most actionable, signal-to-noise certainty. Designing around the right parameters brings the best results, and for investment instruments, that means focusing on market-mirroring mathematics that produce profits. Note, however, that focus on profits also means building an engine that maximizes for return, not some abstract percentage of right guesses. RenkoMonster is therefore built to enter every high-probability trade, then evaluate ongoing metrics to stay with a winner as long as possible, but also recognizing the need to exit quickly as soon as high-probability failure signals arise. The result: consistent winning trades, but, more importantly, immense profit-to-loss ratios that bring a superior payoff. RenkoMonster keeps you in the game to catch the huge runs that bring the big returns. (see Results Chart below) A premium trading system for the discerning investor seeking robust, effortless results across a range of asset classes, contact us for a free trial to test RenkoMonster on your favorite charts.
Results Chart
The backtests below show 1-year returns against a Buy and Hold (B+H) approach for 40 of the world’s top traded instruments (as measured by price volume or similar indicator). The RenkoMonster system was run on the top 10 instruments in four major markets: Equities, ETFs, Cryptocurrencies, and Forex. All tests were on a 30min chart, set to Renko “Traditional” blocks (because TradingView does not support realtime alerts from ATR-based charts). Block size was set proportionately to price to give the instrument positive results, but there was no “cherry-picking”. (In fact, changing time frames would have produced even better returns in some cases, but it seemed best to use a consistent measure.) Subscribers to the system receive a full, step-by-step breakdown on how to customize the parameters to get the best from their favorite markets.
(For each instrument, you see listed its Symbol (name), Profit % (annual return using RenkoMonster), Winning Trade % (being “right”), ProfitFactor (Ratio of money won to money lost), Max Draw Down % (point of worst % loss during the year), and B+H (how much the asset would have returned with no trades, via "buy-and-hold" )...)
RenkoMonste
Settings: 30 min, Traditional Renko box, over 1 year (June 1, 2018 - June 1, 2019)
EQUITIES
Symbol._.Profit Profit %._.Trade %._.Pf Max DrDn._.B + H
AMZN._.._.9,935._.._.._.._.66._.._..9.4._.._.._.1._.._.._.7
AAPL._.._.._318._.._.._.._.54._.._.._7.4._.._.._.2._.._.._.5
TSLA._.._32,777._.._.._.._.60._.._.._7.8._.._.._.2._.._.(-38)
FB._.._.._.._371._.._.._.._.46._.._.._5.4._.._.._.3._.._..(-7)
BABA._.._.._671._.._.._.._.55._.._.._6.3._.._.._.2._.._.(-23)
BYND._.._.._499._.._.._.._.67._.._..24._.._.._.._1._.._.140
MSFT._.._.._.271._.._.._.._.52._.._.._6.5._.._.._.2._.._..28
AMD._.._.._..539._.._.._.._.48._.._.._4.1._.._...13._.._.._0
NFLX._.._..8,695._.._.._.._.57._.._.._.7.4._.._.._2._.._.(-5)
BA._.._.._.1,448._.._.._.._..57._.._.._7.9._.._.._1._.._..97
ETFs
Symbol._.Profit %._.Trade %._.Pf._.Max DrDn._.B + H
SPY._.._.._.775._.._..66._.._..9.7._.._.1._.._.._.4
QQQ._.._.2,918._.._..66._.._.11._.._..1._.._.._.5
EEM._.._.._.463._.._..60._.._..7.1._.._.1._.._.._0
IWM._.._..2,060._.._..62._.._..9.1._.._.1._.._.(-3)
HYG._.._.._..18._.._..45._.._..2.2._.._.1._.._.._0.5
EWZ._.._.10,426._.._..62._...11._.._.._1._.._..26
LQD._.._.._..12._.._.._45._.._.2.3._.._.1._.._.._6
EFA._.._.._.236._.._.._52._.._.6.2._.._.1._.._..(-7)
FXI._.._.._..900._.._.._62._.._.8.3._.._.1._.._.(-15)
XLF._.._.._..393._.._...60._.._.6.8._.._.1._.._..(-3)
CRYPTOCURRENCIES
Symbol._.._.Profit %._.._.Trade %._.Pf._.Max DrDn._.B + H
BTC/USD._.100 million._.._.58._.._.12._.._.2._.._.._.(-8)
ETH/USD._.232 million._.._.54._.._..6.2._..4._.._.._(-54)
XRP/USD._.840 million._.._.52._.._..7._.._.4._.._.._(-21)
LTC/USD._.14 million._.._..51._.._..6.5._..5._.._.._..13
BCH/USD._.17 million._.._.51._.._..6._.._15._.._.._.(-5)
EOS/USD._.5 million._.._..49._.._..5.3._.._7._.._.._..13
BNB/USDT._.4 billion._.._..56._...15._.._..4.._.._.._128
BSV/USD._.299,000._.._.._.67._..109._.._..2._.._.._.(-8)
XLM/USD._.94 billion._.._..64._.._11._.._..3._.._.._..34
ADA/USD._.647,000._.._.._75._.._34._.._..1._.._.._.._3
FOREX PAIRS
Symbol._.._.Profit %._.Trade %._.Pf._.Max DrDn._.B + H
EUR/USD._.._.17._.._.._.37._.._.1.5._.._.2._.._.._.(-4)
USD/JPY._.._..9._.._.._..34._.._.1.2._.._.3._.._.._.(-1)
AUD/USD._.._.35._.._.._.45._.._.2.1._.._.2._.._.._.10
USD/CAD._.._.13._.._.._.35._.._.1.4._.._.3._.._.._..3
GBP/USD._.._.46._.._.._.38._.._.1.8._.._.3._.._.._.(-5)
NZD/USD._.._.39._.._.._.50._.._.2.6._.._.1._.._.._.(-6)
GBP/JPY._.._.66._.._.._.39._.._.1.9._.._.2._.._.._.(-6)
EUR/JPY._.._.25._.._.._.45._.._.2.1._.._.3._.._.._.(-5)
AUD/JPY._.._.65._.._.._.36._.._.1.9._.._.2._.._.._(-10)
EUR/GBP._.._.25._.._.._.45._.._.2.1._.._.3._.._.._..0.1

Renko Ghost, v. 2.0Renko Ghost
Custom-designed to take advantage of the smoothing signals from Renko charting, Renko Ghost creates client-side ATR calculations to build an overlay of “ghost” Renko blocks which emulate the popular ATR blocks on top of TradingView’s Traditional Renko charts. By combining constant ATR updates with the “trend anticipation” patterning of our other systems, Renko Ghost can deliver more responsive, finely-tuned reads on market turns. (Check out results below) Contact us for a free trial to test Renko Ghost on your go-to charts. And be sure to check out our other dynamic trading systems.
We are always available for questions, comments, and suggestions. There is always room for improvement.
Results Chart
The backtests below show 1-year returns against a Buy and Hold (B+H) approach for 40 of the world’s top traded instruments (as measured by price volume or similar indicator). The Renko Ghost system was run on the top 10 instruments in four major markets: Equities, ETFs, Cryptocurrencies, and Forex. All tests were on a 30min chart, set to Renko “Traditional” blocks (because TradingView does not support realtime alerts from ATR-based charts). Block size was set proportionately to price to give the instrument positive results, but there was no “cherry-picking”. (In fact, changing time frames would have produced even better returns in some cases, but it seemed best to use a consistent measure.) Subscribers to the system receive a full, step-by-step breakdown on how to customize the parameters to get the best from their favorite markets.
(For each instrument, you see listed its Symbol (name), Profit % (annual return using Renko Ghost), Winning Trade % (being “right”), ProfitFactor (Ratio of money won to money lost), Max Draw Down % (point of worst % loss during the year), and B+H (how much the asset would have returned with no trades, via "buy-and-hold" )...)
Renko Ghost
Settings: 30 min, Traditional Renko box, over 1 year (June 1, 2018 - June 1, 2019)
EQUITIES
Symbol,_.,_.Profit %,_.Trade %,_.Pf,_.Max Dr Dn,_.B + H
AMZN,_.,_.,_.1,874,_.,_.62,_.,_.6.3,_.,_.3,_.,_.,_.,_.7
AAPL,_.,_.,_.,_.141,_.,_.48,_.,_.3.4,_.,_.5,_.,_.,_.,_.5
TSLA,_.,_.,_._6,603,_.,_.58,_.,_.5.6,_.,_.6,_.,_.,_.(-38)
FB,_.,_.,_.,_.,_.170,_.,_.48,_.,_.3,_.,_.,_8,_.,_.,_.(-7)
BABA,_.,_.,_.,_.220,_.,_.56,_.,_.3.2,_.,_.9,_.,_.,_.(-23)
BYND,_.,_.,_.,_.305,_.,_.60,_.,_.7.1,_.,_.5,_.,_.,_,_140
MSFT,_.,_.,_.,_.191,_.,_.57,_.,_.6,_.,_.,_3,_.,_.,_.,,_28
AMD,_.,_.,_.,_.,142,_.,_.45,_.,_.2.3,_.,_13,_.,_.,_.,_,0
NFLX_,_.,_.,_.1,902,_.,_.54,_.,_.1.4,_.,_11,_.,_.,_.,(-5)
BA,_.,_.,_.,_.,_.560,_.,_.54,_.,_.4.9,_.,_.3,_.,_.,_.,,_97
ETFs
Symbol,_.Profit %,_.Trade %,_.Pf,_.Max DrDn,_.B + H
SPY,_.,_.,_.724,_.,_.64,_.,_.,_8.3,_.,_.1,_.,_.,_.4
QQQ,_.,_.2,553,_.,_.63,_.,_.,_9.3,_.,_.1,_.,_.,_.5
EEM,_.,_.,_.340,_.,_.52,_.,_.,_5.5,_.,_.2,_.,_.,_.0
IWM,_.,_.,1,801,_.,_.61,_.,_.,_7.7,_.,_.1,_.,_.,(-3)
HYG,_.,_.,_.,17,_.,_.45,_.,_.,_2.5,_.,_.1,_.,_.,,0.5
EWZ,_.,_.4,855,_.,_.59,_.,_.,_9.2,_.,_.2,_.,_.,_.26
LQD,_.,_.,_.,12,_.,_.48,_.,_.,_1.7,_.,_.2,_.,_.,_.6
EFA,_.,_.,_.192,_.,_.52,_.,_.,_4.9,_.,_.2,_.,_.,_(-7)
FXI,_.,_.,_.669,_.,_.55,_.,_.,_6.3,_.,_.,1,_.,_.,(-15)
XLF,_.,_.,_.287,_.,_.55,_.,_.,_4.8,_.,_.,2,_.,_.,(-3)
CRYPTOCURRENCIES
Symbol,_.,_.Profit %,_.Trade %,_.Pf,_.Max DrDn,_.B + H
BTC/USD,_.22 million,_.,_.54,_.,8.1,_.,_3,_.,_.,_.(-8)
ETH/USD,_.15 million,_.,_.50,_.,5.1,_.,_7,_.,_.,_(-54)
XRP/USD,_.26 million,_.,_.49,_.,4.3,_.,_8,_.,_.,_(-21)
LTC/USD,_.785,000,_.,_.,_50,_.,5,_.,_.,12,_.,_.,_.13
BCH/USD,_.756,000,_.,_.,_46,_.,3.6,_.,15,_.,_.,_.(-5)
EOS/USD,_.258,000,_.,_.,_47,_.,3.5,_.,,27,_.,_.,_.13
BNB/USDT,_22 million,_.,_55,_.,7.3,_.,_.8,_.,_.,_143
BSV/USD,_.170,000,_.,_.,_64,.100,_.,_.,,4,_.,_.,_(-8)
XLM/USD,_.15 billion,_.,_.61,_.,7.7,_.,_.5,_.,_.,_.34
ADA/USD,_.136,000,_.,_.,70,_.20,_.,_.,_.2,_.,_.,_.3
FOREX PAIRS
Symbol,_.,_.Profit %,_.Trade %,_.Pf,_.Max Dr Dn,_.B + H
EUR/USD,_.,_.13,_.,_.,_36,_.,_.,1.5,_.,_.,_2,_.,_.,_(-4)
USD/JPY,_.,_.,,5,_.,_.,_31,_.,_.,1.2,_.,_.,_2,_.,_.,_(-1)
AUD/USD,_.,_.26,_.,_.,_44,_.,_.,2,_.,_.,_.,3,_.,_.,_.10
USD/CAD,_.,_.16,_.,_.,_37,_.,_.,1.6,_.,_.,_2,_.,_.,_.,3
GBP/USD,_.,_.37,_.,_.,_37,_.,_.,1.7,_.,_.,_2,_.,_.,_(-5)
NZD/USD,_.,_.24,_.,_.,_50,_.,_.,2,_.,_.,_.,2,_.,_.,_(-6)
GBP/JPY,_.,_.57,_.,_.,_41,_.,_.,1.8,_.,_.,_3,_.,_.,_(-6)
EUR/JPY,_.,_.19,_.,_.,_39,_.,_.,1.4,_.,_.,_4,_.,_.,_(-5)
AUD/JPY,_.,_.50,_.,_.,_36,_.,_.,1.7,_.,_.,_4,_.,_.,(-10)
EUR/GBP,_.,_.13,_.,_.,_41,_.,_.,1.4,_.,_.,_3,_.,_.,_0.1
TrendMaster Gold, v. 6.2xTrendMaster Gold
The ultimate refinement of last year’s TrendMaster system, TrendMaster Gold takes deep pattern recognition to a new level tracking over 20 indicators triggering seven decision gates to trade in a Renko-smoothed charting environment. Optimized for higher returns over a wider range of instruments (see returns below), you are invited to trial this market-mirroring engine. Subscribers receive full breakdown for fine-tuning results to their market favorites while avoiding bot traps. Reach out by message to get your free trial. We are always available for questions, comments, and suggestions. There’s always room for improvement.
Results Chart
The backtests below show 1-year returns against a Buy and Hold (B+H) approach for 40 of the world’s top traded instruments (as measured by price volume or similar indicator). The TrendMaster system was run on the top 10 instruments in each of four major markets: Equities, ETFs, Cryptocurrencies, and Forex. All tests were on a 30min chart, set to Renko “Traditional” blocks (because TradingView does not support realtime alerts from ATR-based charts). Block size was set proportionately to price to give the instrument positive results, but there was no “cherry-picking”. (In fact, changing time frames would have produced even better returns in some cases, but it seemed best to use a consistent measure.) Subscribers to the system receive a full, step-by-step breakdown on how to customize the parameters to get the best from their favorite markets.
(For each instrument, you see listed its Symbol (name), Profit % (annual return using TrendMaster Gold), Winning Trade % (being “right”), ProfitFactor (Ratio of money won to money lost), Max Draw Down % (point of worst % loss during the year), and B+H (how much the asset would have returned with no trades, via "buy-and-hold" )...)
TrendMaster Gold
Settings: 30 min, Traditional Renko box, over 1 year (June 1, 2018 - June 1, 2019)
EQUITIES
Symbol Profit % Trade % PF Max DrDn B + H
AMZN 2,212 62 6.6 3 7
AAPL 158 49 3.7 5 5
TSLA 8,263 57 5 6 -38
FB 179 47 3 8 -7
BABA 247 56 3.4 9 -23
BYND 348 67 17.9 6 140
MSFT 224 58 6.8 3 28
AMD 171 50 2.6 13 0
NFLX 2,132 55 5.2 11 -5
BA 560 54 4.9 3 97
ETFs
Symbol Profit % Trade % PF Max DrDn B + H
SPY 275 64 5.5 3 4
QQQ 865 62 6.1 3 5
EEM 278 60 5.3 2 0
IWM 783 61 6.1 2 -3
HYG 21 51 2.7 1 0.5
EWZ 798 58 5.6 5 26
LQD 12 54 2 1 6
EFA 121 61 4.5 2 -7
FXI 391 63 5.4 3 -15
XLF 200 58 3.4 5 -3
CRYPTOCURRENCIES
Symbol Profit % Trade % PF Max DrDn B + H
BTC/USD 3 million 55 4.7 8 -8
ETH/USD 2 million 52 4.9 21 -54
XRP/USD 6 million 52 4 13 -16.6
LTC/USD 222,000 54 3 13 13
BCH/USD 380,000 54 4.6 28 -5
EOS/USD 147,000 55 2.7 20 13
BNB/USDT 2 million 54 4.4 14 143
BSV/USD 334,000 65 18 5 -8
XLM/USD 34 million 51 2.8 12 34
ADA/USD 48,000 64 7 6 3
FOREX PAIRS
Symbol Profit % Trade % PF Max DrDn B + H
EUR/USD 13 41 1.3 5 -4
USD/JPY 3 37 1.1 4 -1
AUD/USD 24 43 1.4 4 10
USD/CAD 20 43 1.7 4 3
GBP/USD 36 46 1.8 2 -5
NZD/USD 21 47 1.6 2 -6
GBP/JPY 40 42 1.6 2 -6
EUR/JPY 18 54 3.2 2 -5
AUD/JPY 47 44 1.8 5 -10
EUR/GBP 17 46 1.7 4 0.1

RSI-RENKO Divine StrategyLive, non-repainting strategy using RENKO and RSI mixed together to multiple types of long and short positions.
- Features -
Live entry direction with trade warnings and alerts
Live trade building buy and sell limits (for buy/sell limits)
Entry location icons as well as pyramid entries (to add to existing position)
Swing trades that keep you in the trade for the maximum possible profit
1 scalp target based on the RSI settings and entry location
Dynamic trailing stop for swings and scalps
Alert conditions for every update and condition change of the strategy (Provided by indicator study)
4 pre-built color themes, including candlestick coloring
This script is used solely for alerts to the RSI-RENKO Divine Strategy , because Trading View still after 3 years of requesting does not provide the ability to use alert conditions inside a strategy script, only an indicator script. This strategy should be used to backtest your settings. Beyond alerts and strategy inputs, the strategy and indicator are identical.