Magnetic Zones v1.1 BetaMagnetic Zones v1.1 Beta
This is one of the most powerful and effective indicator which I personally use for Intraday.
It works well for trending stocks and trending days.
What are the Zones?
The zones are basically Retracement and Reversal Zones. The price will take a halt at this zones. So it will be easy to take an entry.
How to use?
Labels:
Pivot = P
Major Zones = R1, R2, R3, S1, S2, S3
Minor Zones = R0.5, R1.5, R2.5, S0.5, S1.5, S2.5
Previous Day High & Low = PDH, PDL
Breakout:
Opens between Previous Day High or Low and R1 or S1 Zone and taking retracement at the zone can result in a breakout.
Entry Time:
No Entry: 0 to 15min. Wait for the early Algo rush to settle down. Just go through the shortlisted stocks or top gainers and top losers.
Risky Entry: 15min to 30min. It is the right or early time to participate in the beginning of a rally. But, recommended only for experienced, disciplined and planned traders.
Moderate Risk: 30min to 45min
Safe Entry: After 45min to 1hr
Stock Selection Tip:
Use Expanded Floor Pivots to spot Narrow Range stocks.
Entry Tip:
Use Opening Range Breakout (15, 30, 45 or 1hr) to spot false shoot ups.
Entry:
After the retracement on or closer to the zones.
If the retracement happens in between spaces of the zones expect next retracement at the next in between space. Imagine the levels accordingly.
Retracement is the right time to make an entry with minimum stoploss.
Stoploss:
Just below the longest candle which touches the zone.
Target:
If it is a trending stock the price will move easily from one major zone to another major zone.
If the zones are wider on a particular day use the minor zones as target.
Consider the historical support and resistance, highs and lows to confirm the entry or exit.
Indicator Features:
Inclusion of 2nd and 3rd zones: Helpful to identify the target zone and to participation in a major rally.
Clean and cluster free look
Shows only required zones
Hide historical levels
Previous day High and Low levels
Multi time-frame
Caution:
Don't solely depend on this indicator. Always use this with other analyzing tools or methods for more confirmation.
Acknowledgement:
Thanking the original formulators.
Note:
The indicator is under testing. Any errors, updates and additions will be updated in the final version.
Even though there many are other indicators similar to this in TradingView, this indicator is customized for precision, inclusion of extended levels and designed for a squeeze free chart and visual appeal.
Explore, improvise and formulate new methods with your personal experience and ideas.
Retracement

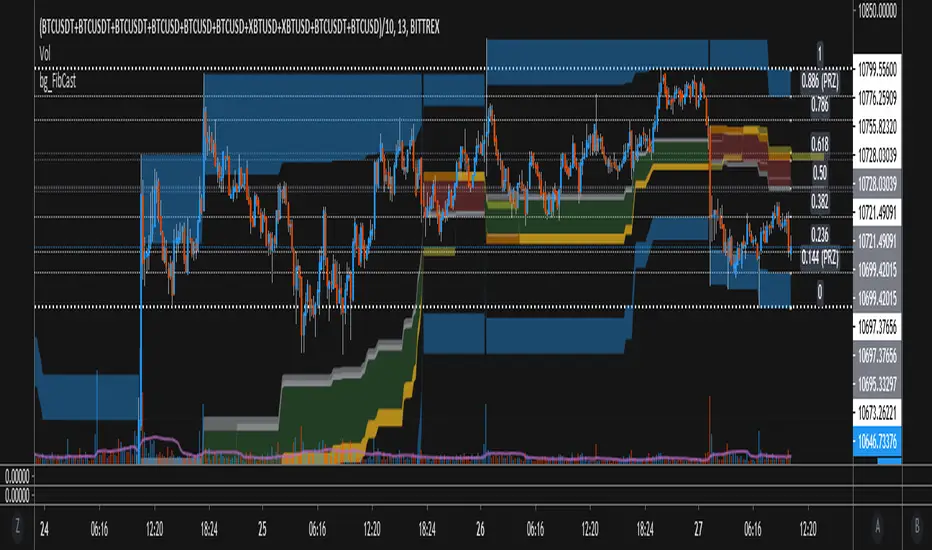
bgeraghty_FibCastThis script draws a High-To-Low or Low-To-High Fibonacci Retrace over the chart, based on which of those two happens in the given time period (Default is 144 Candles).
Updates from older versions:
- Paints 0.5, 0.618, 0.65 and spaces in between, giving good hindsight to the trend, and ideas of where strong support/resistance may lie.
- Silver Paint Strip = 0.50 retrace, Gold = 0.618-0.65, and the Red/Green between indicates the direction of the (Fib) Trend as H->L or L->H
- Paints 0.144 and 0.886 ranges Blue, and these are typically extremes or possible reversal zones. (PRZ)
Fast ROI checker 50% Gann RetracementThis script is based on the Gann's 50% Retracement rule.
First, the ATH (All Time High) and ATL (All Time Low) are calculated; then, the 50% retracement level is found.
With this 50% level, we'll calculate the maximum price entry to keep a ROI which is set in the parameters.
For exemple, I only want to buy assets which can make a x16 before the 50% retracement , the script will calculate the maximum entry to respect this ROI .
If the Max entry price is above the ATL , the line will be green; if not, the line will be red.
To faster the search in the watchlist, when the price is between the Max Entry line and the ATL line, the background is painted in green.
It's not an investment strategy, you have to find your proper indicators to make purchases.
Enjoy !

Automatic Fibonacci Retracements [MS]Automatic Fibonacci Retracement Level indicator for any time frame, any asset.
Simple to use, just add to your chart and set the size of retracements you want to see.
Fib levels keep drawing in real time until the next low or high is found to start drawing the next fib.
Settings Include
• Fib size
• Show prices
• Draw low-to-high or high-to-low
• Toggle fib levels
Use the link below or PM us to obtain access to this indicator.

NCTA Adaptive Entry SystemAdaptive Entry System (AES)
Price action of stocks, indexes, and futures consists of periods of trending action, retracements within the trend and then a resumption of the original trend. Trending patterns do not move straight up or straight down. They move in cycles which, when properly identified, can offer traders an opportunity to “follow the trend” while also recognizing the probability of a near term retracement before resuming movement in the direction of the trend. Experienced traders with advanced skills at interpreting wave patterns (Elliott Wave), Fibonacci retracements, Stochastics (overbought / oversold conditions), Momentum, and Moving Averages apply their advanced knowledge to trading and identifying these trend - retracement - continuation of trend cycles. These skills require an advanced knowledge of these complex indicators and can be difficult for traders without the same skill set to optimize their trading performance.
The Adaptive Entry System (AES) was created as a technical market metrics system to interpret a variety of advanced signals and present to the trader a “single actionable signal” displayed in an easy to recognize format for traders of most any skill level to benefit from.
AES is a “system” as opposed to a single indicator. It was designed with the goal of simplifying a traders ability to recognize an entry opportunity by summarizing the consensus of several key indicators and displaying a single entry / exit signal in a color highlighted, strategy labeled format. The work of comparing a variety of indicators and assessing the strength of alignment is performed for the trader by the Adaptive Entry System.
There are three possible entry signals displayed. A trader may trade all three or customize the settings to choose just a single signal to trade. It is important for any trader incorporating AES into their toolset that they trade in sim / virtual mode for a period of time to confirm they understand how price action responds to the signals and to personally track the performance of each. A good trading system still requires due diligence on the part of the trader to confirm understanding of how the system performs.
Entry Signal #1 Description:
Trend Bias Plus Signal is intended to provide traders with an early view of the probable directional bias of the stock, index, or futures being traded. Trend Bias was designed to recognize the probability of the early stages of the strongest segment of a wave pattern. Recognizing the probable bias of the trend at an early stage and also having an indication of when that trend may be ending offers traders an opportunity to enhance their ability to optimally benefit from the trend.
How to Read the Trend Bias Plus Signal:
The Trend Bias Plus Signal is displayed as a simple to recognize color coding of the price bars. Blue price bars indicate a probable rising price bias. Red price bars indicate a probable declining price bias. White bars indicate a neutral period with no clear directional bias.
How to Trade the Trend Bias Plus Signal:
The Trend Bias Plus Signal is simple to interpret. When a price bar closes blue and the next price bar opens blue, this signals to the trader to open an upward bias position. Buy-to-open a call option, buy the stock, or open a long futures position. When a price bar closes red and the next price bar opens red, this signals to the trader to open a downward bias position. Buy-to-open a put option, short the stock or close a long stock position, or open a short futures position.
When holding a short or long position based on the Trend Bias Plus, there are a variety of exit methods which a trader can use including stops, limit price orders with fixed profit targets, or trail stops. Regardless, the end of a Trend Bias Plus cycle is indicated when a new price bar opens white. This is evidence that the current rising or declining trend is shifting to a neutral state. A trend may also be viewed as having ended when an opposite color bar prints at the open of a new price bar.
Entry Signal #2 Description:
The Momentum Signal is a near term indication of a probable retracement of the current trend. It identifies a temporary reversal of an overarching trend in a stock's price. Retracements are short-term periods of movement against a trend, followed by a return to the previous trend. Momentum signals are usually counter-trend trades identifying that part of the wave sequence where price temporarily moves opposite the direction of the trend. The momentum signal can be an opportunity for traders to take advantage of the natural pattern of trend - retracements - continuation.
How to Read the Momentum Signal:
The Momentum signal is displayed as a vertical color highlight on the price bar with a “M” label inside a directional indicator box. A red vertical highlight with an arrow box and “M” label pointing lower is a signal that the near term price movement may be downward bias. For an upward bias price movement signal, the Momentum indicator will display a green highlight across the price bar with an arrow box and “M” label pointing higher.
How to Trade the Momentum Signal:
When the highlighted directional labeled box prints at the open of a new price bar, take the trade based on the directional bias displayed. Momentum signals are generally counter trend indicators so a downward bias red bar, prompting the trader to go short may print on a long bias blue Trend Bias Plus price bar. This should not be viewed as a conflict but instead as a probable indication of a short term retracement following the natural sequence of cycles in price movement.
Momentum signals may be traded using stocks, options, or futures.
Entry Signal #3 Description:
The Consensus Signal is an indication that price action may be resuming in the direction of the primary trend.
How to Read the Consensus Signal:
The Consensus Signal is displayed as a vertical color highlight on the price bar with a “C” label inside a directional indicator box. A red vertical highlight and an arrow box with a “C” label pointing lower is a signal that the price movement may be resuming a downward bias trend or strengthening a conviction to the current trend. For an upward bias price movement signal, the Consensus indicator will display a green highlight across the price bar and an arrow box with a “C” label pointing higher. This is a signal that the retracement off of the trend may be concluding and/or a strengthening of a conviction to the current trend.
How to Trade the Consensus Signal:
When the highlighted directional labeled box prints at the open of a new price bar, take the trade based on the directional bias displayed. Consensus signals are generally most productive when traded aligned with the trend, as displayed by the Trend Bias Plus price bar color or when a white bar indicates a neutral state of the price trend. Counter trend trades using the Consensus Signal are not advised and considered to be less productive / higher risk.
Consensus signals may be traded using stocks, options, or futures.
Some General Rules:
Trade signals are only considered valid when they display at the open of a new price bar.
The signals can be traded on different timeframe charts from short term 3 minute charts to longer timeframe daily charts.
The signals are designed to be a generic indication of probable price movement and as such, can be used effectively for trading futures, stocks, options on stocks, options on ETFs, and options on cash settled indexes.
AES offers traders an opportunity to optimize performance from the natural cycles of the market….trend - retracement - continuation.
AES offers an opportunity for traders to have a clear entry / exit criteria. However, it is still imperative that each trader understands the trading strategy they intend to use and the risks and opportunities associated with that strategy. It is highly advised, regardless of the system or strategies being used, that a trader validates their understanding of the system/strategy by trading in a simulated, paper account format to self test the system and personal ability to trade it successfully.
Next Bar Alert:
Included is an optional "Next Bar Alert" setting. Since many of these signals benefit from very prompt action at the beginning of a price bar, there is an additional option in Settings to set an arbitrary number of seconds to be alerted before the next price bar opens. Simply set this to a level you prefer, then set an alert in TradingView on the indicator using the "Next Bar Alert" alert parameter.
Summary:
The color highlight indicator allows the trader to be 100% certain that the rules/criteria for confirming a valid entry were met at the open of the price bar. This feature, along with the alert settings in Trading View, provide clear confirmation of the timing and print of the signal as either valid or not.
Adaptive Entry System has been designed to help traders of all skill levels to trade the natural sequence of patterns in price action using a simple to recognize, single signal entry/exit format. The natural cycle of trend (Trend Bias Plus), then retracement (Momentum), followed by a continuation of the original trend (Consensus) can be identified within this system and offers traders a simple signal to take advantage of each phase in the cycle. Stock investors, options traders, and futures traders can benefit from the simple design of the AES on a variety of time frames.
Trend Bias Plus signals on NASDAQ:TSLA Daily chart:
Trend Bias Plus signals on NASDAQ:AMZN Daily chart:

Hidden Supports & Resistances + Round LevelsIf you search the internet, you won't find much about these types of resistance and support levels. Hidden levels are SnR levels calculated based on some psychological patterns and sometimes it's unbelievable that the chart responds to these levels.
So use the indicator and check the idea.

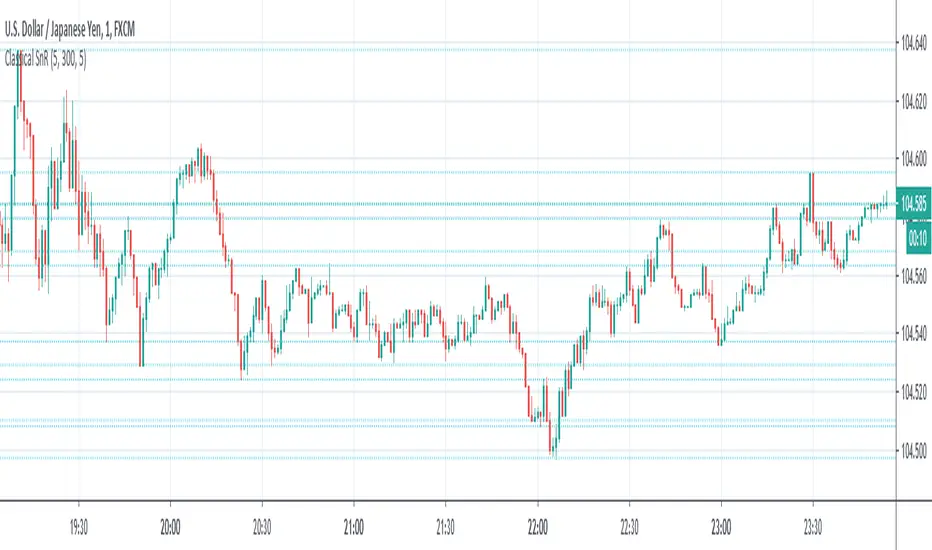
Classical Supports & ResistancesThis indicator shows classical resistance and support levels which retraced the chart lately. Notice that the condensed lines laying close together are showing an area of support and/or resistance.
But after all, it was a tedious work creating this indicator because like I've already said, pine script is a very odd and weak language which does not have many ordinary features like useful loops, simple line drawing and even reasonable variable casting!
So I was forced to use its built-in pivothigh() and pivotlow() functions without any handy documentation. I assume that even these functions don't work as expected, and because of that, I embedded "Sensitivity" and "Lookback Time" options in the indicator as a workaround.
Feel free to use it and send me your comments/solutions.
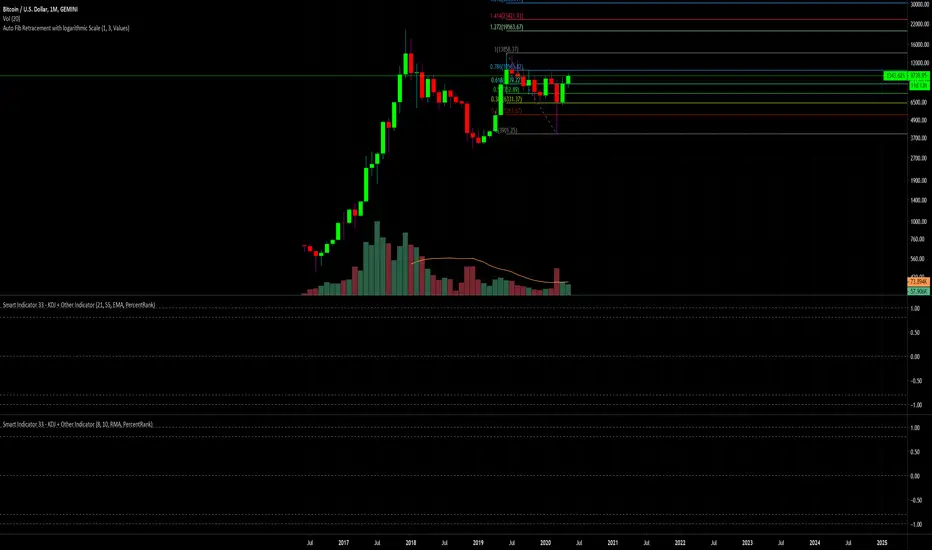
Auto Fib Retracement with logarithmic ScaleThis is the same Original Pine Built-in Script announced in tradingview blog on 19-05-2020 ( "Auto Fib Retracement — the New Pine Indicator" ), but with the option to use on Logarithmic Scale.
Bollinger Bands Fibonacci Ratios (Automatic Timeframe)A Fibonacci Bollinger Bands indicator with automatic timeframe detection.
The timeframe reverts to the value specified in settings when viewing Daily, Monthly or seconds-based charts.
Based on: Bollinger Bands Fibonacci ratios by Shizaru (/script/bCy9urOG-Bollinger-Bands-Fibonacci-ratios/)

Scalper Pro Pivot - Scalpers WeaponToday I feel good to share with my all pals a new "Pivot Point" indicator which I never thought that it could be that easily done. I have been trading for years but I am, to be honest, new to pine script. I used to code other programming languages in the past like HTML, CSS, javascript, PHP, etc web-based programming language which luckily helped me to understand pinescript. It was a bit of my history about coding now talking to the main reason why I created this script in the first place? The answer is simple "I mean who the hell don't want to make their own indicators which work to accomplish own goals". There are lots of indicators which I saw in the public library as well as inside build in but, to be honest, I didn't found any pivot point indicator which calculates the "Fibonacci" method. Even if there are hundreds of pivot point indicators out there in public and built-in but they were either in higher timeframe (daily or above resolution) and weren't on a lower timeframe like starting from 1-minute resolution. There are some lower timeframe pivot point indicators but they aren't using the same method of calculation which I wished and if I ever figure out one then they just end up being repaints which didn't work properly as I wanted. The last but not least reason to create this indicator was obviously for all those short term traders (Scalpers) which I believe this indicator will be a game-changer by adding more support on their current trading strategies. It is so flexible that we can change the resolution from 1min to 1month and, to be honest with you all Fibonacci method used pivot points works most of the time with my own years of personal experience using them in higher timeframes and that is mainly one reason why I was eager to make one which can be used in lower timeframes. It will be useful for all types of traders (short-mid-long). The indicator was specially created for my own scalping purposes and indeed at the end, the creation of this indicator became like if I was mean to dedicate this to my fellow scalper's out there who value the pivot point! Lastly, I would like to give credit to pine script who gave support and knowledge for pine script as well as 'LonesomeTheBlue ' my friend who fixed some issue within the code and without him, my imagination wouldn't have been a reality. Inbox me if you are interested in it. Cheers!

Smart Indicator 28 - Swing Pivots (Higher Highs and Lower Lows)A simple way to find Higher Highs and Lower Lows (HH and LL) whit automatic Fibonacci Lines in the most common levels.
In this indicator the Higher Highs only happens when a high value are rising from each other in the last "Length of Real Pivots" highs and the next same number of highs are falling in every single bar.
The Lower Lows are inverted, LL only appears if a low is falling in every single bar in the last number of length and the lows price of the "n" bars next are rising.
You can use this Indicator in any kind of market.

Auto-fibsAutomatically plots Fibonacci Retracement levels.
Uses the all time high (ATH) for a specified number of days back, and the lowest value since the ATH, to plot the levels.

SharkPattern_ULTRA V1 - draws Shark Pattern inclusive alertsHI BIG PLAYERS AROUND THE WORLD,
this script allow to draw automatically lines of Shark Pattern. The Shark Pattern is part of Harmonic Pattern.
Parallel to the automatic drawing, the indicator can give signals as soon as the typically Fibonacci extension immediately reached or has been reached. This allows the indicator SharkPattern_ULTRA V1 to give early signals. In the default settings, the signals are displayed with a blue background on the chart.
SharkPattern_ULTRA V1 is offered for sale. More information can be found below in the signature.
However, anyone can test this indicator for once without any registration in a 3 day trial. You can request access with a simple message to me.
Another trial of 7 days is included in the offer on my website - before the first payment will done.
In the settings it is possible to change the degree of details. This is sometimes necessary because TradingView limited only 55 lines per indicator in Pinescript Version 4.
In extreme cases it is therefore possible to change the settings that the Shark Pattern represent waves only with 2 lines. This allows the indicator to detect far more Shark Pattern on the same chart.
For more great indicators everyone is invited to follow me on TradingView.
Kind regards
NXT2017

Price-Curve ChannelIntroduction
Although many will use lines in order to make support and resistances, others might use curves, this is logical since trends are not always linear. Therefore it was also important to take this into consideration, and when i published the price-line channel indicator, i already started a curved version of it. Therefore i propose this new indicator based on the recursive bands framework that allow to return curved support and resistances. The benefits of this indicator are : a totally stable approach, user friendly, and extremities able to converge faster toward the price.
The Indicator
The indicator is way faster than the price-line channel one, this is due to the fast convergence toward the price of the extremities. Length control the reactivity of the indicator, while mult is more related to the rate of convergence, values of mult lower than 1 will make the curve converge slower,
mult = .5
Higher values of mult will make the extremities converge faster toward the price.
mult = 2
Unlike the price-line channel indicator this one is directly "readjusted", this is due to the fact that the extremities are no longer linear, of course a "perfectly" curved version could come in an update, but for the moment it wasn't really a necessity.
Comparison With Price-Line
The fact that the extremities converge faster toward the price allow to possibly capture more tops/bottoms/retracements. However the extremities of both indicator have the same behavior regarding their accuracy, for example the upper extremity have a higher chance to detect a retracement when on a downtrend, while the lower extremity have higher chance to detect a retracement while on a up-trend.
On The Indicator Construction
The recursive bands framework is the core of the indicator, it is important to use it. The curved effect is given by multiplying the correction factor by the barssince function, therefore the correction factor is no longer constant which in return allow for a non linear output.
The size is divided by the square of length in order to keep a certain logic between the output and the length period.
Conclusion
The recursive bands framework prove again to be quite interesting, lot of indicators can be made using it, i only posted a fraction of what can be done with it, which make the recursive bands indicator one of the best indicators i ever made in my opinion.
The proposed indicator is stable, and don't require nightmarish manipulations (unlike the linear channels indicator), its ability to detect possible support and resistances points, although subjective, remain a feature of the indicator. The use of recursion make the indicator efficient. I hope the indicator find some use in the community.
Thanks for reading !
Linear version.
Note
Respect the house rules, always request permission before publishing open source code. This is an original work, requesting permission is the least you can do.
I apologize for any grammatical/orthographic error in this post.

Ultimate Pullback StrategyWhat is the Ultimate Pullback Strategy?
This strategy script is based on my Ultimate Pullback Indicator which detects pullback trading opportunities by analyzing price action in a very specific manner.
By combining simple trend filters with various advanced candlestick patterns it detects high-probability trend-continuation setups (and optional exits).
If you use this script to set alerts then you will never miss a pullback trading opportunity ever again!
I personally use this indicator to profitably trade pullback signals in the forex markets on multiple timeframes, from the 15-Minute chart to the 4-Hour and Daily chart.
Note: This strategy companion script is only available for subscribers of The Ultimate Pullback Indicator.

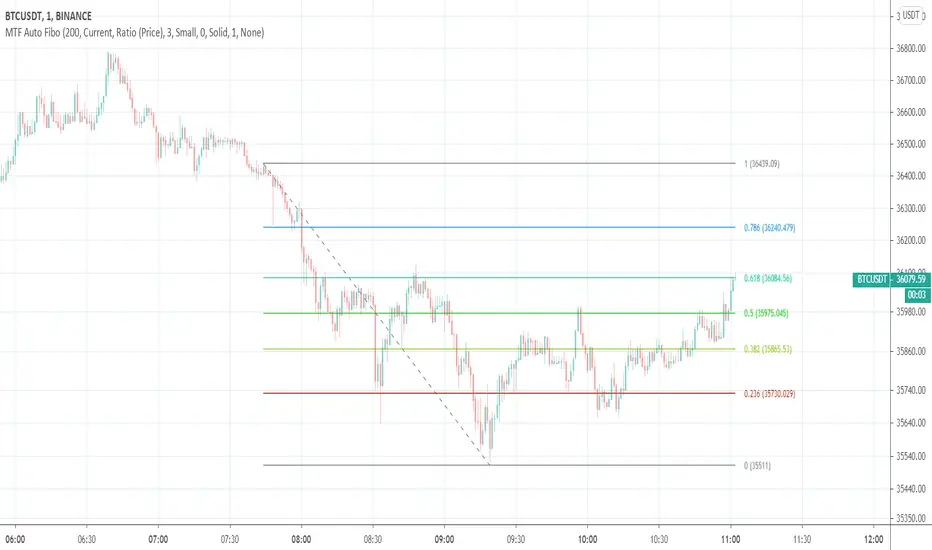
Auto Fibonacci Retracement Levels A Fibonacci retracement is a popular tool that traders can use to identify support and resistance levels, and place stop-loss orders or target prices.
The indicator connects any two points that are relevant, a high and low point.
The percentage levels provided are areas where the price could stall or reverse.
Levels should not be relied on exclusively. For example, it is dangerous to assume the price will reverse after hitting a specific Fibonacci level. It may, but it also may not.
Fibonacci retracement levels are most frequently used to provide potential areas of interest. If a trader wants to buy, they watch for the price to stall at a Fibonacci level and then bounce off that level before buying.
The most commonly used ratios include 23.6%, 38.2%, 50%, 61.8% and 78.6%. These represent how much of a prior move the price has corrected or retraced.

AutoFib
The AutoFib Pro is a useful tool that automatically calculates and plots Fibonacci Retracement levels. Each period, the AutoFib evaluates the price history over a user-specified number of bars. It then finds the extreme high and extreme low points for that window and then uses those values to establish 5 levels based on Fibonacci’s golden ratio.
This provides a simple visual representation of support and resistance levels. The tool’s automated nature means that the levels are dynamically adjusted to account for new extreme highs and lows, as well as irregular movements.
When the bands are located closely together, the security is experiencing high volatility. A large gap between the top and bottom levels signify a price outbreak. When the price crosses the middle 50% level, it is likely (but not guaranteed) to continue in that direction.

market phases - JDThis indicator shows the relation of price against different period ma's.
When put in daily Timeframe it gives the 1400 Day (= 200 Weekly) and the 200 ,100 an 50 Daily.
The lines show the 200,100 and 50 ma in relation to the 1400 ma.
JD.
#NotTradingAdvice #DYOR


[SignalFI] VectorFI V1 [Alerts]Fibonacci Based Fan Projections based on alternate timeframes.
IDENTIFY SUPPORT & RESISTANCE
IDENTIFY PRICE CHANNELS
MOMENTUM TRENDING ANALYSIS
ALERTS VERSION Only for Jedi and Master Subscribers
SignalFI was created to help traders and investors to effectively analyze the market based on the Golden Mean Ratio (Fibonacci numbers), plan a trade and ultimately execute it. To help inform and educate market decisions we developed a set of Trading Indicators which are available on TradingView , the most advanced and yet easy to use charting platform available on the web.
SignalFI indicators are just that, indicators. Our indicators are generally configured to use completely historical data (negating repaint), and we advise all alerts created with SignalFI indicators to be fired upon "close" of the current candle. Our indicators can provide valuable context and visualization support when performing market analysis and executing buy and sell decisions. However. we are not financial experts, and all information presented on this site or our other media outlets are for educational purposes only.
For subscription information, visit www.signalfi.net and follow us on twitter.

Golden Fib WavesDynamic Fibonacci levels in pleasing gold shades. Smoothing (SMA) of swing lows and highs enabled by default. Boldly, this just looks good. I am not sure whether it is of any help for trading purposes. If you do in fact find it useful, feel free to drop me a line and to share your insights.

MTF Auto Fibonacci LevelsDear traders,
It is time to diversify and to "fibonaccify" my developer experience.
On the preview you can see the daily chart with fibo levels from 3h timeframe.
Features
24 Fibonacci levels
24 timeframes
Ability to customize levels
Ability to specify a preferred timeframe
Supported levels
0
0.236
0.382
0.5
0.618
0.786
1
1.272
1.414
1.618
2
2.272
2.414
2.618
3
3.272
3.414
3.618
4
4.236
4.272
4.414
4.618
4.764
Supported resolutions
"1"
"3"
"5"
"10"
"15"
"30"
"45"
"60"
"120"
"180"
"240"
"300"
"360"
"420"
"480"
"540"
"600"
"660"
"720"
"D"
"2D"
"3D"
"W"
"M"
Hophop Ichimoku Cloud with Fibonacci RetracementThis indicator automatically draws Fibonacci retracement levels on top of the Ichimoku Cloud indicator
There are plenty of great Auto Fib generator indicators, particularly
by KIVANCfr3762 is the one I like a lot.
However if you use Ichimoku Cloud strategy with Fibonacci levels for the cloud settings this indicator will be quite handy on saving the hassle of adjusting the look back period of the auto fib with baseline of Ichimoku,
and also it will save you from using 1 indicators per chart limit which may be an issue for free plan users
BTC Tip: 39bwXN1chms1yHskBaYwz76UhDakc7grJ7
LTC Tip: MGD3U9dBCBVctwnoCa1grU8ompxG6hUhMk
ETH Tip: 0xEE9684a5aceE85036527aB48E596DeE4627bD84b
Bu indikator Ichimoku Cloud indikatoru uzerinde otomatik olarak Fibonacci retracement degerlerini cizmektedir,
Eger sadece otomatik Fibonacci retracement indikatoru ariyorsaniz, KIVANCfr3762 a ait olan indikatorunu cok basarili buluyorum ve onu kullanmanizi tavsiye ederim
Ancak siklikla Ichimoku Cloud ve Fibonacci Retracement kullaniyor iseniz her seferinde iki indikatorun ayarlarini degistirmekten kacinmak ve ayrica grafik uzerindeki indikator limitinden tasarruf etmek isterseniz bu indikatorun isinize yarayacagini dusunuyorum
Bu indikatorden faydalaniyor ve benzerleri uzerinde calismam icin destek olmak isterseniz
BTC Bahsis: 39bwXN1chms1yHskBaYwz76UhDakc7grJ7
LTC Bahsis: MGD3U9dBCBVctwnoCa1grU8ompxG6hUhMk
ETH Bahsis: 0xEE9684a5aceE85036527aB48E596DeE4627bD84b
