Cuban's Price Action ChannelThe latest in the indicator series tailored to discretionary traders.
This script draws a channel by using the highs and lows of previous timeframes. The H1 and H4 fill is extremely useful for taking low timeframe front-side reversals in a ranging environment, while providing high timeframe levels to take profit at, and plan your next trade.
I believe this script provides a solid fundamental price action understanding and foundation to anyone's discretionary trading setup.
Reversal

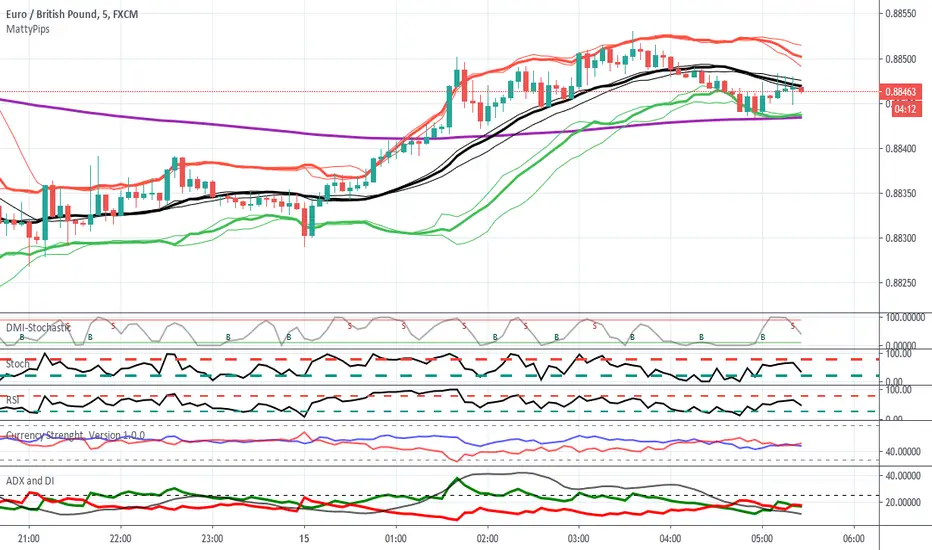
MattyPips Strategy with Alerts For education purpose.
Applied only for Matty Pips Strategy.
Arrow will appear when
DMI + Stoch + RSI are in the same OB/OS.
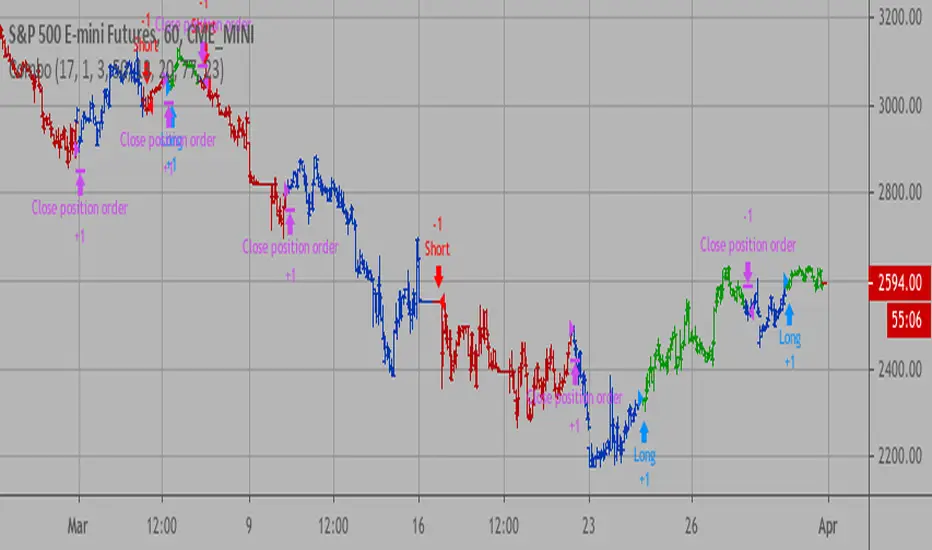
Combo Backtest 123 Reversal & ECO Strategy This is combo strategies for get a cumulative signal.
First strategy
This System was created from the Book "How I Tripled My Money In The
Futures Market" by Ulf Jensen, Page 183. This is reverse type of strategies.
The strategy buys at market, if close price is higher than the previous close
during 2 days and the meaning of 9-days Stochastic Slow Oscillator is lower than 50.
The strategy sells at market, if close price is lower than the previous close price
during 2 days and the meaning of 9-days Stochastic Fast Oscillator is higher than 50.
Second strategy
We call this one the ECO for short, but it will be listed on the indicator list
at W. Blau’s Ergodic Candlestick Oscillator. The ECO is a momentum indicator.
It is based on candlestick bars, and takes into account the size and direction
of the candlestick "body". We have found it to be a very good momentum indicator,
and especially smooth, because it is unaffected by gaps in price, unlike many other
momentum indicators.
We like to use this indicator as an additional trend confirmation tool, or as an
alternate trend definition tool, in place of a weekly indicator. The simplest way
of using the indicator is simply to define the trend based on which side of the "0"
line the indicator is located on. If the indicator is above "0", then the trend is up.
If the indicator is below "0" then the trend is down. You can add an additional
qualifier by noting the "slope" of the indicator, and the crossing points of the slow
and fast lines. Some like to use the slope alone to define trend direction. If the
lines are sloping upward, the trend is up. Alternately, if the lines are sloping
downward, the trend is down. In this view, the point where the lines "cross" is the
point where the trend changes.
When the ECO is below the "0" line, the trend is down, and we are qualified only to
sell on new short signals from the Hi-Lo Activator. In other words, when the ECO is
above 0, we are not allowed to take short signals, and when the ECO is below 0, we
are not allowed to take long signals.
WARNING:
- For purpose educate only
- This script to change bars colors.

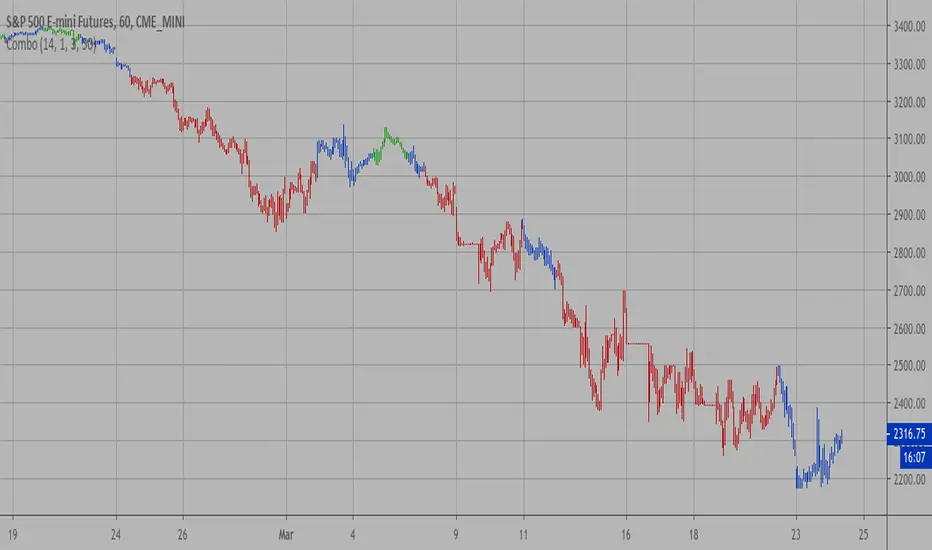
Combo Strategy 123 Reversal & ECO This is combo strategies for get a cumulative signal.
First strategy
This System was created from the Book "How I Tripled My Money In The
Futures Market" by Ulf Jensen, Page 183. This is reverse type of strategies.
The strategy buys at market, if close price is higher than the previous close
during 2 days and the meaning of 9-days Stochastic Slow Oscillator is lower than 50.
The strategy sells at market, if close price is lower than the previous close price
during 2 days and the meaning of 9-days Stochastic Fast Oscillator is higher than 50.
Second strategy
We call this one the ECO for short, but it will be listed on the indicator list
at W. Blau’s Ergodic Candlestick Oscillator. The ECO is a momentum indicator.
It is based on candlestick bars, and takes into account the size and direction
of the candlestick "body". We have found it to be a very good momentum indicator,
and especially smooth, because it is unaffected by gaps in price, unlike many other
momentum indicators.
We like to use this indicator as an additional trend confirmation tool, or as an
alternate trend definition tool, in place of a weekly indicator. The simplest way
of using the indicator is simply to define the trend based on which side of the "0"
line the indicator is located on. If the indicator is above "0", then the trend is up.
If the indicator is below "0" then the trend is down. You can add an additional
qualifier by noting the "slope" of the indicator, and the crossing points of the slow
and fast lines. Some like to use the slope alone to define trend direction. If the
lines are sloping upward, the trend is up. Alternately, if the lines are sloping
downward, the trend is down. In this view, the point where the lines "cross" is the
point where the trend changes.
When the ECO is below the "0" line, the trend is down, and we are qualified only to
sell on new short signals from the Hi-Lo Activator. In other words, when the ECO is
above 0, we are not allowed to take short signals, and when the ECO is below 0, we
are not allowed to take long signals.
WARNING:
- For purpose educate only
- This script to change bars colors.

Combo Backtest 123 Reversal & Ease of Movement (EOM) This is combo strategies for get a cumulative signal.
First strategy
This System was created from the Book "How I Tripled My Money In The
Futures Market" by Ulf Jensen, Page 183. This is reverse type of strategies.
The strategy buys at market, if close price is higher than the previous close
during 2 days and the meaning of 9-days Stochastic Slow Oscillator is lower than 50.
The strategy sells at market, if close price is lower than the previous close price
during 2 days and the meaning of 9-days Stochastic Fast Oscillator is higher than 50.
Second strategy
This indicator gauges the magnitude of price and volume movement.
The indicator returns both positive and negative values where a
positive value means the market has moved up from yesterday's value
and a negative value means the market has moved down. A large positive
or large negative value indicates a large move in price and/or lighter
volume. A small positive or small negative value indicates a small move
in price and/or heavier volume.
A positive or negative numeric value. A positive value means the market
has moved up from yesterday's value, whereas, a negative value means the
market has moved down.
WARNING:
- For purpose educate only
- This script to change bars colors.

TITAN StrategyTitan Strategy it's a Volatility & price action indicator giving you the exact point of exit or stop or reversal
with 2 different lengths represent as 2-time frames to drive the trend and reversals during the bear market and the bull market
with one adjustable level of taking profit and one adjustable stop loss level.
Grate for swing trading and Bullrun recognition and scalp those short trade into the bear market
and there its 2 more timeframes or lengths for the short environments where titan will scalp short into the average true range
default settings are at 4% stop loss and 4% take profit
How to use :
Buy Signal: long condition
Sell Signal: Short condition
If you like to know how to apply to the service please send me a private msg
we have a full pdf guide that comes with indicator its will be provided to you for mentoring propose
thx for your time and support

Combo Strategy 123 Reversal & Ease of Movement (EOM) This is combo strategies for get a cumulative signal.
First strategy
This System was created from the Book "How I Tripled My Money In The
Futures Market" by Ulf Jensen, Page 183. This is reverse type of strategies.
The strategy buys at market, if close price is higher than the previous close
during 2 days and the meaning of 9-days Stochastic Slow Oscillator is lower than 50.
The strategy sells at market, if close price is lower than the previous close price
during 2 days and the meaning of 9-days Stochastic Fast Oscillator is higher than 50.
Second strategy
This indicator gauges the magnitude of price and volume movement.
The indicator returns both positive and negative values where a
positive value means the market has moved up from yesterday's value
and a negative value means the market has moved down. A large positive
or large negative value indicates a large move in price and/or lighter
volume. A small positive or small negative value indicates a small move
in price and/or heavier volume.
A positive or negative numeric value. A positive value means the market
has moved up from yesterday's value, whereas, a negative value means the
market has moved down.
WARNING:
- For purpose educate only
- This script to change bars colors.

Ants BeastMode Die or Fly IndicatorCandle will be highlighted blue whenever a large move is about to happen

EMA Mean Reversionthis is a mean reversion strategy using ema std deviations
use flat scaling 5 orders buy and sell - just close it back when it hits the VWMA
strategy operates to make dozens of small profitable trades in exchange for a larger loss on rare trending moves.
It works by projecting five 0.5% std deviations from the ema as volatility bands to help you scale into shorts and longs. generally flat scaling will work better than ascending. there is no SL logic for the strategy - positions should be closed when prices crosses back through the VWMA . To be used on lower timeframes only as the bands to do not expand or contract according to ATR
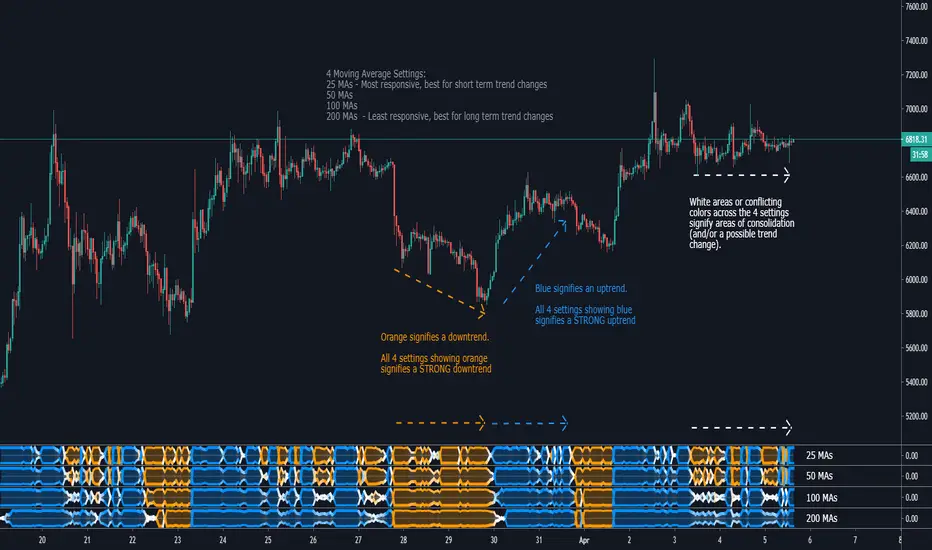
Life StrandA visual representation of 25, 50, 100, or 200 moving averages and their position relative to price action.
Reading this Indicator:
Blue represents that the majority of MAs are below price action, indicating a bullish trend. The wider the Strand, the stronger the trend. All 4 Settings showing blue indicate a strong bullish trend.
Orange represents that the majority of MAs are above price action, indicating a bearish trend. The wider the Strand, the stronger the trend. All 4 Settings showing orange indicate a strong bearish trend.
White areas signify some MAs are above while others are below price action, indicating periods of consolidation or trend change.
The 25 MA setting is most responsive to PA and shows change of trends quickly. The 200 MA setting is the least responsive but gives a solid look at the long term trend and ignores the ups and downs in a longer trend.
Currently Supported MAs:
Simple Moving Average (SMA)
Exponential Moving Average (EMA)
RSI Moving Average (RMA)
Weighted Moving Average (WMA)
Volume Weighted Moving Average (VWMA)
Jurik Moving Average (JMA)
Trading Strategy:
I prefer to have all 4 Life Strands open (25, 50, 100, 200) and look for confluence of all 4 for confirmation of PA direction. All 4 are orange for 2-4 candles, strong indication of bearish movement. Same can be said for blue. When the 4 settings have conflicting colors (ie 2 are blue, 2 are orange), that PA becomes a no trade zone for me. Confirmation is key, as is with any indicator.
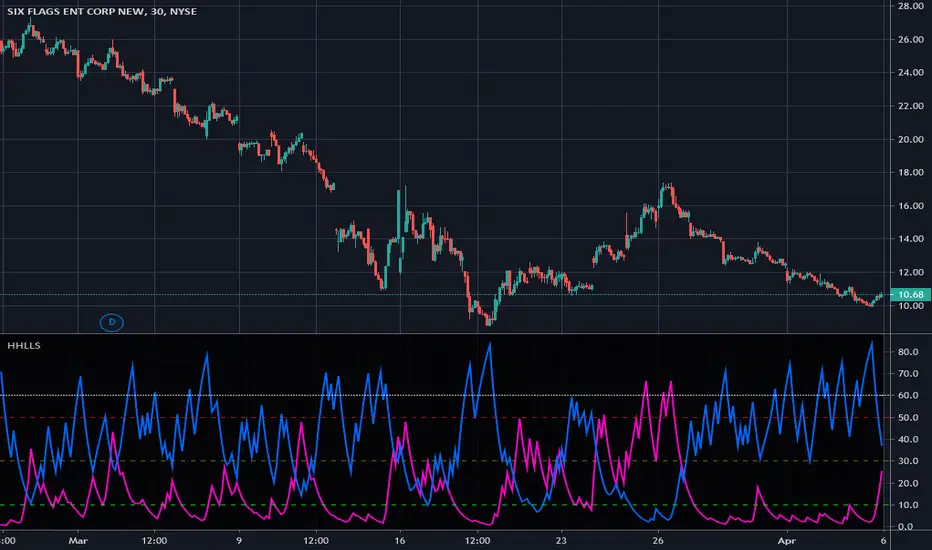
Higher Highs & Lower Lows Stochastics - Vitali ApirineThis is my modified "Higher Highs & Lower Lows Stochastics" employing PSv4.0, originally formulated by Vitali Apirine for TASC - February 2016 Traders Tips. Reading through a TASC magazine of mine, behold, I found a little known indicator that I can't find anywhere on all of Tradingview. That was a tragedy I felt I had to resolve... This indicator is best described as a dual momentum indicator, being helpful with anticipating reversals, spotting emerging trends, and defining correction periods. I felt it worthy of justice to unveil this for all TV members to utilize and also learn from. It's uniqueness is beyond past due for the honor it deserves on Tradingview.
As always, I have included advanced Pine programming techniques that conform to proper "Pine Etiquette". For those of you who are newcomers to Pine Script, this code release may also help you comprehend the "Power of Pine" by employing advanced programming techniques while exhibiting code utilization in a most effective manner. This script's uniqueness displays that we can now override built-in Pine functions. Firstly, you may have noticed that I replaced ema(), sma(), highest(), and lowest(). If you weren't aware of this Pine capability, well, here is a prime example... Now you know! Just heed caution when doing so to ensure your replacement algorithms are 100% sound. Lastly, I also added an additional "Median" line where the companion stochastics seemingly appear to gravitate within a central zone.
NOTICE: You may have observed, there is highest(), lowest(), ema(), and sma() custom functions overwriting Pine built-ins, some of which are audaciously used in ternary. "IF" you are planning to use Pine Script v4.0 functions in ternary, be forewarned, they WILL NOT operate as expected in most scenarios. The reason why I legitimately used them here in ternary is because they are ONLY manually controlled by an input(). If these were dynamically controlled with bar-to-bar dynamic conditional logic, you would most certainly run into serious unexpected programming issues, potentially resulting in hours of frustrations and guaranteed loss of hair. That's my lesson for this release, so never ever forget this when utilizing the full potential of the "Power of Pine". For more information concerning these potential dilemmas, please consult "Execution of Pine functions and historical context inside function blocks" in the "Pine Script v4 User Manual".
Features List Includes:
Dark Background - Easily disabled in indicator Settings->Style for "Light" charts or with Pine commenting
AND much, much more... You have the source!
The comments section below is solely just for commenting and other remarks, ideas, compliments, etc... regarding only this indicator, not others. When available time provides itself, I will consider your inquiries, thoughts, and concepts presented below in the comments section, should you have any questions or comments regarding this indicator. When my indicators achieve more prevalent use by TV members, I may implement more ideas when they present themselves as worthy additions. As always, "Like" it if you simply just like it with a proper thumbs up, and also return to my scripts list occasionally for additional postings. Have a profitable future everyone!
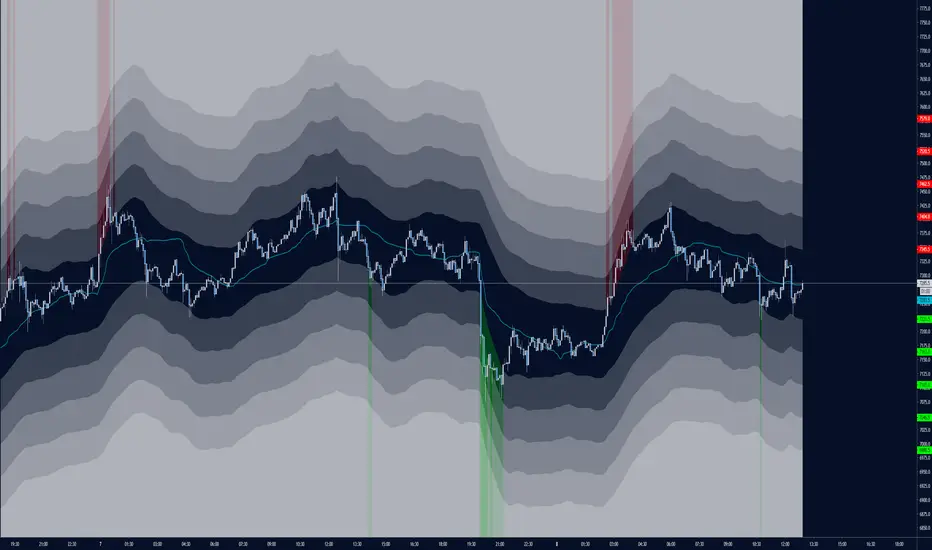
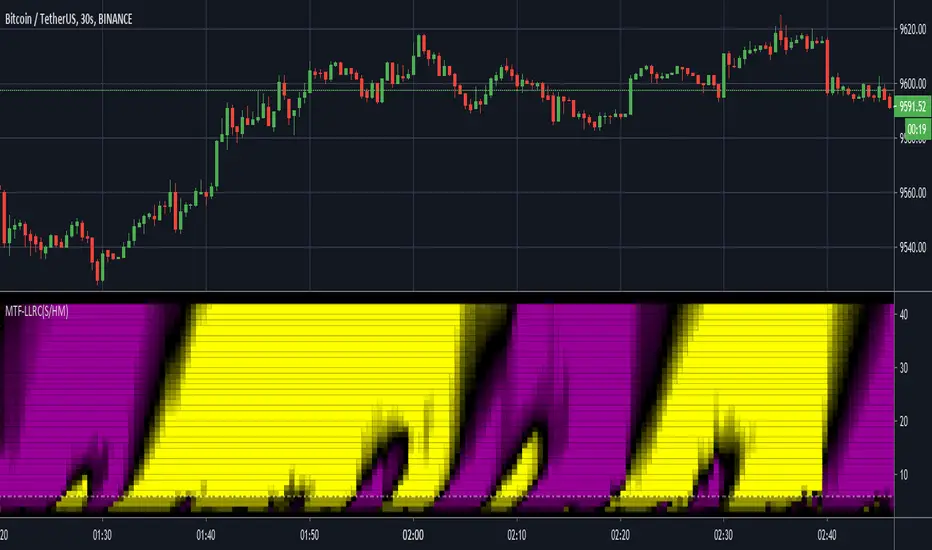
MTF Lag-Less RasterChart (Spectrogram/HeatMap)I present yet another state-of-the-art "MTF Lag-Less RasterChart" employing PSv4.0. Simply describing how this indicator works, the bottom of the indicator pane is most reactive and is highly effective at identifying reversal points quickly once they occur, while the upper portion of the indicator commonly shows enduring trends. This may be my finest multi-timeframe heatmap indicator that I have created so far, complete with multiple stunning gradient color schemes. I'm unsure if I will be able to pack any more tech into these RasterCharts. This may exclude additional algorithms or polychromatics I may discover later on that are worthy of other RasterChart releases. One last thing, this is a companion indicator to my "Lag-Less Rainbow Ribbon" indicator, because the heavily modified base algorithms are nearly identical.
I once again would like to personally thank Dr . John Ehlers for inspiring me to ponder into the realm of heatmap technology and all it has to offer. Your mathemagical splendor is most appreciated! You're a divine inspiration to the algorithmic trading community and forever shall be.
The MTF capabilities include seconds, minutes, and days. If the time frame settings are shorter in time than the current sampling interval, a warning notification will be appropriately displayed. I included a horizontal rule to approximately gauge at what level you may wish to have before entering/exiting a trade upon identifying a trend change. This gizmo functions on all assets on time frames ranging from one second bars up to the "All" chart having monthly bars.
Lastly, I have included so many color scheming techniques that I couldn't demonstrate all of them above. This indicator has what I would term as enhanced "predator" vision. For those of you who have witnessed these movies, you may understand what I have built. This indicator additionally includes a color morphing control to perfectly adjust the gradients to your visual liking, on any time frame whether it be seconds or daily chart preferences. The use of this indicator is just like any of my other RasterCharts or heatmap indicators found on the internet, except it has the greatest versatility I have accomplished as of yet.
Features List Includes:
"Source" selection
MTF controls for seconds, minutes, and days
Adjustable horizontal rule to differentiate between more reactive aspects of turning point fluctuations in the lower portion of the chart (visible above)
Window aperture control
Adjustable heatmap brightness control
Visual color scheme techniques (a few of many are displayed above)
Color gradient morphing
Color inversion control
This is not a freely available indicator, FYI. To witness my Pine poetry in action, properly negotiated requests for unlimited access, per indicator, may ONLY be obtained by direct contact with me using TV's "Private Chats" or by "Message" hidden in my member name above. The comments section below is solely just for commenting and other remarks, ideas, compliments, etc... regarding only this indicator, not others. When available time provides itself, I will consider your inquiries, thoughts, and concepts presented below in the comments section, should you have any questions or comments regarding this indicator. When my indicators achieve more prevalent use by TV members, I may implement more ideas when they present themselves as worthy additions. As always, "Like" it if you simply just like it with a proper thumbs up, and also return to my scripts list occasionally for additional postings. Have a profitable future everyone!
Combo Backtest 123 Reversal & Dynamo This is combo strategies for get a cumulative signal.
First strategy
This System was created from the Book "How I Tripled My Money In The
Futures Market" by Ulf Jensen, Page 183. This is reverse type of strategies.
The strategy buys at market, if close price is higher than the previous close
during 2 days and the meaning of 9-days Stochastic Slow Oscillator is lower than 50.
The strategy sells at market, if close price is lower than the previous close price
during 2 days and the meaning of 9-days Stochastic Fast Oscillator is higher than 50.
Second strategy
In July 1996 Futures magazine, E. Marshall Wall introduces the
Dynamic Momentum Oscillator (Dynamo). Please refer to this article
for interpretation.
The Dynamo oscillator is a normalizing function which adjusts the
values of a standard oscillator for trendiness by taking the difference
between the value of the oscillator and a moving average of the oscillator
and then subtracting that value from the oscillator midpoint.
WARNING:
- For purpose educate only
- This script to change bars colors.
Combo Strategy 123 Reversal & DynamoThis is combo strategies for get a cumulative signal.
First strategy
This System was created from the Book "How I Tripled My Money In The
Futures Market" by Ulf Jensen, Page 183. This is reverse type of strategies.
The strategy buys at market, if close price is higher than the previous close
during 2 days and the meaning of 9-days Stochastic Slow Oscillator is lower than 50.
The strategy sells at market, if close price is lower than the previous close price
during 2 days and the meaning of 9-days Stochastic Fast Oscillator is higher than 50.
Second strategy
In July 1996 Futures magazine, E. Marshall Wall introduces the
Dynamic Momentum Oscillator (Dynamo). Please refer to this article
for interpretation.
The Dynamo oscillator is a normalizing function which adjusts the
values of a standard oscillator for trendiness by taking the difference
between the value of the oscillator and a moving average of the oscillator
and then subtracting that value from the oscillator midpoint.
WARNING:
- For purpose educate only
- This script to change bars colors.

Combo Strategy 123 Reversal & Dynamic Pivot Point This is combo strategies for get a cumulative signal.
First strategy
This System was created from the Book "How I Tripled My Money In The
Futures Market" by Ulf Jensen, Page 183. This is reverse type of strategies.
The strategy buys at market, if close price is higher than the previous close
during 2 days and the meaning of 9-days Stochastic Slow Oscillator is lower than 50.
The strategy sells at market, if close price is lower than the previous close price
during 2 days and the meaning of 9-days Stochastic Fast Oscillator is higher than 50.
Second strategy
This Pivot points is calculated on the current day.
Pivot points simply took the high, low, and closing price from the previous period and
divided by 3 to find the pivot. From this pivot, traders would then base their
calculations for three support, and three resistance levels. The calculation for the most
basic flavor of pivot points, known as ‘floor-trader pivots’, along with their support and
resistance levels.
WARNING:
- For purpose educate only
- This script to change bars colors.
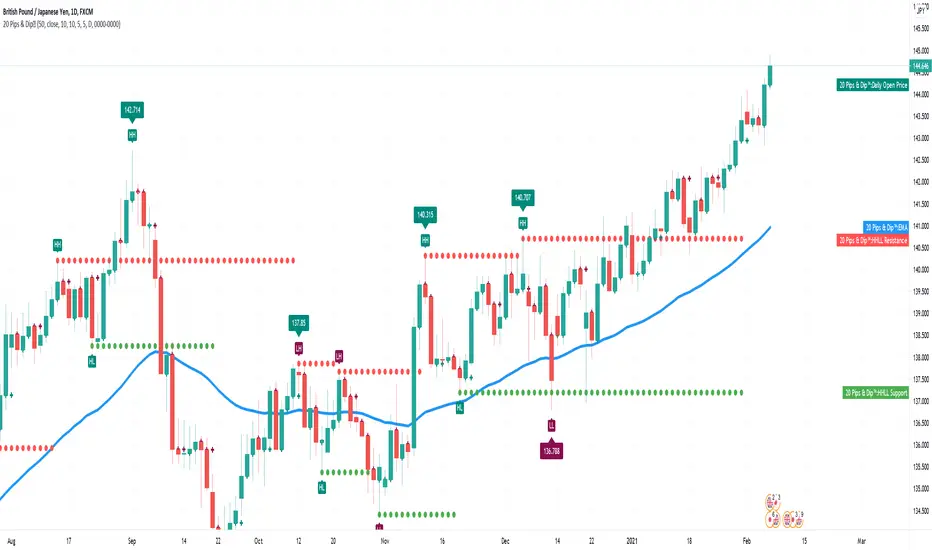
20 Pips & Dip™ Indicator20 Pips & Dipp script based on a few different indicators which together provides powerful help for all level of traders, especially beginners. Also, script have toggles to switch on/off: Renko Reversal, EMA, HHLL, Support/Resistance, Daily Open modules.
1st Module – Renko Reversal Alerts Indicator. The Indicator point out a spot where the revers are happens. Any changes in Price that do not reach a minimum amount are usually filtered. This helps to keep attention on larger, significant moves, and helps not to avoid the minute fluctuations in the market.
How it’s works?
- ENTER a trade JUST AFTER 1 Renko brick is printed. BUY triangle (green buy text with green triangle) is generated if a bearish Renko Brick is followed by a bullish brick. In other words, a buy signal happens when a white block is drawn after a black one. The buy happens then at the closing price that may be higher than the top of the last brick. It can go two bricks up minus a tick or pip.
- EXIT that trade, and open a new reverse position, just after 1 Renko brick is printed in the opposite direction. SELL triangle (red sell text with red triangle) is generated if a bullish brick is followed by a bearish brick. In other words, a sell signal happens when a black block is drawn, after a white block. The same situation as with a buy signal happens on sell signals. There is an uncertainty on the close price that may go as far as one tick above the next potential bearish block.
How to create custom ALERTS? Right click on a sell or buy triangle > Add Alert > 20 Pips & Dipp > Choose between Long or Short opportunity. In options field choose ONCE PER BAR. All other options you can choose according to your personal needs. If you want alert for another option (i.e. Short opportunity) just add one more.
Just to know! To understand how those module work better to switch to Renko chart. But Renko Chart with Renko brick size & Timeframe less than 1 day available only for PRO+ accounts and better. Also, we need to say that TradingView platform do not provide TICK data as we know. So, it may confuse you. Be careful!
2nd Module – Moving Average Exponential. The exponential moving average (EMA) is a weighted moving average (WMA) that gives more weighting, or importance, to recent price data than the simple moving average (SMA) does. The EMA responds more quickly to recent price changes than the SMA. The formula for calculating the EMA just involves using a multiplier and starting with the SMA. Like all moving averages, this technical indicator is used to produce buy and sell signals based on crossovers and divergences from the historical average. By default, our EMA have 50 period. The 50 moving average is the standard swing-trading moving average and very popular. Most traders use it to ride trends because it’s the ideal compromise between too short and too long term. Some people call it medium-term.
How to use it? EMAs are commonly used in conjunction with other indicators to confirm significant market moves and to gauge their validity. For traders who trade intraday and fast-moving markets, the EMA is more applicable. Quite often, traders use EMAs to determine a trading bias. For example, if an EMA on a daily chart shows a strong upward trend, an intraday trader’s strategy may be to trade only from the long side on an intraday chart.
Limitations of EMA! An EMA relies wholly on historical data. Many people believe that markets are efficient - that is, that current market prices already reflect all available information. If markets are indeed efficient, using historical data should tell us nothing about the future direction of asset prices.
3rd Module - Pivot Points (High/Low). Also known as Bar Count Reversals, are used to anticipate potential price reversals. Pivot Point Highs are determined by the number of bars with lower highs on either side of a Pivot Point High. Pivot Point Lows are determined by the number of bars with higher lows on either side of a Pivot Point Low. Default period is 10.
How this indicator works? The longer the trend (the higher the period selected) before and after the Pivot Point, the more significant the Pivot Point. Pivot Points can be used to help determine where to draw trendlines in order to visualize price patterns.
Calculation! Pivot Point Highs are determined by the number of bars with lower highs on either side of a Pivot Point High. Pivot Point Lows are determined by the number of bars with higher lows on either side of a Pivot Point Low.
4th Module - Higher High Lower Low indicator. Higher high and higher lows and Lower lows and lower highs are trends in a chart. Stocks in general never go up or down in linear fashion, every rise is followed by correction and then again it may either go up or down, same is true for downtrend every fall is followed by a correction in the upward direction and then new downtrend or uptrend is followed. After every rise, the stock took breather corrected to some extent and then new uptrend began, when you see the correction every low is higher than the previous lows and every next peak is higher than it’s previous peak. This is higher highs and higher lows trend.
How it’s work? This script finds pivot highs and pivot lows then calculates Higher Highs, Higher Lows & Lower Lows, Lower Highs. And it calculates support/resistance by using HH-HL-LL-LH points. Generally, HH and HL shows up-trend, LL and LH shows down-trend. If price breaks resistance levels it means the trend is up or if price breaks support level it means the trend is down, so the script can change bar colour blue or black by default. if there is up-trend then bar colour is blue, or if down-trend then bar colour is black. Support and resistance levels change dynamically.
Trick! If you use smaller numbers for Left Hand/Right Hand sides then it will be more sensitive!
5th Module - Daily Open Price. The opening price is the price at which a security first trades upon the opening of an exchange on a trading day; for example, the New York Stock Exchange (NYSE) opens at precisely 9:30 a.m. Eastern time. The price of the first trade for any listed stock is its daily opening price. The opening price is an important marker for that day's trading activity, particularly for those interested in measuring short-term results such as day traders.
Important! If daily open price was higher than current price, crosses will be red. And if daily open price lower than current price crosses will be green. Colours change dynamically.
You need to know it! An opening price is not identical to the previous day's closing price. There are several day-trading strategies based on the opening price of a market or security. Research “Gap Fade and Fill” or “Fade”.
Author – Christian Kopachelli . Huge thanks and credits to peoples which ideas, formulas, calculations, code snippets and code parts were used: Robert Nance, CryptoJoncis , FritzHaber , vacalo69 , Molle de Jong, Baris Yakut, LonesomeTheBlue , ChrisMoody , Robert N. ~~~ THANK you all! You are awesome!
DISCLAIMER! RISK WARNING!
PAST PERFORMANCE IS NOT NECESSARILY INDICATIVE OF FUTURE RESULTS. TRADERS SHOULD NOT BASE THEIR DECISION ON INVESTING IN ANY TRADING PROGRAM SOLELY ON THE PAST PERFORMANCE PRESENTED, ADDITIONALLY, IN MAKING AN INVESTMENT DECISION, TRADERS MUST ALSO RELY ON THEIR OWN EXAMINATION OF THE PERSON // OR ENTITY MAKING THE TRADING DECISIONS.
My VWAP Reversal + Pivot Points StandardThis indicator, with the addition of a standard VWAP indicator to the 5m chart, helps the operator when using a closing candle Price to initiate a VWAP Reversal strategy.
The strategy involves Price gapping up, look for a Close below the 1st 5m candle Low; else look for a Close above the 1st 5m candle High. On a break of VWAP, take the trade in the opposite direction of the gap, hence the VWAP Reversal. Not my own strat, credit to T3 Newsbeat, publicly posted on YouTube.
The Pivot Points Standard in the Pine 4 user manual, was the base source code, and leaving it here will allow me to remove the PP indicator I was using.

Combo Backtest 123 Reversal & Dynamic Momentum Index This is combo strategies for get a cumulative signal.
First strategy
This System was created from the Book "How I Tripled My Money In The
Futures Market" by Ulf Jensen, Page 183. This is reverse type of strategies.
The strategy buys at market, if close price is higher than the previous close
during 2 days and the meaning of 9-days Stochastic Slow Oscillator is lower than 50.
The strategy sells at market, if close price is lower than the previous close price
during 2 days and the meaning of 9-days Stochastic Fast Oscillator is higher than 50.
Second strategy
This indicator plots Dynamic Momentum Index indicator. The Dynamic Momentum
Index (DMI) was developed by Tushar Chande and Stanley Kroll. The indicator
is covered in detail in their book The New Technical Trader.
The DMI is identical to Welles Wilder`s Relative Strength Index except the
number of periods is variable rather than fixed. The variability of the time
periods used in the DMI is controlled by the recent volatility of prices.
The more volatile the prices, the more sensitive the DMI is to price changes.
In other words, the DMI will use more time periods during quiet markets, and
less during active markets. The maximum time periods the DMI can reach is 30
and the minimum is 3. This calculation method is similar to the Variable
Moving Average, also developed by Tushar Chande.
The advantage of using a variable length time period when calculating the RSI
is that it overcomes the negative effects of smoothing, which often obscure short-term moves.
The volatility index used in controlling the time periods in the DMI is based
on a calculation using a five period standard deviation and a ten period average
of the standard deviation.
WARNING:
- For purpose educate only
- This script to change bars colors.

Combo Strategy 123 Reversal & Dynamic Momentum Index This is combo strategies for get a cumulative signal.
First strategy
This System was created from the Book "How I Tripled My Money In The
Futures Market" by Ulf Jensen, Page 183. This is reverse type of strategies.
The strategy buys at market, if close price is higher than the previous close
during 2 days and the meaning of 9-days Stochastic Slow Oscillator is lower than 50.
The strategy sells at market, if close price is lower than the previous close price
during 2 days and the meaning of 9-days Stochastic Fast Oscillator is higher than 50.
Second strategy
This indicator plots Dynamic Momentum Index indicator. The Dynamic Momentum
Index (DMI) was developed by Tushar Chande and Stanley Kroll. The indicator
is covered in detail in their book The New Technical Trader.
The DMI is identical to Welles Wilder`s Relative Strength Index except the
number of periods is variable rather than fixed. The variability of the time
periods used in the DMI is controlled by the recent volatility of prices.
The more volatile the prices, the more sensitive the DMI is to price changes.
In other words, the DMI will use more time periods during quiet markets, and
less during active markets. The maximum time periods the DMI can reach is 30
and the minimum is 3. This calculation method is similar to the Variable
Moving Average, also developed by Tushar Chande.
The advantage of using a variable length time period when calculating the RSI
is that it overcomes the negative effects of smoothing, which often obscure short-term moves.
The volatility index used in controlling the time periods in the DMI is based
on a calculation using a five period standard deviation and a ten period average
of the standard deviation.
WARNING:
- For purpose educate only
- This script to change bars colors.

CuandoCrypto's Swing Trade IndicatorThis indicator combines RSI, MACD, Williams %R and Z-Score to determine if there's a high probability of an imminent trend reversal. This indicator is best used on higher timeframes.
Combo Backtest 123 Reversal & DSS Bressert This is combo strategies for get a cumulative signal.
First strategy
This System was created from the Book "How I Tripled My Money In The
Futures Market" by Ulf Jensen, Page 183. This is reverse type of strategies.
The strategy buys at market, if close price is higher than the previous close
during 2 days and the meaning of 9-days Stochastic Slow Oscillator is lower than 50.
The strategy sells at market, if close price is lower than the previous close price
during 2 days and the meaning of 9-days Stochastic Fast Oscillator is higher than 50.
Second strategy
Double Smoothed Stochastics (DSS) is designed by William Blaw.
It attempts to combine moving average methods with oscillator principles.
WARNING:
- For purpose educate only
- This script to change bars colors.

Combo Strategy 123 Reversal & DSS Bressert This is combo strategies for get a cumulative signal.
First strategy
This System was created from the Book "How I Tripled My Money In The
Futures Market" by Ulf Jensen, Page 183. This is reverse type of strategies.
The strategy buys at market, if close price is higher than the previous close
during 2 days and the meaning of 9-days Stochastic Slow Oscillator is lower than 50.
The strategy sells at market, if close price is lower than the previous close price
during 2 days and the meaning of 9-days Stochastic Fast Oscillator is higher than 50.
Second strategy
Double Smoothed Stochastics (DSS) is designed by William Blaw.
It attempts to combine moving average methods with oscillator principles.
WARNING:
- For purpose educate only
- This script to change bars colors.
Combo Backtest 123 Reversal & Donchian Channel Width This is combo strategies for get a cumulative signal.
First strategy
This System was created from the Book "How I Tripled My Money In The
Futures Market" by Ulf Jensen, Page 183. This is reverse type of strategies.
The strategy buys at market, if close price is higher than the previous close
during 2 days and the meaning of 9-days Stochastic Slow Oscillator is lower than 50.
The strategy sells at market, if close price is lower than the previous close price
during 2 days and the meaning of 9-days Stochastic Fast Oscillator is higher than 50.
Second strategy
The Donchian Channel was developed by Richard Donchian and it could be compared
to the Bollinger Bands. When it comes to volatility analysis, the Donchian Channel
Width was created in the same way as the Bollinger Bandwidth technical indicator was.
As was mentioned above the Donchian Channel Width is used in technical analysis to measure
volatility. Volatility is one of the most important parameters in technical analysis.
A price trend is not just about a price change. It is also about volume traded during this
price change and volatility of a this price change. When a technical analyst focuses his/her
attention solely on price analysis by ignoring volume and volatility, he/she only sees a part
of a complete picture only. This could lead to a situation when a trader may miss something and
lose money. Lets take a look at a simple example how volatility may help a trader:
Most of the price based technical indicators are lagging indicators.
When price moves on low volatility, it takes time for a price trend to change its direction and
it could be ok to have some lag in an indicator.
When price moves on high volatility, a price trend changes its direction faster and stronger.
An indicator's lag acceptable under low volatility could be financially suicidal now - Buy/Sell signals could be generated when it is already too late.
Another use of volatility - very popular one - it is to adapt a stop loss strategy to it:
Smaller stop-loss recommended in low volatility periods. If it is not done, a stop-loss could
be generated when it is too late.
Bigger stop-loss recommended in high volatility periods. If it is not done, a stop-loss could
be triggered too often and you may miss good trades.
WARNING:
- For purpose educate only
- This script to change bars colors.
