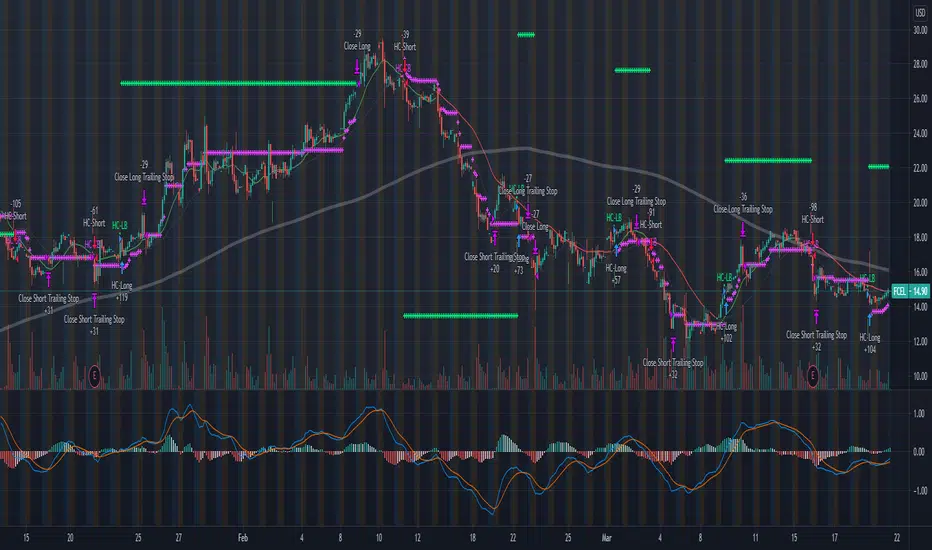
PivotThis library was designed to create three different datasets using Bill Williams fractals. The goal is to spot trends in reversal data and ultimately use these datasets to help predict future price reversals.
First, the pivot() function is used to initialize and populate three separate arrays (high pivot , low pivot , all pivots ). Since each high/low price depends on the bar_index, the bar_index, pivot direction(high/low), and high/low values are compressed into a string to maintain the data's integrity ("__"). Once each string array is populated and organized by bar_index, all three are returned inside a tuple. The return value must be deconstructed H,L,A =pivot() for each array's values to be accessed using getPivot() . This boilerplate allows for data to be accessed more efficiently in a recursive environment. getPivot() was designed to be used inside of a for or while block to populate matrices for further analyses. Again, getPivot() return values must be exposed through deconstruction. x,d,y =getPivot(). See code for more details.
pivot(int XLR) initializes and populates arrays
Parameters
XLR - number of bars to the left and right that must be lower for a high to be considered a pivotHigh, or vice versa. This number will drastically change the size and scope of the returned datasets. smaller values will produce much larger datasets, which might model short term price activity well. In contrast, larger values will produce smaller datasets which might model longer term price activity well.
Returns - tuple [string ]
getPivot(string arrayID, int index) accesses array data
Parameters
arrayID - the variable name for one of the three arrays returned by pivot().
index - the index of the provided array, with 0 being the most recent pivot point. can be set to " i " in a loop to access values recursively
Returns - tuple
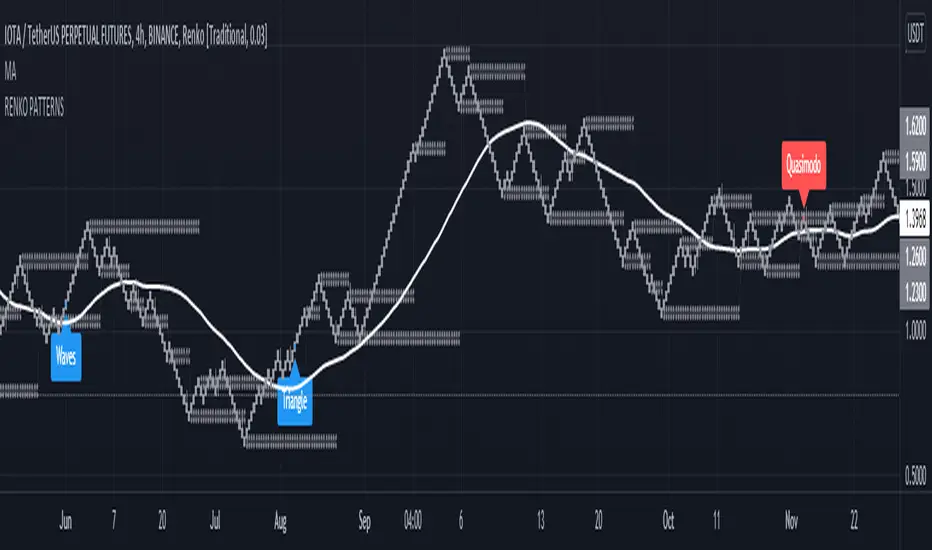
Reversalpattern

Head and Shoulders - Quasimodo etc Pattern Recognition RENKODisclaimer: Only use this pattern recognition on a RENKO chart. Renko charts plot different than traditional candles and therefore do not represent all price moves. There is a possibility of repainting while using ATR based renko charts so past results are not a 100% accurate representation of future results. Use this indicator as a part of your strategy and not as your only means of obtaining gains in the market.
Hello traders, it has been said time and time again that algorithmic software is unable to identify complex market structure like head and shoulders, quasimodo, triangle patterns and other methods humans use to base their trading decisions on. With this indicator I intend to completely crush that assumption and prove that it actualy is possible. Ofcourse an indicator is less likely to find all variation on a chart pattern and a human is probably still your best bet in finding these patterns early.
That is wy this indicator does not only use textbook patterns and has 7 variation on head and shoulders build into it. I will keep updating this indicator if I see it missed some crucial patterns. Right now it has a total of 38 patterns build into it with them being grouped under specific names. Feel free to turn off any pattern you do not like to see.
Renko patterns solve the problem of time and chaos in the markets which have been the biggest hurdle in pattern recognition software as the amount of variations to account for is just too great a number. With this script using renko it will soon be able to identify any pattern in the market and I plan to add Wyckoff to it in the future, right now I have a beta version of Wyckoff build into it but planning to add better version of it in the future. The amount of variations on Wyckoff is quite extreme so it will take a very long time to get an optimised Wyckoff identification system.
If you do not want to miss patterns I recommend to use a multi chart aproach so that you can find patterns in multiple renko brick sizes at the same time to find more entrys.
Feel free to comment any pattern you want me to add and let's make the most dedicated pattern recognition software on this platform.
Regards
HonestCowboy
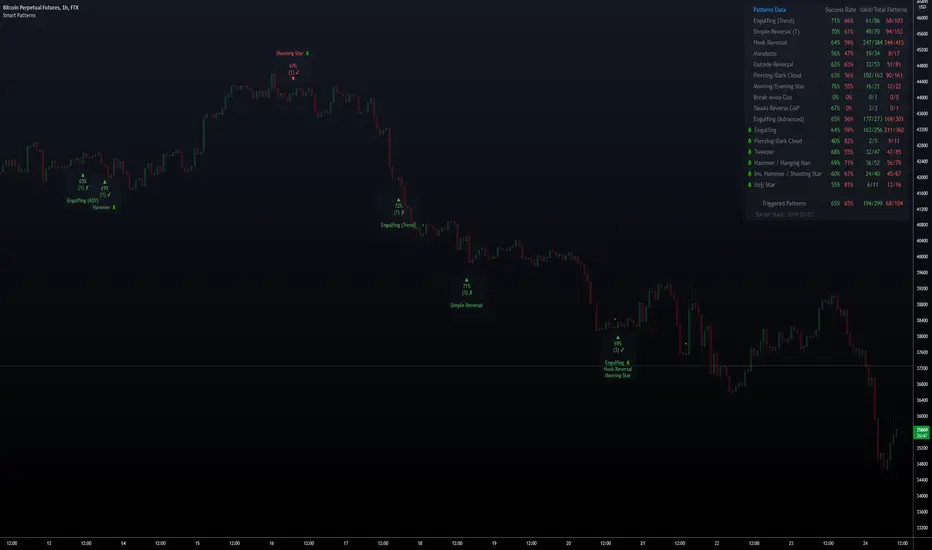
Smart PatternsHi Traders, and welcome to Smart Patterns.
Patterns can be very profitable, yet hard to trade, even when combined with other indicators and techniques. This script aims to increase the accuracy of signals by adding a statistical approach to candle patterns, along with tools to filter them.
For example, if the Success Rate is above a certain threshold, it means that the pattern has resulted in a higher ratio of profitable trades and hence it has a higher likelihood of succeeding in the current market conditions. However, should that pattern fall below the desired Success Rate, the script will "hide" it and won't trigger a signal, but still keeping track of its performance to start firing it again when coming back above the Success Rate.
Key Features
The script features custom patterns as well as some of TradingView's built-in patterns. Not all patterns can be added of course, but let me know if I missed other interesting ones and I will do my best to add them in future updates.
When a Pattern reaches the Min. Target % within the Candles Range selected, it is then considered valid. Please remember that doesn't take into account possible draw-downs or stop-losses.
Patterns are constantly evaluated inside the script; when a pattern's overall score (Success Rate %) is below the required minimum, the signal won't be triggered. However, the script will keep monitoring it in the background, and trigger a signal again when its score comes back above the minimum Success Rate.
The Patterns' signals can be filtered by Success Rate, Minimum Patterns detected and candle size (calculated via ATR).
The Data Panel will show individual statistics for Enabled Patterns as well as final statistics for Triggered Patterns.
Tooltips in the settings panel will further explain available options.
Alerts: simple alerts can be added by selecting "any alert() function call" when adding an Alert. Customizable alerts can also be created through dropdown menu ( Bullish \ Bearish Patterns Detected).
Fully customizable to adapt to light and dark themes
Notes and Recommendations
Always be realistic when tweaking settings, making sure the output makes sense in a normal trading environment. Statistics are helpful but shouldn't be the only factor to base your decisions on - even if a pattern reaches 100% Success Rate, it doesn't mean it will keep being profitable.
Since the script crunches quite some data it may give output errors especially if settings are not properly tweaked - or if the filters are too liberal (e.g. Min Target % set to 0.1) - hence triggering lots of signals. Please adjust the settings or enable only the Patterns you are trading.
If the script gives the error "Too many drawings, cannot clean oldest" it means your settings give too many signals and that is usually not a good sign - it's recommended to double-check your settings as mentioned above.
Credits
Trading View for built-in patterns
Special thanks go to PineCoders community for their incredible efforts and learning material to help mastering PineScript!
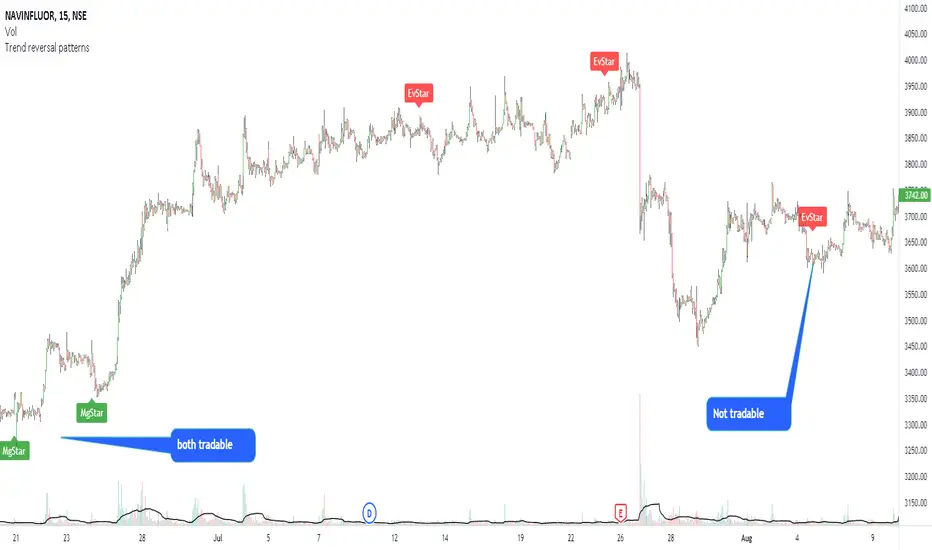
Modified morning and evening starsThis script highlights modified version of evening and morning star candlestick patterns. Volume has also been added in the script to create convergence of volume with price action.
It is recommended to use these patterns for positional trading. It is advised to use
Morning star at the bottom of the downtrend
Evening star at the top of the uptrend
Avoid entries against above recommendations
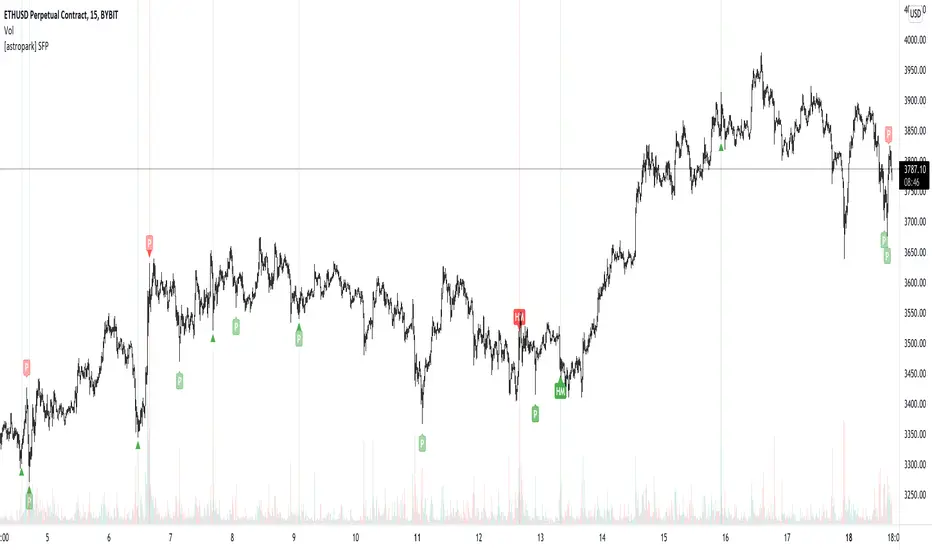
[astropark] SFP - Swing Failure PatternDear Followers,
today I'm glad to present you my Swing Failure Pattern Analyzer indicator.
As you know, the Swing Failure Pattern (SFP) is a very powerful candlestick pattern, because it highlights trend reversal points : if trend changes you want to know it, right?
This indicators highlights for you both Tops and Bottoms , that may be just local or historical.
To build this tool I mixed my experience on the field and some of the logic you can see in the following indicators of mine:
Pinbar that matters
Volume that matters
Volume Analyzer
This indicator works on every timeframe and market , it's quite responsive to market movements so it's especially good on volatile markets.
It is designed for fast day-trading / scalping , but as you trade on high timeframes is great for swing trades.
The indicator identifies candles that fall into the Swing Failure Patter category, but also candles other 4 categories of reversal candlestick pattern:
pinbar / hammer
hanged man
reversal by volume analysis
reversal by candle wicks analysis
Of course you can
customize colors
turn on or off what you prefer to see and what you don't
set alerts everything you see plotted
The indicator does NOT repaint of course.
This is a premium indicator , so send me a private message in order to get access to this script.
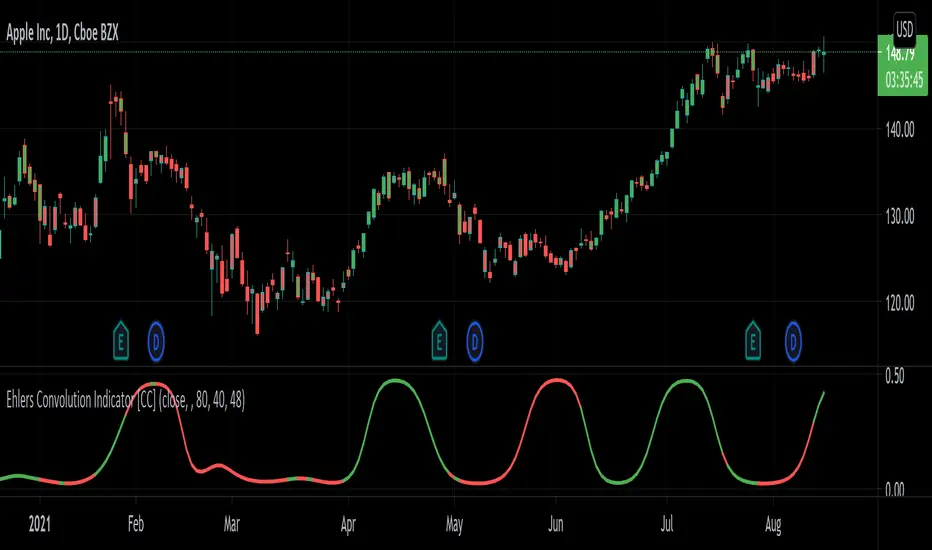
Ehlers Convolution Indicator [CC]The Convolution Indicator was created by John Ehlers (Cycle Analytics For Traders pgs 170-174) and this is version of an indicator to find potential reversal points. The idea behind this indicator is to use a variation of his AutoCorrelation Indicator that transforms the data using digital signal processing and as you can see it looks very similar to his BandPass Filter . The idea is that when this indicator peaks then it has reached a potential reversal point and so the stock may continue in the current direction but most of the time this indicator correctly points out the reversal points. I have included normal buy and sell signals but generally speaking you would want to buy when the indicator is around 0.05 to 0.10 and moving up and sell when it reaches its peak and is starting to move down.
Let me know if you have any other scripts you would like to see me publish!
Institutional OrderBlock Pressure█ OVERVIEW
OrderBlocks are areas where Banks take a Short or Long position. So they create a movement that they would like to hide from us, but luckily for us they cannot. Take the example of Banks opening Short position for x reason. The Trend is already Bearish. The Price will fall and then make a Reversal
(most often to the price where they opened their positions) and it is at this precise moment that they will again resume a Short position twice as
large because for the moment, following this example it is not in their interest that the Price exceeds a certain Price since they are Seller.
As a result they create a solid Resistance (the strongest it is). There are several ways to interpret this logic, we can try to follow the movement of Banks
or on the contrary take advantage of the recovery of the course. Note that not having level 2 and access to the order book from TradingView we can only
make a rough estimate of the "OrderBlocks" through VPOC.
█ HOW TO INTERPRET?
• The Labels displayed by "Red Arrow" and "Green Arrow" represent supposed Bearish or Bullish OrderBlock. Note that you should not in any way interpret these "Arrows" as Signals to Buy or Sell for the reasons mentioned above.
• The OB Line works according to detected OrderBlock Candle. These lines indicate the potential recovery area. (The highlighted lines and candles are white by default).
• It is better to use this indicator on Higher TimeFrame like 2H or 4H.
• You can change the Volume Ratio (here VPOC) which is 89 by default.
• There is a Customization section that allows you to change the colors of the Lines and Candles from White to Black depending on your background color (Light or Dark).
• YES the indicator is Repainting and YES you can have False Alerts since Labels appear in intra-bar!
█ ALERTS
• In fact we don't really need Alerts for the logic of this indicator except maybe to get the Price of the last OB Detected and to keep this price in your Alert History and may use it later. Some improvements will come in future with updates and we have already planned to add Alerts when a "Line Cross" gone occur.
If you notice any bugs or if you have any suggestions, don't be hateful gangs ;)
Happy trading everyone and remember, risk management is the most important!
Ultimate Momentum Indicator [CC]This is a custom indicator of mine loosely based on the work by Steve J Godwin & Louisa C Schneider (Stocks and Commodities Feb 2021 pg 22) and this works pretty well at anticipating future price swings as the momentum falls. The idea I was going for was to introduce the idea of reversals in combination with a momentum indicator so you can better identify peaks and valleys. I have included strong buy and signals in addition to normal ones so darker colors are the strong buy and sell signals and lighter colors are the normal ones. I would recommend to buy when the line turns green and sell when it turns red.
Let me know if there are any other indicators you would like me to publish!
QFLOW SUITE QFLOW SUITE is a signal-based comprehensive trading suite for trading across all timeframes. It is designed to be a tool for discretionary traders and there are numerous ways to utilize this trading suite.
INCLUDES :
Buy / Sell Signals
Candle Coloring
Automatic Level Plotting
Trend Following System
Stop Loss Management System
Trend Reversal Mechanisms
Volatility Breakout Algorithm
Mean Reversion Algorithm
Buy / Sell Signals
There are multiple conditions detected by QFLOW Algorithm which are constantly worked on and improved
Candle Coloring
Color coding allows information compression and helps traders analyze the charts in a simple and intuitive manner. The base coloring is meant for trend following and consists of 3 colors :
Green - Trend up
Grey - Rangebound Consolidation
Red - Trend down
The second type of candle coloring is for the special conditions like buy / sell signals or divergences.
Volatility Breakout Algorithm
This part of the algorithm identifies a volatility breakout before it happens by showing a colored shaded squeeze which happens during consolidation. When a potential breakout is detected, an arrow is printed below or above that candle depending on the direction. Most times a second arrow is needed to signal a confirmed breakout. This arrow will be plotted with a 'B' or 'S' in the same color as the arrow.
False Breakout Detection
The algorithm is taught to detect these kind of false breakouts and prints a signal as an arrow with an 'F' below or above the candle.
Mean Reversion Algorithm
A hybrid algorithm that takes both momentum and mean reversion into account for high accuracy.
Automatic Level Plotting
Stop Loss Management System
QFLOW SUITE contains an adaptive trailing ATR system that can be used for stop loss management. It is plotted as a line below the price when the trend is up and above the price when the trend is down. It is highly effective because it is designed to adapt both to the true range ( a measure of the degree of price volatility ) as well as to the average direction change.
Extreme Background Highlighting
The algorithm is taught to analyze multiple technical components. When this option is turned on it will highlight the background when these extreme conditions are met. These highlights will often occur at the tops or bottoms and during times of high volatility. A trader can use this option as extra confluence when making certain trading decisions like taking profits or closing out trades.

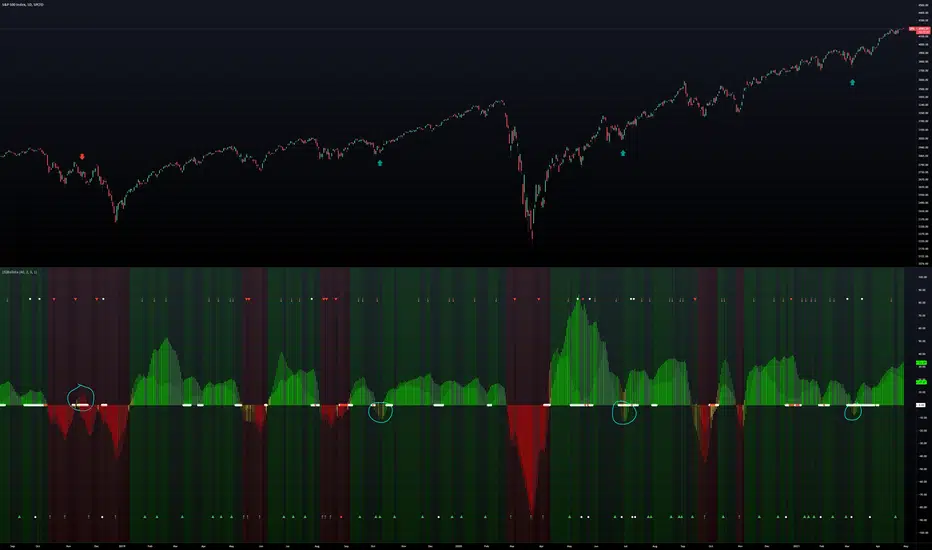
(JS) BallistaAlright so this is a script I made by combining two existing ones and making a really cool discovery that has proven very useful.
You'll notice that there are two separate oscillators that are laid on top of each other. The background oscillator is my "Tip-and-Dip" oscillator which you can see here (will refer to this as TnD from here), and the foreground oscillator from the Squeeze , which can be viewed here .
Initially I just wanted to see how they interacted with one another and compare them, but this led to some pretty interesting observations.
First let me go through the options real quick to get that out of the way, though it is mostly self-explanatory.
Lookback Period defines the amount of bars used for the TnD oscillator.
Smoothing Value smooths out the TnD output.
Standard Deviations is used to calculate the TnD formula.
Color Scheme is preset BG colors.
Using Dark Mode changes colors based on dark mode or not.
Squeeze Momentum On turns the Squeeze in the foreground off and on.
Arrows Off turns the arrows on the indicator off and on.
Now to explain the indicator a bit more. I have the default lookback period as 40 due to the Squeeze being 20, which makes the TnD oscillator the "slow" output with the Squeeze being the "fast" output.
Some initial observations were that when both the Squeeze and the TnD are moving in the direction, when the Squeeze is higher (uptrend) or lower (downtrend) it seems to indicate strength in the move. As the move loses steam you'll notice the Squeeze diverge from the TnD.
However, the most useful thing I discovered about the interaction between these two indicators is where the name for it came from. So if you aren't familiar with what a Ballista is, per Wikipedia, "The ballista... sometimes called bolt thrower, was an ancient missile weapon that launched either bolts or stones at a distant target." There are instances where the Squeeze seems to get ahead of itself and gets too far away from the TnD (which is the long term trend between the two). The key thing to look for is an "inverted squeeze" - this is when the squeeze oscillator ends up flipping against the TnD. When this occurs there is an extremely high probability that you'll see price shoot back the opposite way of the Squeeze.
I've been using this setup myself for about a year now and have been very satisfied with the results thusfar. I circled some examples on the SPX daily chart here to show you what I mean with the inverted Squeeze shooting back.
Breakout & Trend & Scalping (Zeiierman)█ Overview
Breakout & Trend & Scalping (Zeiierman) transforms time, volume, and trend behavior into a unified visual framework for identifying market expansion, compression, and breakout phases. Instead of viewing price as an isolated movement, the indicator reinterprets it as a continuous relationship between time-driven flow, volume displacement, and trend momentum.
The system constructs a hybrid analytical field using OBV-based flow modeling, time–trend alignment, and adaptive candle smoothing, providing a clear and fluid representation of both breakout probability and structural trend strength.
This advanced framework adapts to different market contexts, including intraday scalping, swing-trend validation, and multi-timeframe continuation analysis, revealing how volume and trend energy accumulate before volatility expansion.
⚪ Why This One Is Unique
Unlike conventional breakout or trend indicators that rely solely on price or volatility, this tool integrates time-weighted OBV mechanics, multi-timeframe trend correlation, and volatility-normalized candle transformation.
Its design leverages an adaptive Time–Trend Integration Engine that adjusts dynamically based on the selected timeframe and method. The result is a fluid, self-normalizing view of market rhythm, capturing not only the visible structure of trends but also the hidden buildup of momentum that precedes breakouts.
█ Main Feature: BTS Adaptive Candle System
The BTS Adaptive Candle System unifies time-based and trend-based flow analysis into a single visual model of market behavior. It synchronizes short-term momentum with long-term trend equilibrium, revealing how volume and directional energy evolve across different temporal structures.
The flow is inherently adaptive. During stable phases, it compresses volatility to emphasize directional persistence and trend continuity. When acceleration builds, it expands to highlight breakout potential and the ignition of new momentum.
Green-to-red and (red-to-green) transitions indicate shifts in order-flow dominance, while color intensity reflects the relative strength of participation. The built-in smoothing system filters out random noise while maintaining fast response to emerging direction, making the BTS Candle System equally effective for scalping precision, breakout confirmation, and long-term trend tracking.
█ How to Use
⚪ Trend Trading
Bullish trends appear when candles remain near the top of their range with bright, steady coloration. This structure shows sustained accumulation and consistent trend support. Fading color or mixed tones suggest short pauses or shallow pullbacks within an ongoing uptrend.
Bearish trends form when candles cluster near the lower range and deepen in red intensity, reflecting growing selling pressure. Consistent red sequences mark continued distribution, while lighter tones or brief color shifts often precede corrective bounces within a broader downtrend.
⚪ Trend Change Trading
When a large BTS candle crosses the midline, it often marks a decisive shift in market control. A strong candle breaking above the midline reflects dominant buying flow and the early phase of bullish momentum, often signaling the start of a new upward trend.
Conversely, when a large candle drops below the midline, it shows dominant selling pressure and the potential beginning of a downward cycle.
These midline transitions represent key moments where institutional flow changes direction. A rapid color shift or fading saturation in candles around these areas frequently precedes a trend reversal or volatility breakout, making them powerful confirmation points for both breakout and trend-change strategies.
⚪ Retracement/Pullback Trading
When BTS candles remain green or turn light yellow near the midline, it indicates balanced momentum as price consolidates during a temporary retracement. A renewed shift back to bright green candles from this area often signals the end of the pullback and the continuation of the uptrend.
In a downtrend, when BTS candles shift to light yellow or fade toward the midline, it shows a temporary slowdown in selling pressure as the price retraces upward. A return to deep red candles after this brief balance phase confirms renewed selling momentum and continuation of the prevailing downtrend.
⚪ Breakout Trading
Big candles in the BTS indicate a shift in control. If this occurs around a resistance level, there is a high chance that price will break out upward.
Similarly, if a large downward BTS candle appears near a support level, there is a high chance that a bearish breakout will follow through.
█ How It Works
⚪ Integrated Market Framework
The BTS system merges time, trend, and volatility behavior into a single adaptive flow field. It constantly balances fast and slow market components, maintaining a smooth equilibrium between short-term reactions and long-term structure.
Calculation: Uses normalized scaling and adaptive synchronization to align directional momentum across changing market states.
⚪ Core Trend Engine
At its center, the model interprets how price movement evolves within its volatility range. It tracks shifts in directional energy and transforms them into a stable momentum surface that highlights both trend continuation and turning points.
Calculation: Applies equilibrium-based mapping to sustain consistent directional flow even during market acceleration or compression.
⚪ Volatility Envelope System
The indicator forms a dynamic envelope around price movement, expanding and contracting with the current market speed. These zones reflect where energy concentrates or fades, helping visualize breakout potential and exhaustion levels.
Calculation: Adapts envelope boundaries through volatility-responsive scaling and balanced symmetry control.
⚪ Adaptive Time Modes
Two adaptive modes — Time and Trend — control how the model responds to changing conditions. The system automatically adjusts its responsiveness, allowing it to behave as a fast scalping model or a slow trend tracker without losing structural balance.
Calculation: Dynamically modifies its internal scaling to maintain equilibrium between speed and smoothness across selected timeframes.
-----------------
Disclaimer
The content provided in my scripts, indicators, ideas, algorithms, and systems is for educational and informational purposes only. It does not constitute financial advice, investment recommendations, or a solicitation to buy or sell any financial instruments. I will not accept liability for any loss or damage, including without limitation any loss of profit, which may arise directly or indirectly from the use of or reliance on such information.
All investments involve risk, and the past performance of a security, industry, sector, market, financial product, trading strategy, backtest, or individual's trading does not guarantee future results or returns. Investors are fully responsible for any investment decisions they make. Such decisions should be based solely on an evaluation of their financial circumstances, investment objectives, risk tolerance, and liquidity needs.
Skrip berbayar

KISS Strategy: SMA + EMA//Hello my fellow investors
//I am creating a simple non-cluttered strategy that uses 3(+1) simple means to determine: viability, entry, and exit
//1) Has a consistent trend been maintained for several days/weeks
//2) SH SMA crossover LG SMA = Bullish entry/LG SMA crossover SH SMA = Bearish entry
//3) Use the Slope factor & Weeks in Trend (WiT) to dertermine how strong of an entry signal you are comfortable with
//4) Exit position based on next SMA cross and trend reversal or stop loss%
//3+1) For added confidence in trend detection: Apply MACD check - buy--> MACD line above signal line and corssover below histogram \\ sell --> MACD line below signal line and crossover above histogram.
//*)This code also allows you to determine your desired backtesting date compliments of alanaster
The chart shown has:
Starting Capital: $10,000
Investment percent per trade: 1.5%
Stop Loss: 20%
Take Profit: 100%
RSI_OverValue with Engulfing candleThis script detects potential trend reverse and Buy or Sell spots.
It works with finding overvalued RSI and Engulfing candle after that and plotting "Buy" or "Sell" signal on price chart.
* Users can change RSI values easily from setting.
Enjoy

Trend & Contrarian (Expo)Trend & Contrarian (Expo) is a powerful trend tool with adaptive contrarian- signals. A strong trend is displayed by the background color and the unique Trend dots/line can be used to confirm a strong trend or to identify early trend reversals. The contrarian-signals are adapting dynamically to price moves and should be used as 'preparation' or 'warning' prior to trigger, should be confirmed by a trend reversals signal or by other indicators.
The contrarian signals should only be used if the user fully understands how they work, please test the feature before entering a trade based on it. However, these signals can be very valuable if used correctly.
Green background color ➞ Strong Positive Trend
Red background color ➞ Strong Negative Trend
No background color? ➞ No strong trend. The Trend Dots/line determine the trend
HOW TO USE
Identify strong trends
Identify trend reversals
Identify contrarian signals
INDICATOR IN ACTION
4-hour chart
I hope you find this indicator useful , and please comment or contact me if you like the script or have any questions/suggestions for future improvements. Thanks!
I will continually work on this indicator, so please share your experience and feedback as it will enable me to make even better improvements. Thanks to everyone that has already contacted me regarding my scripts. Your feedback is valuable for future developments!
-----------------
Disclaimer
Copyright by Zeiierman.
The information contained in my scripts/indicators/ideas does not constitute financial advice or a solicitation to buy or sell any securities of any type. I will not accept liability for any loss or damage, including without limitation any loss of profit, which may arise directly or indirectly from the use of or reliance on such information.
All investments involve risk, and the past performance of a security, industry, sector, market, financial product, trading strategy, or individual’s trading does not guarantee future results or returns. Investors are fully responsible for any investment decisions they make. Such decisions should be based solely on an evaluation of their financial circumstances, investment objectives, risk tolerance, and liquidity needs.
My scripts/indicators/strategies/ideas are only for educational purposes!
ACCESS THE INDICATOR
• Contact me on TradingView or use the links below

Reversal Algo (Zeiierman)█ Overview
Reversal Algo (Zeiierman) is an adaptive reversal and momentum detection system that helps identify hidden turning points, pressure zones, and changes in market direction. It brings together advanced modeling techniques such as dynamic volatility bands, adaptive trend tracking, and momentum-based confirmation signals into one clear, visual framework.
Unlike traditional reversal indicators that depend on static oscillators or fixed levels, this tool adapts in real time to market movement. It tracks volatility and directional flow to reveal when momentum is building, slowing down, or preparing to reverse.
Whether applied to short-term scalping, swing positioning, or macro structural validation, this tool provides an adaptive analytical environment that translates complex price dynamics into actionable context.
⚪ Why This One Is Unique
This version of Reversal Algo employs multi-domain adaptive modeling, combining envelope projection, trend inertia estimation, and contrarian equilibrium tracking within a single structure.
Its framework merges nonlinear smoothing manifolds with volatility-compensated directional phase mapping, allowing it to evolve with shifting market states rather than react to them.
Optional AI-driven optimizations enhance precision in unstable regimes by dynamically reshaping envelopes and tracking lines around localized flow curvature.
█ Main Features
⚪ Reversal Cloud
The Reversal Cloud highlights areas of potential expansion, compression, and turning points in price. It adapts to volatility by expanding when markets become unstable and tightening during periods of calm, creating a visual map of market rhythm and elasticity.
When the Cloud widens, it often signals exhaustion or increased turbulence; when it narrows, it suggests balance or an upcoming breakout.
With AI mode enabled, the Cloud automatically fine-tunes its shape to align with live price behavior, keeping its structure responsive and accurate.
⚪ Reversal Signals
Reversal Signals are designed to identify potential market turning points with precision. They combine multiple layers of price behavior—momentum shifts, directional changes, and balance-point deviations—to highlight areas where reversals are statistically more likely. To reduce false clusters, the system intelligently filters out repeated signals within a short time window.
⚪ Reversal/Exit Points
Reversal/Exit Points appear as small, color-coded dots above or below candles. They signal moments where price momentum slows or where the system detects a potential shift in directional strength. These markers are often found near short-term highs or lows, making them ideal for identifying profit-taking zones, re-entry setups, or early warnings of a possible reversal.
⚪ Trend Framework
The Trend Framework provides a clean visualization of the market’s prevailing direction. It smooths out short-term noise to reveal the core trend structure, showing when the market is expanding, contracting, or transitioning between phases.
This framework helps traders quickly see whether price action supports continuation or if the trend is weakening.
⚪ Trend Tracker Line
The Trend Tracker Line is a highly responsive trend detector that reacts quickly to shifts in momentum. It adapts dynamically to volatility, providing an accurate real-time view of directional acceleration and deceleration. This helps traders spot early changes in market tone and evaluate whether a move has the strength to continue.
When AI mode is enabled, the line automatically adjusts its sensitivity to remain stable and consistent across different market conditions.
⚪ Contrarian Bar Coloring
Contrarian Candle Coloring enhances chart readability by visually distinguishing strength from weakness. Green bars highlight areas of building upward momentum, while red bars point to potential pressure or exhaustion. The system continuously adapts its color transitions to reflect subtle momentum shifts, making it easier to recognize when the market is gaining or losing conviction.
An optional AI mode fine-tunes these transitions to match the current market rhythm, ensuring that candle coloration always reflects the underlying flow of strength and weakness.
█ How to Use
⚪ Reversal Trading
The primary purpose of the indicator is to identify reversal opportunities in the market. Reversal or contrarian trading means entering positions against the current directional move in anticipation of a fade or trend rotation. This approach often occurs in high-volatility environments, so it is important to widen your stops, reduce your initial position size, and, if appropriate, scale or average into positions carefully rather than committing all capital at once.
The Reversal Algo provides predefined Buy and Sell signals designed to highlight potential market peaks and troughs. While these signals are highly accurate, they are not meant to call every top or bottom perfectly. In a strong trending market, several reversal signals may appear consecutively before the market fully turns.
⚪ Reversal Signal + Candle Coloring
Combine Reversal Signals with Contrarian Candle Coloring for added confirmation. A practical approach is to wait for a Reversal Signal and then look for a color shift in the candles (for example, from contrarian-colored to standard candles). This color transition acts as confirmation that the active move may be losing strength and that a reversal could be underway.
⚪ Reversal Signals + Reversal Cloud
Consider taking reversal entries only when price interacts with the Reversal Cloud boundaries. The Cloud’s upper and lower layers act as dynamic resistance and support zones. When a Reversal Signal appears near or immediately after price rejection from one of these layers, it adds structural confirmation to the setup and strengthens the case for entry.
⚪ Reversal Signals + Key Levels
One of the most effective ways to trade Reversal Signals is by combining them with key price levels, such as the previous day’s high, low, or close. If price rejects one of these levels while a Reversal Signal prints simultaneously, the confluence of the two events serves as strong validation for a potential turning point.
⚪ Take Profit
The Reversal/Exit Points can function both as entry confirmations and as take-profit zones. If a Reversal Signal was missed but a new Reversal/Exit Point appears near a peak or trough, it can indicate a late-entry opportunity aligned with exhaustion behavior.
These dots are most powerful as profit-taking signals. Since they form near local highs and lows, they often mark regions of temporary imbalance where reversals are likely. When a Reversal/Exit Point forms in the opposite direction of your current position, consider taking partial profits or tightening stops to lock in gains while maintaining participation in the broader move.
█ How It Works
⚪ Reversal Cloud Engine
The Reversal Cloud defines the dynamic upper and lower boundaries of market elasticity by transforming recent price displacements into a smooth volatility field. Through multi-layered envelope modeling, it constructs a continuous topology of expansion and compression zones, revealing where directional energy accumulates or dissipates.
Calculation: Uses layered volatility envelopes that adapt to changing market speed and expansion. A built-in alignment mechanism keeps the upper and lower bands synchronized, while optional AI optimization adjusts the symmetry of the cloud based on short-term directional bias.
⚪ Trend Tracker System
The Trend Tracker isolates directional persistence by modeling angular displacement of price flow over adaptive temporal curvature. It interprets slope evolution as a continuously evolving directional vector field, capturing both acceleration and deceleration within the active regime.
Calculation: Applies adaptive slope modeling to estimate the dominant direction of price flow. The system smooths fluctuations dynamically while maintaining responsiveness to significant shifts in trend velocity. When AI mode is active, an intelligent weighting adjustment refines the tracker’s equilibrium bias for better phase synchronization.
⚪ Trend
The Trend module projects a dual-polarity directional lattice, distinguishing constructive (positive) and distributive (negative) flow environments. It defines equilibrium corridors that expand and contract with evolving trend geometry, offering visual feedback on regime strength and transition probability.
Calculation: Uses weighted directional regression to estimate upper, middle, and lower trend layers. Each structure is color-coded based on price slope and relative position, creating a continuous and easy-to-read trend map.
⚪ Contrarian Bar Coloring Engine
Contrarian bar coloring converts raw bar data into a slope-weighted momentum matrix, visually encoding thrust versus decay phases in real time. It acts as a microstructural interpreter of price inertia, identifying acceleration clusters and momentum fatigue through color transitions.
Calculation: Combines slope analysis and volatility normalization to evaluate how strong or weak each price bar is relative to its trend. The results are reflected in real-time color changes that emphasize momentum strength and fatigue.
⚪ Reversal/Exit System
Reversal and Exit Points are derived from an evolving volatility-based trail that tracks directional exhaustion and reversion potential. These markers visualize transitions in directional energy—helping traders anticipate trend slowdowns or reversal probabilities.
Calculation: Constructs an adaptive volatility trail that contracts as directional momentum weakens. A state-aware detection model identifies inflection points where pressure changes polarity, producing the plotted up/down dots that mark possible reversals or exits. This ensures that each signal dynamically reflects real-time shifts in market energy rather than static thresholds.
⚪ Reversal Signals Core
The Reversal System’s entry framework is designed for precision. It combines several layers of short-term momentum analysis into clear, directionally aligned signals. By balancing different market speeds and measuring how far the price moves from its equilibrium, it identifies high-probability areas where trends may continue or reverse.
Calculation: Implements a composite synchronization framework that aligns short-term momentum phases with equilibrium drift and directional bias. Redundant triggers are filtered out through temporal separation logic, ensuring only the most distinct and reliable signals are displayed. Adaptive thresholds adjust automatically based on volatility and trading mode, maintaining signal consistency across scalp, intraday, and swing environments.
⚪ AI-Adaptive Optimization Layer
The AI layer refines selected modules — Reversal Cloud, Trend Tracker, and Contrarian Candles — by continuously recalibrating their internal weighting curves according to volatility structure and price curvature. It acts as an intelligent stabilizer that adjusts smoothing depth, boundary stiffness, and gradient bias dynamically.
Calculation: Utilizes a Context-Aware Kernel Adjustment Engine, estimating curvature variance and phase imbalance to auto-tune envelope response. The model performs iterative self-alignment to preserve directional fidelity under rapidly changing flow dynamics.
-----------------
Disclaimer
The content provided in my scripts, indicators, ideas, algorithms, and systems is for educational and informational purposes only. It does not constitute financial advice, investment recommendations, or a solicitation to buy or sell any financial instruments. I will not accept liability for any loss or damage, including without limitation any loss of profit, which may arise directly or indirectly from the use of or reliance on such information.
All investments involve risk, and the past performance of a security, industry, sector, market, financial product, trading strategy, backtest, or individual's trading does not guarantee future results or returns. Investors are fully responsible for any investment decisions they make. Such decisions should be based solely on an evaluation of their financial circumstances, investment objectives, risk tolerance, and liquidity needs.
Skrip berbayar

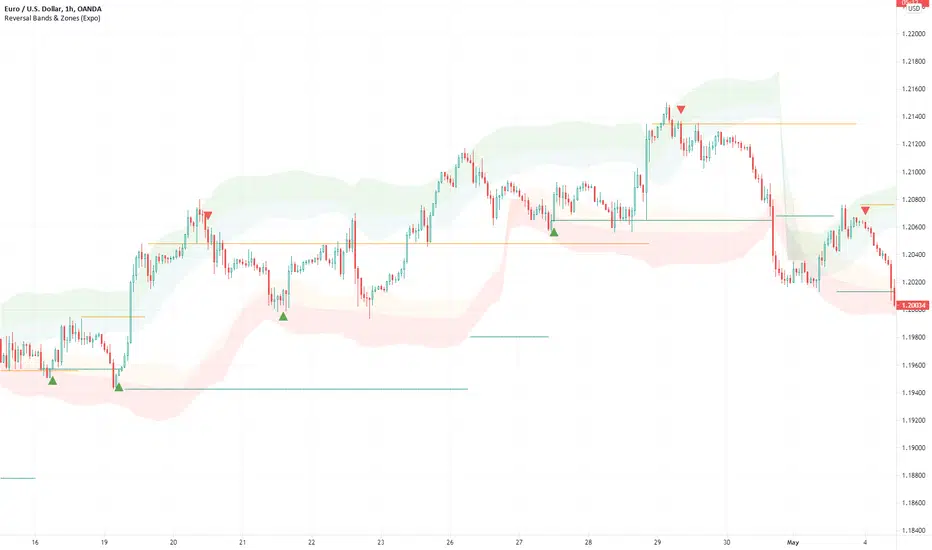
Reversal Bands & Zones (Expo) "It has never been easier to find high probability trades"
Reversal Bands & Zones (Expo) is an algorithm that analyzes the market in real-time and identifies reversal points, key market zones, and trends. The advanced and unique reversal bands act as support & resistance zones, and together with the trend tracking feature, it serves as a trend confirmation. The real-time market zones are displayed where there is a high probability of finding support/resistance. The algorithm does also map out key pivot levels based on the current market structure.
> Reversal points and key market zones have alerts.
Real-time
No repainting
Works on any market and in any timeframe
The indicator can be used standalone or as a part of your current trading strategy.
☖ Reversals
The algorithm identifies areas of potential turning points, these are displayed as Upper and Lower Reversal Cloud. When the price hits the cloud and bounces off there is a high probability that the price will reverse. If the price stays in the reversal cloud, there is a high probability that a trend is forming.
☖ Trends
Positive Trend: If the price is in or close to the upper green reversal band and above the trend- tracking line, we can be sure that the market is in a positive trend until the price crosses down from the reversal cloud and the trend tracking line.
NegativeTrend: If the price is in or close to the lower red reversal band and below the trend- tracking line, we can be sure that the market is in a negative trend until the price crosses up from the reversal cloud and the trend tracking line.
☖ Zones
"It hasn't been easier to display, in real-time, one of the most important and useful technical analysis, namely key support and resistance zones"
The algorithm analyzes the market structure in real-time and maps out key supply/resistance and demand/support zones. The user gets an instant understanding of the market structure. Support and resistance can be used to determine the range of a market, to trade reversals, bounces, or breakouts.
☖ Pivots
The indicator does also displays key pivot levels. Pivots can be used to determine the range of a market, to trade reversals, bounces, or breakouts.
HOW TO USE
- Use the indicator to identify reversals.
- Use the indicator to identify the range of the market.
- Use the indicator to identify key support/resistance zones.
- Use the indicator to identify trends.
INDICATOR IN ACTION
1-hour chart
I hope you find this indicator useful , and please comment or contact me if you like the script or have any questions/suggestions for future improvements. Thanks!
I will continually work on this indicator, so please share your experience and feedback as it will enable me to make even better improvements. Thanks to everyone that has already contacted me regarding my scripts. Your feedback is valuable for future developments!
-----------------
Disclaimer
Copyright by Zeiierman.
The information contained in my scripts/indicators/ideas does not constitute financial advice or a solicitation to buy or sell any securities of any type. I will not accept liability for any loss or damage, including without limitation any loss of profit, which may arise directly or indirectly from the use of or reliance on such information.
All investments involve risk, and the past performance of a security, industry, sector, market, financial product, trading strategy, or individual’s trading does not guarantee future results or returns. Investors are fully responsible for any investment decisions they make. Such decisions should be based solely on an evaluation of their financial circumstances, investment objectives, risk tolerance, and liquidity needs.
My scripts/indicators/ideas are only for educational purposes!
ACCESS THE INDICATOR
• Contact me on TradingView or use the links below
Ultimate Pattern Scanner ProChart Patterns and Harmonic Patterns using just ONE indicator!
This is a automatic scanner for well know patterns like Head and Shoulder to get started. I'm planning to add more patterns in the near future. It works as follows:
1. Is going to plot the pattern on the chart, lines in blue
2. Is going to show you when the pattern has finished to form, triangles and diamonds
3. It is possible to get an alert when the pattern has form
For example: is going to give a possible entry when the price has broken the trend line of the two shoulders if we take the Head and Shoulder pattern as an example.
Please let me know in the comments if you would like to have more patterns.
======================================================
This versions supports:
1. Head And Shoulder Pattern
- Show possible entries when the trend formed by the shoulders has been broken
2. Bat Harmonic Pattern
- Show Possible Reversals Zones in green or red boxes
- Alerts when any pattern has form
======================================================
======================================================
Next Versions:
- All the harmonic patterns
- Triangles
- Elliot Waves impulses
- Double Top and Bottom
- Triple top and bottom
- Rising and Falling Wedge
- The cup and the handle, etc
- ABCD pattern
Let me know in the comments if you are interested in something like this so I CAN GIVE YOU ACCESS. I'll appreciate your feedback.
thanks

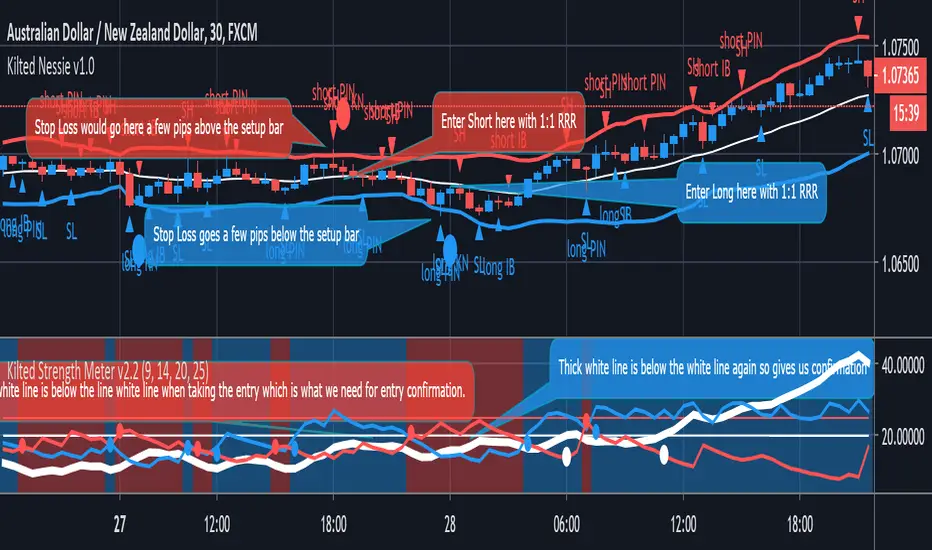
Kilted Nessie v1.0KILTED NESSIE v1.0
Description: Uses the “Kilted Strength Meter” for confirmation to take a trade as this system is designed for a ranging market (as shown).
This is a simple mechanical system that was tested on 30min charts with a very good win rate which is what we want from a mean reversion based system and it is designed for a 1:1 risk to reward ratio.
The key differentiator on this indicator which we see as a first on the Trading View Platform is a way of scoring your trade, so that you take a disciplined entry and able to journal that as evidence:
SETTINGS AND EXPLANATION
General Settings
- Show PinBars – This will highlight pinbars
- Show InsideBars – This will highlight inside bars
- Show Swing Highs – This will show high pivot points
- Show Swing Low – This will show low pivot points
1. If you are using the Kilted Strength Meter and you like using Bollinger bands then there is no reason why you can’t take trend based trades also when you see evidence of a trend starting, which is why we have added options to show Pin Bars, Inside Bars and swing highs and swing lows if you are a swing based trader. Yes this gives you a single indicator that provides you with trading opportunities when the market is going sideways and when the market is trending which is what we love about the Kilted Nessie. If you are just using the indicator to trade a sideways market then we recommend that you “untick” these options to keep things nice and simple instead.
ACCESS : If you need access to any of our indicators please use the link below to obtain access to this indicator or send us a private message on trading view.
HPRPThis is High Probability Reversal Pattern indicator. If there is B at candle then long the stock. If there is S at short the stock.
WaveTrend Momentum (Zeiierman)█ Overview
WaveTrend Momentum (Zeiierman) reveals the underlying rhythm of market movement through positive and negative momentum waves that visualize both sides of trend behavior. This dual-wave structure makes it easy to see how impulses and retracements interact in real time, helping you distinguish between a normal pullback within strength and the early signs of a trend losing momentum.
The indicator layers its waves with higher-timeframe trend alignment and adaptive context filters, mapping when momentum expands, when it fades, and where a pullback is approaching exhaustion or renewed trend strength is likely to emerge.
⚪ Why This One Is Unique
Unlike conventional wave oscillators, this design uses dual, phase-managed wave construction with adaptive scaling across symbols and timeframes. At its core is a three-mode Trend Strength engine (Adaptive, Stability, Structure) that dynamically adjusts to market conditions, supported by higher-timeframe regime sourcing and a dedicated impulse-and-divergence framework.
█ Main features
⚪ WaveTrend Momentum Waves
The foundation of the indicator lies in its ability to build positive and negative momentum waves that visualize both sides of market movement. This dual-wave structure makes it easy to identify trend direction, impulses, retracements, and exhaustion in real time, showing how momentum evolves within broader market phases. The waves can be used directly to gauge trend strength and direction, helping traders stay aligned with prevailing momentum or recognize when a shift is forming.
⚪ Extreme Moves
Extreme Zones highlight points where momentum reaches statistically stretched conditions, areas where price action often pauses, rebalances, or reverses. These zones help traders anticipate potential exhaustion before it becomes visible on price, improving timing for entries, exits, and scaling decisions.
⚪ Impulse Moves
Impulse Markers identify bursts of directional momentum, moments when trend energy expands sharply. These points often align with breakouts, accelerations, or continuation signals, helping traders focus on active opportunities rather than noise or consolidation.
⚪ Trend Strength
The Trend Strength Line adapts dynamically to shifting market regimes. It can operate in three modes: Adaptive, Stability, and Structure, each offering a different sensitivity level to trend changes. This feature helps confirm whether the trend is building, stabilizing, or losing strength, and serves as a foundation for bias filtering or trade direction confirmation.
⚪ Higher-Timeframe Trend Alignment
Integrates a higher-timeframe trend reference directly into the analysis, giving each wave context. This alignment clarifies when local pullbacks occur in harmony or conflict with the broader trend, making it easier to distinguish temporary corrections from true reversals.
⚪ Divergence Engine
A fully integrated divergence detection system that automatically spots both regular and hidden divergences between price and momentum. By surfacing early signs of trend weakening or continuation potential, it gives traders a structured way to detect subtle momentum shifts before they manifest in price.
█ How to Use
⚪ Trend Trading
WaveTrend Momentum excels as a trend-following framework by combining wave direction, Trend Strength, and higher-timeframe alignment to reveal when momentum is expanding or contracting within the broader market phase.
Note: To get trend waves, consider increasing the Wave Transition value to above 40.
Bullish WaveTrend Trend: When the positive momentum waves are above the neutral midpoint, the market is trending upward. Minor downward retracements within this structure often resolve back into trend continuation once buying pressure reasserts itself, particularly when the higher-timeframe context confirms a bullish regime.
Bearish WaveTrend Trend: When the negative wave dominates and remains below the midpoint, downside momentum controls the market. Minor upward retracements within this structure often resolve back into trend continuation once selling pressure reasserts itself, particularly when the higher-timeframe context confirms a bearish regime.
Bullish Trend Strength Line: A Trend Strength Line positioned above the midline indicates a bullish trend. A rising line reflects growing momentum and persistent buying pressure. The steeper the slope, the stronger the current regime. As long as the line continues to rise alongside positive waves, the trend remains structurally intact.
Bearish Trend Strength Line: A Trend Strength Line positioned below the midline indicates a bearish trend. A declining line reflects increasing selling pressure and persistent downside momentum. The steeper the slope, the stronger the current bearish regime. As long as the line continues to fall alongside negative waves, the trend remains structurally intact.
⚪ Momentum Trading
Momentum trading focuses on capturing the energy and force behind price movement, identifying whether the market is accelerating, losing steam, or preparing for a reversal. Momentum shifts can reveal temporary exhaustion, trend-strength continuation, or breakout acceleration before price action fully confirms it.
The indicator includes several features designed to detect and visualize momentum:
Waves: The core element of the indicator. The size and slope of the waves reflect the strength of momentum. Expanding waves indicate strong directional pressure, while contracting waves suggest cooling or consolidation.
Extreme Zones: When waves reach or exceed the extreme levels, the market enters statistically stretched conditions, signaling potential exhaustion or reversal zones. However, these events can also occur during strong trends, indicating continued strength in that direction. Market context is essential to determine whether an extreme should be interpreted as a reversal signal or as confirmation of trend momentum.
Impulse Markers: Highlight sudden bursts of momentum, often associated with breakouts or continuation events. Like Extreme Zones, Impulse Markers can appear within both reversals and strong trending phases. Context from price structure and higher timeframes helps identify whether the impulse reflects a trend-strength expansion or the final surge before exhaustion.
You can use any of these features to identify:
Breakouts: When Impulse or Extreme Markers align with expanding waves.
Reversals: When momentum reaches extreme levels followed by a fade in strength, it signals potential exhaustion before a structural shift. However, strong trends can also produce temporary fades that quickly recover, so context is key to distinguishing between true reversals and brief pauses within the trend.
⚪ Pullback Trading
Pullbacks represent short pauses or retracements within a prevailing trend. The combination of the Wave, Impulse Markers, and the Trend Strength Line helps identify when a pullback is maturing and when continuation is likely to resume.
Bullish WaveTrend and Trend Strength Pullback
In an uptrend, a brief dip in the negative wave, paired with a bullish Trend Strength, typically signals a healthy pullback rather than a reversal. When the negative wave begins to turn upward again, it confirms momentum recovery and potential for continuation.
Bearish WaveTrend and Trend Strength Pullback
In a downtrend, a short-lived rise in the positive wave while Trend Strength remains negative usually signals a counter-trend rally within weakness. As the positive wave fades and the negative wave expands again, downside continuation becomes more probable.
⚪ Divergence Trading
Divergence trading focuses on identifying moments when price and momentum move out of sync, signaling a potential shift in market direction or a slowdown in trend strength. These divergences often appear before reversals, consolidations, or major transitions in structure, making them a valuable early warning tool for traders.
The integrated Divergence Engine automatically detects these imbalances between price action and momentum. When price continues to move in one direction but momentum begins to fade, it suggests that the underlying strength driving the move is weakening.
█ How It Works
⚪ Wave Construction
The momentum wave is derived from phase-managed price smoothers, then normalized and bounded to express both positive and negative momentum within a single coherent structure.
Calculation: Composite moving frameworks with phase management, nonlinear rescaling, and amplitude companding to stabilize wave height and maintain consistent sensitivity.
⚪ Extremes
An auxiliary equilibrium tracker measures deviations from a dynamic mean to identify statistically stretched conditions in which momentum may begin to rebalance.
Calculation: Robust deviation mapping of a smoothed equilibrium series with adaptive thresholds for regime-consistent extremes.
⚪ Trend Strength Core
A tri-mode core measures directional persistence and adapts dynamically to changing market regimes, with optional higher-timeframe sourcing for context.
Calculation: Return-aggregated momentum with envelope gating (Adaptive), stability-biased curvature tracking (Stability), and structure-driven range midpoint logic (Structure).
⚪ Range & Regime Filter
A volatility-adjusted filter produces a smoothed state line and internal bias zones, allowing the indicator to contextualize momentum behavior within current volatility conditions.
Calculation: Volatility-normalized range synthesis with slow/fast quantization modes and optional smoothing to mitigate market chop.
⚪ Impulse Detection
Detects short-term bursts of directional energy and marks them as impulse events. These impulses highlight when momentum rapidly expands, often signaling breakouts, accelerations, or the end of low-volatility phases.
Calculation: Nonlinear impulse-response mapping that emphasizes higher-order rate changes while filtering out micro-noise.
⚪ Divergence Engine (Regular & Hidden)
Compares price swings against the wave’s momentum structure to identify early disagreement between price and internal strength.
Calculation: Swing-logic comparators analyze price relative to normalized wave amplitude to detect momentum shifts and potential divergence setups.
-----------------
Disclaimer
The content provided in my scripts, indicators, ideas, algorithms, and systems is for educational and informational purposes only. It does not constitute financial advice, investment recommendations, or a solicitation to buy or sell any financial instruments. I will not accept liability for any loss or damage, including without limitation any loss of profit, which may arise directly or indirectly from the use of or reliance on such information.
All investments involve risk, and the past performance of a security, industry, sector, market, financial product, trading strategy, backtest, or individual's trading does not guarantee future results or returns. Investors are fully responsible for any investment decisions they make. Such decisions should be based solely on an evaluation of their financial circumstances, investment objectives, risk tolerance, and liquidity needs.
Skrip berbayar

TakeOff Levels/Zones (Expo)TakeOff Levels/Zones (Expo) automatically identifies and displays support and resistance levels based on momentum.
Levels/Zones are displayed where there is a high probability that price can takeoff. Traders should look for breakouts from the Level/Zone.
If the price doesn't breakouts from the SR level/zone there's a chance that the market has topped or bottomed out.
The indicator can be used standalone or as a part of your current trading strategy.
Real-time
No repainting
Works on any market
HOW TO USE
1. Use the indicator to identify where the price can takeoff.
2. Use the indicator to identify potential breakouts.
3. Use the indicator to identify potential reversal points.
INDICATOR IN ACTION
1 min chart
I hope you find this indicator useful , and please comment or contact me if you like the script or have any questions/suggestions for future improvements. Thanks!
I will continually work on this indicator, so please share your experience and feedback as it will enable me to make even better improvements. Thanks to everyone that has already contacted me regarding my scripts. Your feedback is valuable for future developments!
ACCESS THE INDICATOR
• Contact me on TradingView or use the links below
-----------------
Disclaimer
Copyright by Zeiierman.
The information contained in my scripts/indicators/ideas does not constitute financial advice or a solicitation to buy or sell any securities of any type. I will not accept liability for any loss or damage, including without limitation any loss of profit, which may arise directly or indirectly from the use of or reliance on such information.
All investments involve risk, and the past performance of a security, industry, sector, market, financial product, trading strategy, or individual’s trading does not guarantee future results or returns. Investors are fully responsible for any investment decisions they make. Such decisions should be based solely on an evaluation of their financial circumstances, investment objectives, risk tolerance, and liquidity needs.
My scripts/indicators/ideas are only for educational purposes!
Volume Divergence by MMIt's a simply volume indicator. You should watch for breaks on both volume uptrend and volume downtrend. It uses fibonacci numbers to build smoothed moving average of volume.
Also you can check divergences for trend reversal and momentum loss.

HTF Candlestick Patterns [TradingView] vX by DGTCandlesticks are graphical representations of price movements for a given period of time. They are commonly formed by the opening, high, low, and closing prices of a financial instrument. They have their origins in the centuries-old Japanese rice trade and have made their way into modern day price charting.
It’s important to note that candlestick patterns aren’t necessarily a buy or sell signal by themselves. They are instead a way to look at market structure and a potential indication of an upcoming opportunity. It is always useful to look at candlestick patterns in context like any other market analysis tool and candlestick patterns are most useful when used in combination with other techniques. There are countless candlestick patterns that traders can use to identify areas of interest on a chart, where some candlestick patterns may provide insights into the balance between buyers and sellers, others may indicate a reversal, continuation, or indecision.
Reversal patterns are quite useful when used in context. Reversal patterns should form at the bottom of a downtrend or at the top of an uptrend. Otherwise, they are not a reversal patterns, but continuation patterns. Most reversal patterns require confirmation such as price move in the direction of reversal accompanied by appropriate trading volume. The reversal patterns can further be confirmed through other means of traditional technical analysis—like trend lines, momentum, oscillators, or volume indicators—to reaffirm buying or selling pressure. The patterns themselves do not guarantee that the trend will reverse. Investors should always confirm reversal by the subsequent price action before initiating a trade.
This study implements some of the most commonly used candlestick patterns in a context with directional movement indicator. On request users can adjust the strong trend threshold from dialog box, eighter can disabled correlation with directional movement indicator. To add additional sight to analysis the simple moving averages of 20, 50, 100 and 200 periods are added (configurable)
You may add additional indicators of your choice. Colored DMI, BB Cloud or Price Distance to its MAs may help
Enjoy it!
Disclaimer: The script is for informational and educational purposes only. Use of the script does not constitutes professional and/or financial advice. You alone the sole responsibility of evaluating the script output and risks associated with the use of the script. In exchange for using the script, you agree not to hold dgtrd tradingview user liable for any possible claim for damages arising from any decision you make based on use of the script
