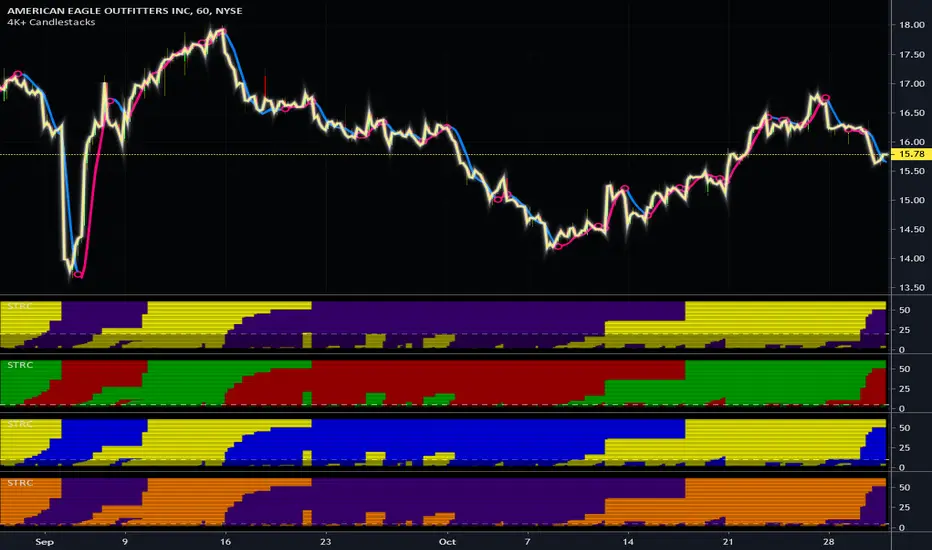
Fearzone & Greedzone Levels - Contrarian & Breakout (Expo)"Be fearful when others are greedy, and greedy when others are fearful" - Warren Buffett. Fearzone & Greedzone Levels - Contrarian & Breakout (Expo) is a contrarian and breakout indicator that gives us an indication when fear and greed begins to take over in the market. Traders should be prepared for increased volatility and good trading opportunities.
This indicator can both be used to identify potential reversal points and be used to identify breakouts from previous Fear and Greed Levels.
The Fearzone and Greedzone can be visualized with candlesticks or with circles depending on what you prefer.
Alert conditions are added.
HOW TO USE
1. Use the indicator to identify when investors are fearful and greedy.
2. Use the indicator to identify potential reversal points.
3. Use the indicator to identify potential breakouts.
INDICATOR IN ACTION
4 hour chart
4 hour chart
I hope you find this indicator useful , and please comment or contact me if you like the script or have any questions/suggestions for future improvements. Thanks!
I will continually work on this indicator, so please share your experience and feedback as it will enable me to make even better improvements. Thanks to everyone that has already contacted me regarding my scripts. Your feedback is valuable for future developments!
-----------------
Disclaimer
Copyright by Zeiierman.
The information contained in my scripts/indicators/ideas does not constitute financial advice or a solicitation to buy or sell any securities of any type. I will not accept liability for any loss or damage, including without limitation any loss of profit, which may arise directly or indirectly from the use of or reliance on such information.
All investments involve risk, and the past performance of a security, industry, sector, market, financial product, trading strategy, or individual’s trading does not guarantee future results or returns. Investors are fully responsible for any investment decisions they make. Such decisions should be based solely on an evaluation of their financial circumstances, investment objectives, risk tolerance, and liquidity needs.
My scripts/indicators/ideas are only for educational purposes!
Reversalpoint

GreedZone indicator - Contrarian Indicator"Be fearful when others are greedy, and greedy when others are fearful" - Warren Buffett. Greedzone is a contrarian indicator that gives us an indication when greed begins to take over in the market. Traders should be prepared for increased volatility and good trading opportunities.
The Greedzone is visualized with green candlesticks above the price.
HOW TO USE
1. Use the indicator to identify when investors are greedy.
2. Use the indicator to identify potential reversal points.
INDICATOR IN ACTION
1 hour chart
5 min chart
I hope you find this indicator useful , and please comment or contact me if you like the script or have any questions/suggestions for future improvements. Thanks!
I will continually work on this indicator, so please share your experience and feedback as it will enable me to make even better improvements. Thanks to everyone that has already contacted me regarding my scripts. Your feedback is valuable for future developments!
-----------------
Disclaimer
Copyright by Zeiierman.
The information contained in my scripts/indicators/ideas does not constitute financial advice or a solicitation to buy or sell any securities of any type. I will not accept liability for any loss or damage, including without limitation any loss of profit, which may arise directly or indirectly from the use of or reliance on such information.
All investments involve risk, and the past performance of a security, industry, sector, market, financial product, trading strategy, or individual’s trading does not guarantee future results or returns. Investors are fully responsible for any investment decisions they make. Such decisions should be based solely on an evaluation of their financial circumstances, investment objectives, risk tolerance, and liquidity needs.
My scripts/indicators/ideas are only for educational purposes!

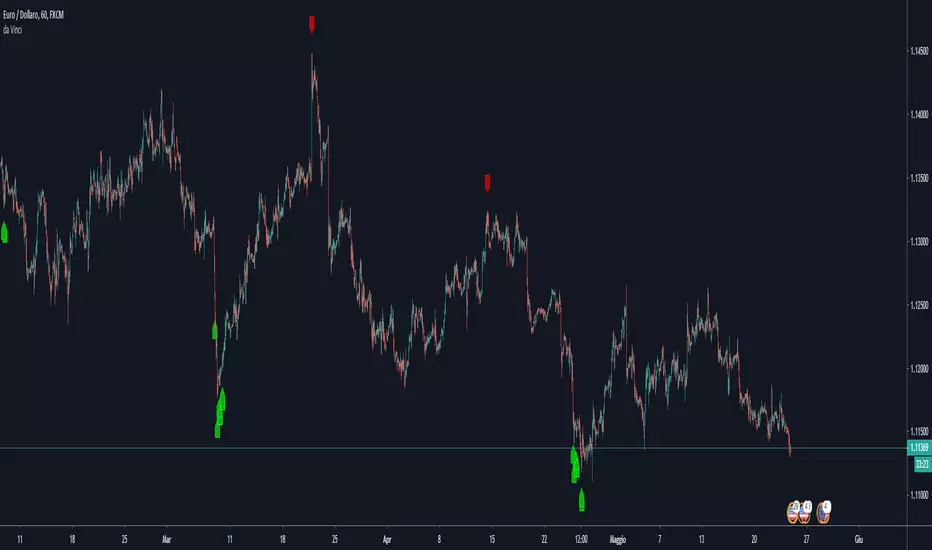
Fearzone (Expo) - Contrarian Indicator"Be fearful when others are greedy, and greedy when others are fearful" - Warren Buffett. Fearzone is a contrarian indicator that gives us an indication when fear begins to take over in the market. Traders should be prepared for increased volatility and good trading opportunities.
The Fearzone is visualized with red candlesticks below the price.
This version of the FearZone indicator is slightly different from the one ©kruskakli has published.
HOW TO USE
1. Use the indicator to identify when investors are fearful.
2. Use the indicator to identify potential reversal points.
INDICATOR IN ACTION
1 hour chart
5 min chart
I hope you find this indicator useful , and please comment or contact me if you like the script or have any questions/suggestions for future improvements. Thanks!
I will continually work on this indicator, so please share your experience and feedback as it will enable me to make even better improvements. Thanks to everyone that has already contacted me regarding my scripts. Your feedback is valuable for future developments!
-----------------
Disclaimer
Copyright by Zeiierman.
The information contained in my scripts/indicators/ideas does not constitute financial advice or a solicitation to buy or sell any securities of any type. I will not accept liability for any loss or damage, including without limitation any loss of profit, which may arise directly or indirectly from the use of or reliance on such information.
All investments involve risk, and the past performance of a security, industry, sector, market, financial product, trading strategy, or individual’s trading does not guarantee future results or returns. Investors are fully responsible for any investment decisions they make. Such decisions should be based solely on an evaluation of their financial circumstances, investment objectives, risk tolerance, and liquidity needs.
My scripts/indicators/ideas are only for educational purposes!

Market Sniper - Trading/Scalping SuiteWelcome to Market Sniper.
Market sniper is meant to be a suite for trading/scalping alongside my indicators script, RSI, Stochastic and Horizontals.
It is based on over 15 Indicators/Oscillators so there is no need for convoluted charts and constantly changing charts/indicators for a better understanding of the market.
Warnings:
I can't stress this enough! This isn't a magic pill that will transform your illiterate grandmother into an expert trader! This is a very powerful tool whose function is to complement your trading/save time (and yes, with practice be your main trading tool).
This algorithm requires setting up and training to be used correctly, please do not expect to load it up and immediately be scalping the 1s charts.
This algorithm is heavy and might require constant refreshes of the browser on slower computers.
Labels overlap at the moment, working on this part at the moment. So, always zoom in before doing a trade / change the "+- signals in settings"
Candlestick patterns need tweaking, I personally have it off and use my own judgement atm.
What it includes:
Trend reversal / continuation (Macd, Stochastics, money flow , CCI , momentum, DIOSC (automatic trendlines ), SuperTrend, Moving averages, etc, etc.)
RSI divergence drive / drive counter (base code from Libertus, check his profile as he has very helpful scripts)
Bull Market expansions for longterm take profit and increasing position
Candlestick patterns
Trend reversal / Continuation
Green = Bullish reversal
Red = Bearish trend reversal
Orange = Trend continuation / strengthening
Trend Continuation/Strengthening
A warning here, trend strengthening also means that many times the indicators are overextended or close to it
------
The numbers reflect the amount of indicators that are signaling a reversal over the specified period on the settings.
For higher timeframes this setting should be on a lower value and the opposite for lower timeframes.
This works on every market and every timeframe(according to months of my own paper and real trading). Remember that each market/asset/commodity has different soft spots so tweaking, backtesting and present accuracy review should be of maximum priority.
Bull Market expansion phase
Warning:
The indicator purposely does not show any signals during bear markets. It is my opinion bear markets complexity render this tool close to useless.
It was designed to be used in higher timeframes, tough it SEEMS to have a good track record / be useful in lower timeframes.
it will ALWAYS give a fake signal at the end of a bull market because of the very nature of the code.
It is based of EMAs, RSI and Stochastic
Candlestick Patterns
Bullish candlestick patterns:
Hammer
Inverted Hammer
Dragonfly
Gravestone
Bearish candlestick pattern:
Shooting Star
Hanging Man
Gravestone
Dragonfly
RSI divergence drive
- Credit to Libertus for the base code of this section
The green triangle means there are at least 2 drives of valid divergence, yellow for 3 and red for 4+.
The script shows triangles when confirmation candle closes.
You need to know how divergence works to use this section. investopedia can easily get you there.
For cryptos I use 2-4h+ timeframes, for traditional markets I use 15min+ for forex I use it basically in every timeframe.
For questions/suggestions and access PM me in the platform itself and don't forget -> FEEDBACK IS IMPORTANT
Thank you all

Extended Floor Trader PivotsThe Floor Trader Pivots indicator is a technical indicator that has long been used in the pits of exchanges. They define an equilibrium point called the primary pivot point or central pivot. Through much research, I can find no one to directly credit for establishing the original calculations which are used in this indicator. The original formulas calculate the primary pivot point (PP) and support/resistance levels based off the PP. Most pivot indicators only derive two support/resistance levels (R1, S1, R2, S2). This indicator provides the PP level as well as four additional support/resistance levels (R1-4, S1-4). This indicator also provides standard Open, High, Low, and Close levels. The calculations are as follows:
PP = (High + Low + Close) / 3
R1 = (PP * 2) - Low
S1 = (PP * 2) - High
R2 = (PP - S1) + R1
S2 = PP - (R1 - S1)
R3 = (PP - S2) + R1
S3 = PP - (R2 - S1)
R4 = (PP - S2) + R2
S4 = PP - (R2 - S2)
Pivot levels can be calculated for any time frame. This indicator provides Weekly, Monthly, Quarterly, and Yearly plots at each pivot level (PP - R4/S4).
This indicator can be used for a variety of different trading strategies and is widely used in equity markets, but can also be applied to Forex and Futures markets. It is most often used as profit taking/loss limiting levels as well as identifying possible areas for trend reversals.

Depth Multiple Time FrameThe price always returns to the average !!!
An important separation of the price with respect to an average, indicates a depth and generally generates a reversion or correction in the trend. Depth detection is a simple and very powerful technique, it is widely used for scalping and pyramid operations, this indicator detects depth in 7 time frames, everything is configurable independently, simultaneous detection of depth in several time frames increases The chances of success in the operation. I personally like pyramidization and it is one of the tools I use to detect depth to average the price of my operations.
thumbs up!!

Parametric Oscillator (Zeiierman)█ Overview
The Parametric Oscillator (Zeiierman) transforms price movement into a structure-aware momentum field, a flowing wave of oscillator-candles wrapped around a smooth Quick Price Action line. Instead of reading raw closes, it constructs a multi-lane view from open, high, low, and close data to capture how price pressure expands, contracts, and shifts through time. These relationships are then projected into a bounded oscillator domain, creating a dynamic visualization of momentum and market balance.
The oscillator-candles flip green or red to signal shifts in buying or selling strength, while the Quick Line tracks underlying momentum on a 0–100 scale. Together, they reveal where pressure is forming, how quickly it’s changing, and whether that change is sustainable, helping traders spot momentum swings, stretched zones, and directional bias across any timeframe.
⚪ What Makes It Unique
The oscillator’s uniqueness lies in how it constructs and interprets price structure. It builds four independent lanes of open, high, low, and close to measure wave relationships and capture micro-drift, wick aggression, and full price behavior rather than relying solely on closing data.
Beneath the surface, the oscillator runs on a balanced motion function that translates market volatility into a clear rhythm of momentum and structure. Each change in color and gradient reflects the balance between acceleration and stability, revealing the underlying pulse of market behavior.
█ Main features
⚪ Parametric Oscillator
The Parametric Oscillator turns market movement into a visual map of buying and selling pressure. Its oscillator-candles reveal how momentum builds, compresses, and releases, showing the balance between strength and exhaustion in real time. As candles shift color and gradient, traders can instantly read acceleration, fading energy, or volatility spikes, allowing for quick interpretation of trend health and potential reversals.
The display captures both immediate bursts of momentum and the underlying trend’s persistence, giving a continuous view of how pressure evolves across market phases. It can be used to spot areas of buildup before breakouts, early signs of compression before expansion, and the transition points where control shifts from buyers to sellers.
⚪ Quick Price Action
The Quick Price Action line provides a smooth, real-time read of market momentum that often shifts before price itself reacts. Acting as a leading momentum gauge, it highlights subtle changes in strength and direction, helping traders anticipate moves rather than chase them.
When the line begins to turn, it frequently does so well ahead of price, signaling acceleration, exhaustion, or an early phase of reversal. A rise toward higher levels reflects building bullish pressure, while a downturn from elevated zones shows fading strength or emerging sell bias.
It adapts smoothly across symbols and timeframes, the Quick Price Action line gives traders a consistent, early warning system and a clear visual cue of when momentum is starting to shift and where the next meaningful move may form.
█ How to Use
⚪ Trend Following
The Momentum Candle Line helps define the underlying directional bias by measuring the strength and persistence of momentum. When momentum holds above or below the midline (50), it reflects whether buyers or sellers maintain control of the trend. Watching how the candles form relative to that level helps identify continuation or potential shifts in direction.
Maintain a bullish bias when the Momentum Candles stay above 50 and candles form higher lows.
Maintain a bearish bias when they stay below 50 and candles form lower highs.
⚪ Detect Leading Momentum
The Quick Price Line helps identify leading momentum moves that often precede price action. These can signal the start of a new move in that direction or the early stages of a reversal.
When the Quick Line peaks above 80, it indicates strong positive momentum.
When it peaks below 30, it signals strong negative momentum.
By observing how the momentum candles behave around these levels, traders can determine whether the move is likely a continuation or a reversal.
⚪ Fading Price Moves
Momentum drives price to new highs and lows, but when that momentum fades, reversals often follow. The Quick Price Line or the Parametric Oscillator candles can reveal weakening momentum before price reacts, giving traders an early signal. When the Quick Line peaks and then begins to fade, it indicates that momentum is losing strength. This can precede a pause, a range, or a full reversal in price. Likewise, if the Parametric Oscillator starts to fade while price continues to move, it suggests that momentum is weakening and a reversal or pullback may be approaching.
█ How It Works
⚪ Dual-Lane Displacement
Price is decomposed into trend and fast components across the open, high, low, and close. These relationships form four signed streams that describe body drive and wick aggression.
Calculation: Builds relative spreads between the trend and fast components, creating a multi-dimensional price-flow state.
⚪ Parametric Mapping
Each data stream is passed through a parametric transform (defaulting to a momentum-sensitive map) and assembled into synthetic OHLC in oscillator space.
Calculation: Applies a state transform over the data, aggregates into oscillator OHLC, and exponentially smooths for stability.
⚪ Quick Price Action
A companion line extracts recent trend displacement, normalizes it in a rolling window around the local mid, and passes it through a smoothing process controlled by Price Trend (softness). This yields a stable 0–100 scale that reacts quickly yet remains consistent across assets and timeframes.
Calculation: Windowed normalization around a dynamic midpoint with adjustable softness to balance responsiveness and stability.
-----------------
Disclaimer
The content provided in my scripts, indicators, ideas, algorithms, and systems is for educational and informational purposes only. It does not constitute financial advice, investment recommendations, or a solicitation to buy or sell any financial instruments. I will not accept liability for any loss or damage, including without limitation any loss of profit, which may arise directly or indirectly from the use of or reliance on such information.
All investments involve risk, and the past performance of a security, industry, sector, market, financial product, trading strategy, backtest, or individual's trading does not guarantee future results or returns. Investors are fully responsible for any investment decisions they make. Such decisions should be based solely on an evaluation of their financial circumstances, investment objectives, risk tolerance, and liquidity needs.

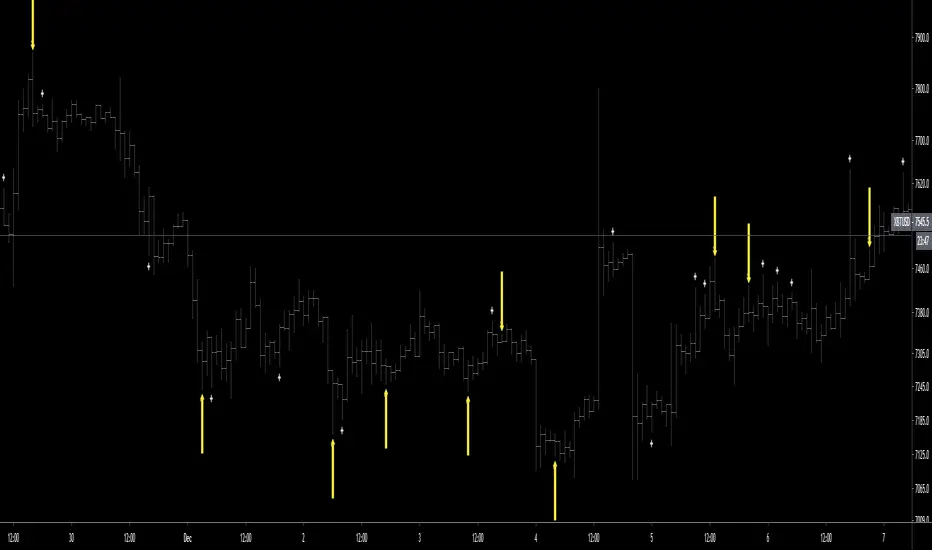
ChaosSN Reversal SignalsI calculated various metrics to measure exhaustion and mean diversion to plot arrows for a likely reversal point.
Use the input window to tailor the sensitivity of the arrows based on the amount of volatility your chart is experiencing (lower = more sensistive). The most common inputs for me are 8, 13, 21.
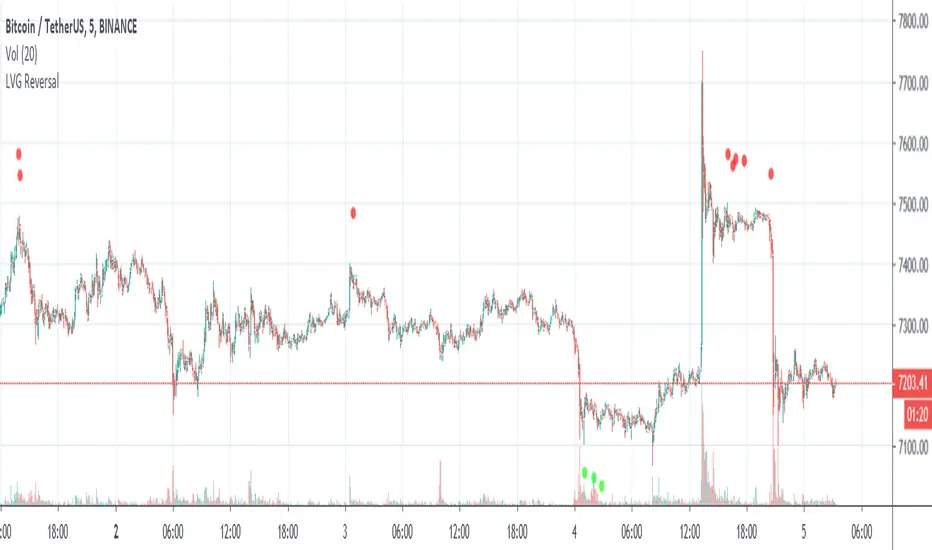
LVG Reversal IndicatorLVG Reversal Indicator:
-----------------------------------------
Shows potential reversal spots.
How to use:
-----------------------------------------
Works best on low time frames and markets that are trading sideways.
If a potential reversal has been reached it plots a green or a red dot under or above the candlestick .
Green dot = potential buy opportunity
Red dot = potential sell opportunity
If the signals get ignored the market is trending and a big reversal can be expected at the end.
The scripts plots the signals at the opening of the candle.
Does not repaint.
------------------------------------------
Please leave some feedback in the comments.
Use this indicator at your own risk.
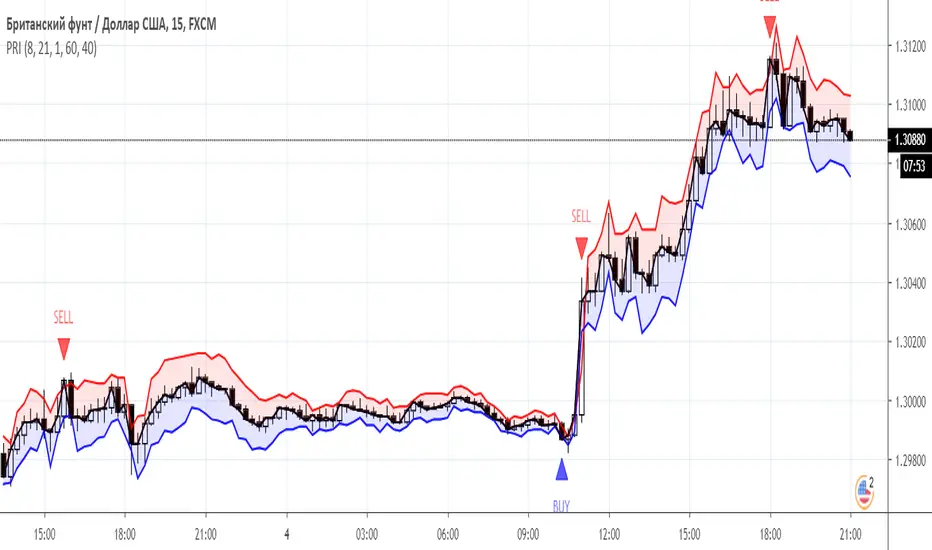
Price reversal intraday IndicatorIndicator “Price reversal intraday”
Class : oscillator
Trading type : scalping+intraday trading
Time frame : 15-30 min
Purpose : trading on rebounds and reversals
Level of aggressiveness : aggressive
“Price reversal intraday (PRI)” indicator is designed for aggressive intraday trading on rebounds and reversals. It belongs to oscillators. The idea that formed the basis for the creation of “Price reversal intraday (PRI)” is to obtain a synergistic effect from the use of the best oscillatory techniques: modified Bollinger bands and the classic RSI oscillator.
The indicator, using advanced Bollinger technique, monitors the deviation of the current price from the equilibrium value, and then with the help of the RSI oscillator it determines the moment when this deviation reaches a critical point. As a result, a buy or sell signal is generated, which is displayed on the chart in order to facilitate the trading process as much as possible.
Structure of the indicator
Indicator consists of the following elements:
- red zone – indication of a sell zone. Entry into this zone is a signal to close long positions and search for entry points to sell asset;
- red line – extremely high positive deviation of current price from its equilibrium value;
- blue zone - indication of a buy zone. Entry into this zone is a signal to close short positions and search for entry points to buy asset;
- blue line – extremely high negative deviation of current price from its equilibrium value.
Parameters of the indicator
To configure the indicator, the following parameters are provided:
- RSI_period (default value is 8) - period for calculating the RSI oscillator.
- Ranger_period (default value - 21) - period for calculating the modified Bollinger bands.
- Ranger_width (default value - 1) - the parameter used to control the level of aggressiveness of the indicator and frequency of signals. The lower it is, the more signals the indicator will generate. Possible values from 0 to 3.
- ob (the default value is 60) - this parameter defines the overbought zone for the RSI indicator.
- os (the default value is 40) - this parameter defines the oversold zone for the RSI indicator.
Rules of trading
The main task of the trader using indicator is to monitor the location of the current market price relative to the extreme zones (blue/red). Entering the red zone is a signal for closing long positions and searching for sell entry points. Entering the blue zone is a signal for closing short positions and searching for buy entry points.
The appearance of a blue triangle with the inscription “BUY” on the chart is a signal to open buy positions, and a red triangle with the inscription “SELL” is a signal for sale.
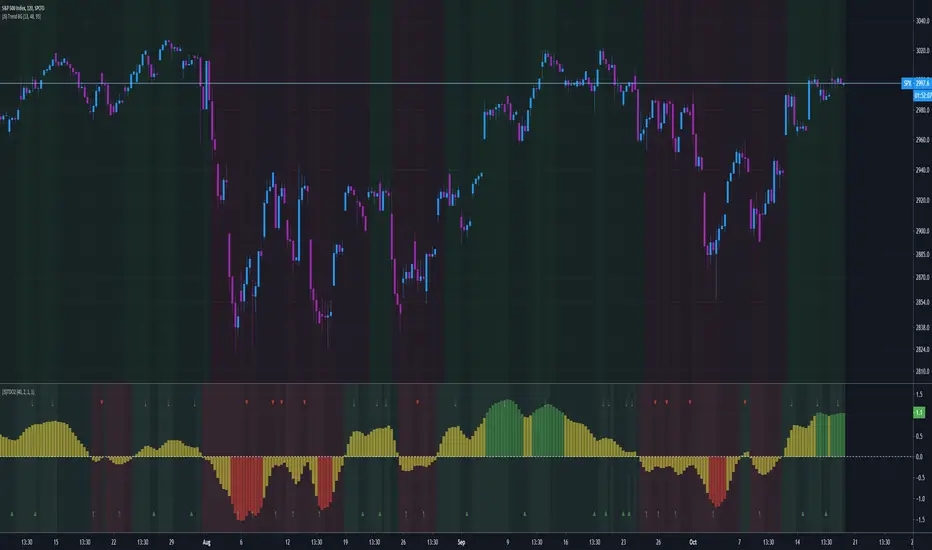
(JS)DMI BarsAlright - so this is my own version of John Carter's "10x Bars"... I have done multiple things that are different from his version so they are slightly different..
So first of all the main indicator is based off of the ADX and the DMI;
For those who aren't familiar with it, Directional Movement is what you'd pull up under "built-in's" from the indicators tab (if you want to check it out).
The standard interpretation of this however, is when the ADX is above 20 that suggests the trend is strong, whereas under 20 suggests it is weak.
Also, when the D+ is above the D- that suggests a bullish trend, and D- above D+ suggests a bearish trend.
These bars take away the need to have it at the bottom of your screen, and places the data on the bars on your chart instead.
=========================================================================================================================================
So here's what the colors stand for -
Yellow - The ADX is under 20, no strength in trend
Shades of green occur when the ADX is above 20 and there's a bullish trend (D+ higher than D-)
Bright Green (Lime) - Bullish trend, D+ above 30
Green - Bullish Trend
Yellow Green - Bullish trend, D+ below 15
Shades of red occur when the ADX is above 20 and there's a bearish trend (D- higher than D+)
Bright Red - Bearish trend, D- above 30
Red - Bearish Trend
Orange - Bearish trend, D- below 15
=========================================================================================================================================
I have also added multiple time frame labels (label script used is the one created by Ricardo Santos)
These labels are color coded the same as the bars/candles, and they appear off to the right of your screen using every built in time increment from TradingView.
The purpose is to show you in real time, and on any chart resolution, what the current trend is on every individual time frame.
So using just one single chart you'll see your current resolutions candles, but also on the labels you'll see:
1 Minute
3 Minute
5 Minute
15 Minute
30 Minute
45 Minute
1 Hour
2 Hour
3 Hour
4 Hour
Daily
Weekly
Monthly
There is an input I added that allows you to adjust where your labels appear on the side of your screen as well!
=========================================================================================================================================
Now onto the volume spike portion of the indicator. This will plot a blue dot under each bar that has a spike in volume which meets your specified criteria.
I have 500% as the default setting.
What that means is that this indicator looks back and gets the 50 bar volume average and then applies dots where volume is 500% above average.
=========================================================================================================================================
Now finally, the reversal arrows. This is another simple to understand concept that I first read in John Carter's book "Mastering the Trade" that he calls "HOLP/LOHP".
I have added the ability to change the look back period you'd like the indicator to watch for highs and lows on.
What that stands for is 'High of Low Period' and 'Low of High Period', and it is used like this-
Whenever a bar makes a new high the indicator watches the low on that highest bar. Then when a bar afterwards makes a lower low then the one on the high bar,
a reversal arrow is given. Apply this same concept in the other direction in for the highs on the lowest bars.
=========================================================================================================================================
Now, I didn't want to make a "set" or have a bunch of different indicators out there that are all intended for the same package, so I took the time to put them together,
and if there's a part of it you don't care for they can easily be turned off in the settings.
Enjoy!

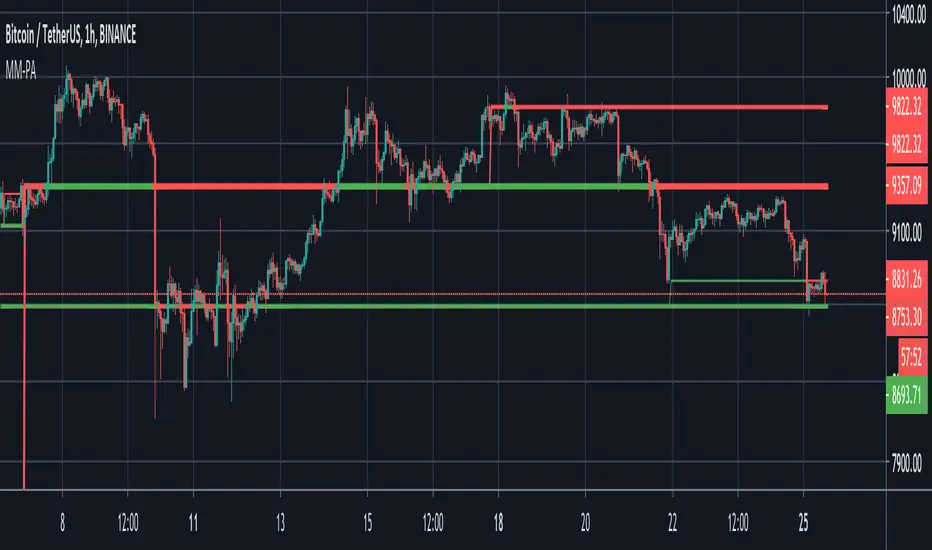
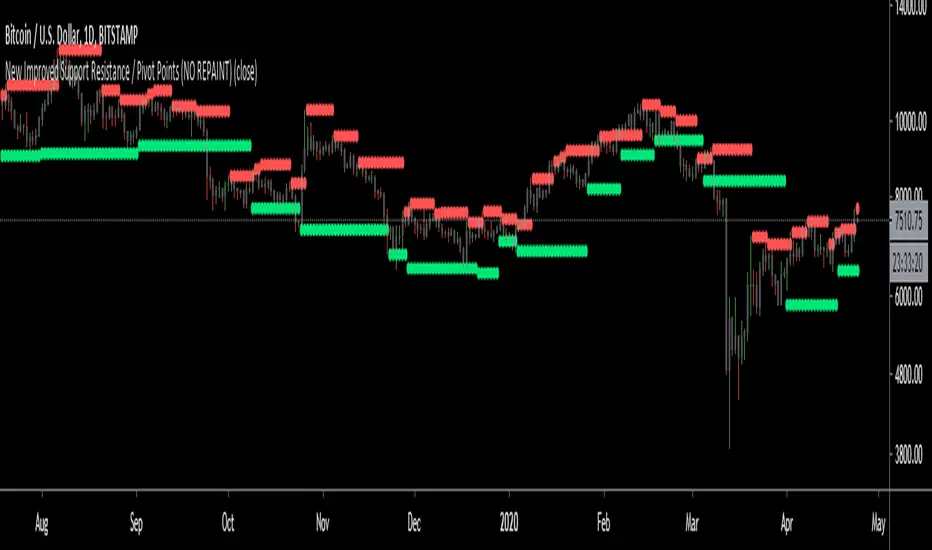
New Improved Support Resistance / Pivot Points (NO REPAINT)This indicator plots local pivot points / support resistance levels in real time (No Repaint). I created this indicator based on my own research and testing (i.e. it is not just a a Pinescript adaptation of some other indicator available online).
The Problem with Similar Indicators Which Are Currently Available On TradingView:
Inaccurate placement of swing/pivot/SR points (making your screen cluttered with meaningless levels).
Repainting (meaning the historical values change as new data becomes available; this is misleading and not very useful when trading in real time).
Have a long delay before confirming/plotting the new pivot points (20/20 hindsight...).
Require you to specify a lookback period and simply looks for the highest or lowest value over that time frame (which isn't very useful since it disregards all of the swings in between).
Do not show all of the historical swing levels, only the most recent ones.
My Solution:
Accurately places swing/pivot/SR points on local highs and lows once a short term trend is over (allowing you to easily identify reversal points).
Does not repaint (the historic values shown are exactly what would have been seen upon the close of the given candles in live trading; this means you can use this indicator for live trading).
Has minimal lag. New swing lows/highs are typically identified by this indicator on the candle which immediately following the swing point (this allows for better entries/exits rather than waiting for the price to run too far in the wrong direction before confirmation).
No lookback period required. The indicator will automatically identify new swings regardless how long the run lasts.
Allows you to adjust for more/less sensitivity.
P.S.: Future developments will be using these levels to create an automatic plot of fibonacci retracement levels.
Projection Oscillator - Mel Widner, Ph.D.For any Mel Widner, Ph.D fans out there, I present this decades old "Projection Oscillator" employing PSv4.0, originally formulated by Mel Widner for TASC - July of 1995 Traders Tips. Just when you may have thought it was the end of the evolutionary line for Mel Widner technology, it's not! Basically it's a hybridization of linear regression, banding, and a stochastic rolled into one. It's purpose is intended to help identify reversal points.
While working on another member's project, I discovered other implementations on TV and a few scarcely found on the internet, they are not entirely correct and not in a package like this. I'm submitting this as a complimentary indicator for their trading system AND also for the TV community for hybridized indicator evolution. My implementation is a heavily modified version of the original indicator using novel techniques, surpassing Widner's original intended design.
Utilizing the "Power of Pine", I included the maximum amount of features I could surmise in an ultra small yet impressive package. Configurations are displayed above in multiple scenarios that should be suitable for most traders. Of notable mention, the original design was a range from 0-100 just like any other stochastic, but I rescaled the oscillator more towards a zero mean unity scale(+/-1.0), while still leaving the waveforms completely intact.
Features List Includes:
Dark Background - Easily disabled in indicator Settings->Style for "Light" charts or with Pine commenting
AND much, much more... you have the source!
For those of you who are new to Pine Script, this script also may help you understand advanced programming techniques in Pine and how they may be utilized in a most effective manner. I would like to see Tradingview become the go to platform for the best indicators attainable with this contribution to the TV community. This is commonly what my dense intricate code looks like behind the veil. If you are wondering why there is no notes, that's because the notation is in the variable naming. If you wish to contribute additional ideas, please do so below in the comments about all things Pine in regards to this indicator.
NOTICE: Copy pasting bandits who may be having nefarious thoughts, DO NOT attempt this, because this may violate Tradingview's terms, conditions and/or house rules regarding publishing and "fair" reuse of code. "WE" are always watching the TV community vigilantly for mischievous behaviors and actions that exploit well intended authors for the purpose of unscrupulously increasing brownie points in reputation scores. Hiding behind a "protected" wall may not protect you from investigation and account penalization by TV staff. Be respectful, and don't just throw a meaningless feature in there, then branding it as "your" gizmo if you reuse this code for publishing another indicator. Fair enough? Alrighty then... I firmly believe in "innovating" future state-of-the-art indicators, and please contact me if you wish to do so.
The comments section below is solely just for commenting and other remarks, ideas, compliments, etc... regarding only this indicator, not others. When available time provides itself, I will consider your inquiries, thoughts, and concepts presented below in the comments section if you do have any questions or comments regarding this indicator. When my indicators achieve more prevalent use by TV members, I may implement more ideas when they present themselves as worthy additions. As always, "Like" it if you simply just like it with a proper thumbs up, and also return to my scripts list occasionally for additional postings. Have a profitable future everyone!
Simply Trendy RasterChartThis is my "Simply Trendy RasterChart" using PSv4.0 freely available to ALL! Simply Trendy, shown with the multiple color schemes on the bottom portion of the chart, is an indicator that differentiates with color between trending moments up and down, but is also effective at identifying trend reversals clearly. The bottom of the indicator is most reactive and indicates reversals, while the upper portion of the indicator commonly shows enduring trends. I included a horizontal rule to approximately gauge at what level you may wish to have before entering/exiting a trade upon identifying a trend change. This gizmo functions on all assets on time frames ranging from one second bars up to the "All" chart having monthly bars. Possible uses are quickly identifying assets that are not only opportunistic towards buying, but also selling/shorting when that time arrives later.
I decided to release this freely so members can become familiar with how my RasterCharts function. However, it may serve as another tool in the trend analysis tool belt you may want to have. It's the most basic of RasterCharts that I may have, and it gives the user an opportunity to witness/grasp RasterChart fundamental theory and operation in real time. Underneath the hood, the code is truly VERY SIMPLE also, hence the entitled name given. This was originally an experiment that turned out to be impressive, exceeding my expectations of attempting it. It's behavior is similarly close to my "TrendSetter RasterChart" and may serve as a trainer before acquiring that, any other RasterCharts I have currently, or shall create in the future. With that said, I hope you find this "simply" handy , and I'm also wishful for it to potentially garner a "trendy" reputation among the many members who may discover it.
I provided multiple color schemes for those of you who may have color blindness vision impairments. You may contact me in private if these color schemes are not suitable for your diagnosed visual impairment, and you would wish to contribute to seeing the color schemes improved along with other future indicators I shall release.
Features List Includes:
"Color Scheme" selection (all displayed above)
"RasterChart Transparency" control
"Source" selection
"Horizontal Rule" adjustment
The comments section below is solely just for commenting and other remarks, ideas, compliments, etc... regarding only this indicator, not others. When available time provides itself, I will consider your inquiries, thoughts, and concepts presented below in the comments section if you do have any questions or comments regarding this indicator. When my indicators achieve more prevalent use by TV members, I may implement more ideas when they present themselves as worthy additions. As always, "Like" it if you simply just like it with a proper thumbs up, and also return to my scripts list occasionally for additional postings. Have a profitable future everyone!
FUSIONGAPS V5Market bullish/bearish phase indicator , with trend-reversal and golden/death cross indicators.
This the re-implementation of my old script, now allowing the selection between different moving-averaging modes.
Note: In no way is this intended as a financial/investment/trading advice. You are responsible for your own investment decisions and/or trades.
~ JuniAiko
(=^~^=)v~

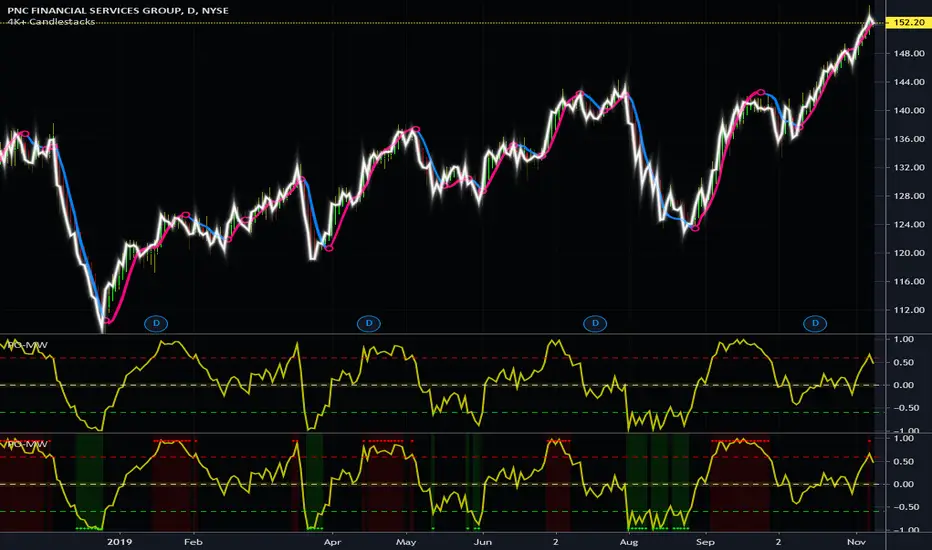
(JS) Tip-and-Dip Oscillator 2.0I am going to start taking requests to open source my indicators and this is the first one I decided to do. They will also be updated to Version 4 of Pinescript.
I went through and added notes on what each area of the code is, and in this particular case I added color schemes as a way to improve upon the original code.
Link to original:
Original Description:
"Let me start by saying I know that the name is goofy lol
This is an oscillator that that looks at price action vs. standard deviation in order to illustrate the trend. This thing looks like an Awesome Oscillator but the math behind this and the Awesome Oscillator are totally different (which is pretty interesting, given they look a lot alike). I included the Awesome Oscillator on the chart here so you can look at them and see where they are different.
So the Tip-and Dip Oscillator is meant to help you pinpoint tops and bottoms. I even added arrows where the top and bottom signals are given.
The oscillator itself has 3 colors, an up, down, and neutral color that come as green, red, and yellow. Since the readings given by the oscillator can greatly vary depending on the chart resolution, I included an option to edit the range to fit your chart.
Also - I have 4 different smoothing options that you can use depending on what your preference is. The default setting is the most sensitive so it will identify tops and bottoms more frequently, but it is the most accurate when pinpointing the correct reversal candle. As you smooth it out, the arrows will appear less, but my be slightly delayed and give a later reading. I personally prefer the default, but going up to the second setting in smoothing works nicely as well.
Enjoy!"
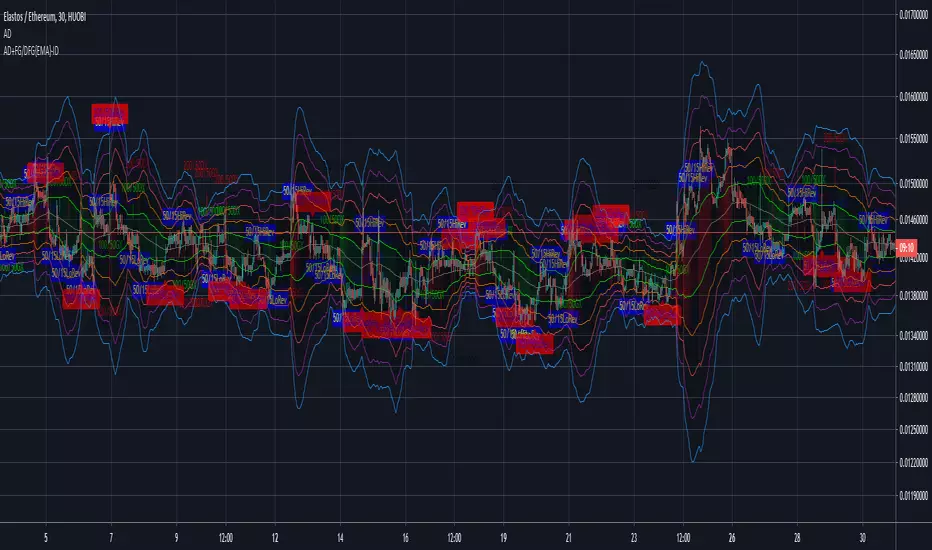
AEONDRIFT with FG & DFG {EMA} indicatorsAEONDRIFT with {EMA} implementation of FUSIONGAPS (FG) and DIFFERENTIAL FUSIONGAPS (DFG) derived indicators.
~JuniAiko
(=^~^=)v~
Check out the other analytical tools that I had published.
AEONDRIFT:
Enhanced Convolution RasterChart (HeatMap) - Dr. John EhlersThis is my enhanced version of Dr. John Ehlers' convolution heat map using Pine Script version 4.0. The original concept comes from chapter 13 of his book "Cycle Analytics for Traders". I did heavily modify the original computations for the purpose of reducing lag, but sometimes only improved by occurring one bar sooner. I would consider this a confirmational indicator due to the fact, that the vibrant and dramatic color changing technique usually occurs after reversals at the lowest portion of the chart in an overall positive trend typically, unless you have adjusted the "Periods" optimally by chance.
I provided multiple color schemes with an inversion technique for those of you who may have color blindness vision impairments. You may contact me in private if these color schemes are not suitable for your diagnosed visual impairment, and you would wish to contribute to seeing this color scheme improved along with other future indicators I shall release.
The "Shortest Period" controls the smoother and the "Longest Period" controls the highpass roofing filter.
I once again would personally like to thank the talented individuals at TV for providing a platform that embraces an initial free membership, which I first obtained myself, for individuals like me to freely code in Pine with mathemagical ideas and mental wizardry, creating ultimately, inventions like this eye candy display above.
Features List Includes:
"Source" Selection
Longest period adjustment
Shortest period adjustment
Dual color scheme option
Color inversion checkbox
This is not a freely available indicator, FYI. To witness my Pine poetry in action, properly negotiated requests for unlimited access, per indicator, may ONLY be obtained by direct contact with me using TV's "Private Chats" or by "Message" in my member name above. The comments section below is solely just for commenting and other remarks, ideas, compliments, etc... If you do have any questions or comments regarding this indicator, I will consider your inquiries, thoughts, and ideas presented below in the comments section, when time provides it. As always, "Like" it if you simply just like it, and also return to my scripts list occasionally for additional postings. Have a profitable future everyone!

Megalodon Pro Automated Longer Term TimerHow to use?
It should be used on DAILY time frame for finding potential market reversal points.
It shows reversal signals by printing Green for Buy - Orange for Strong Buy - Red for Sell - Purple for Strong Sell signals.

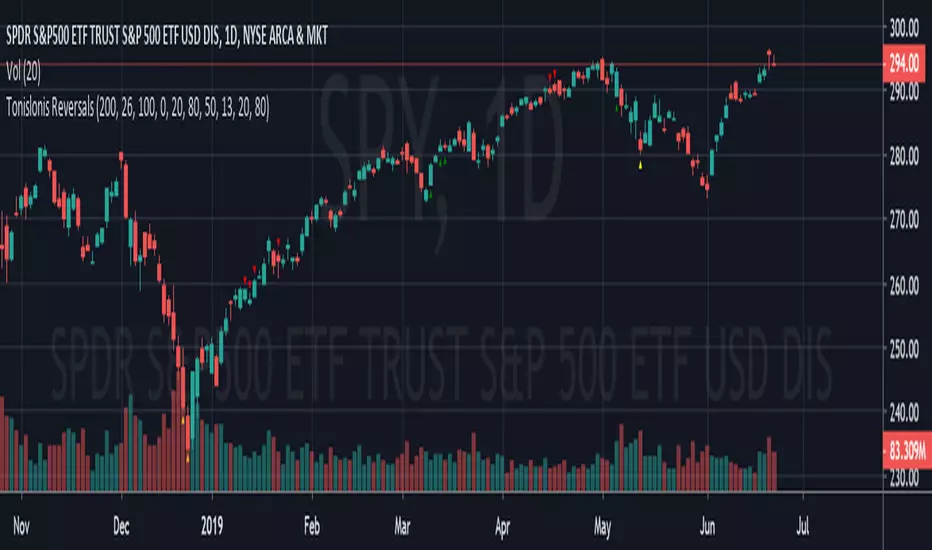
Tonislonis ReversalsHello,
so this is one of my so called "algos", which I crafted to give me indication of one certain pattern happening. I saw that this "pattern" had some pretty nice returns, if you use it on daily chart on big cap stocks and mix it with order flow or unusual option activity (sweeps).
Best entries happen when the yellow triangle appears little bit away from 13 EMA. Check the order flow and if everything looks like you have an edge, then take a trade and take profit near 13 EMA.
Not gonna share any code, because it's my magical "black box", which I built and be grateful that I'm even publishing it. Not gonna share anymore information about this. Just if you like it then use it and if not then don't.
Now go out there and make a living from it taking trades as some freaking yellow triangles show you entries lol.
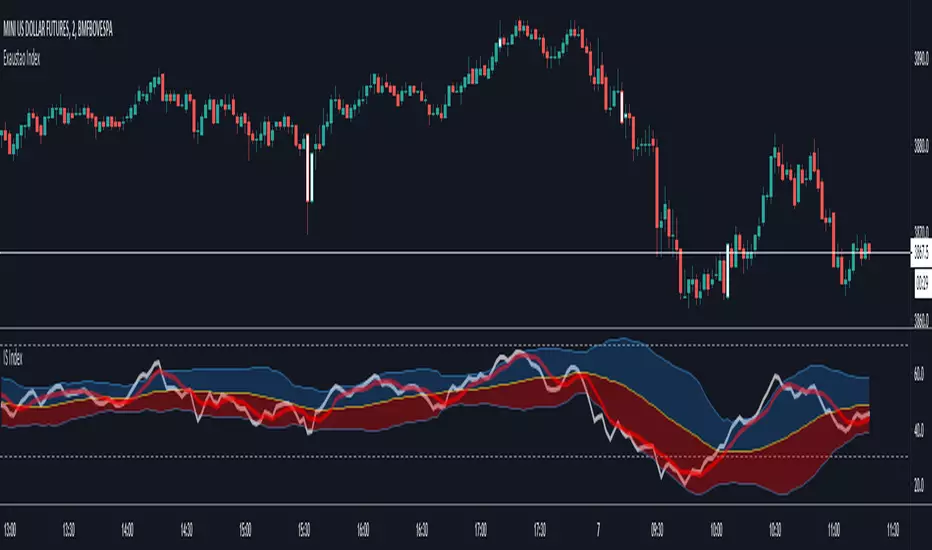
IS - Exaustao IndexIS - Indice de Exaustão
Este indicador está sendo publicado temporariamente. (Aproveitem para utilizar no Brasil usando o MiniDolar **Faz geralmente de 3 a 5ptos
O Objetivo é encontrar investidores;
Indicações de utilização:
B3 - Bolsa Brasileira;
Forex - Mercado Forex Descentralizado;
Melhores pares B3:
WDO
Melhores pares Forex:
AUDJPY
EURJPY
Tempo Grafico: 1 minuto (Ambos os mercados);
Indicações de Venda:
No M1, quando o ativo atingir as paredes, em exato na segunda parede, já ficar preparado para acionar uma venda. O melhor ponto de venda é quando ele se encontra na parede e o candle é colorido de amarelo.
Indicações de Compra:
Exatamente como a venda, realizar a venda quando houver o toque na segunda parede (indicado fazer parcial entre primeira e segunda parede), se o candle estiver entre as paredes e formar um triangulo abaixo do candle, habilita uma compra com stop curto.
Considerações:
Este indicador foi construído com base em muito estudo de volume, foram mais de 2 meses fazendo ele e testando incansavelmente.
Façam o backtest retroativo no grafico no M1 e percebam o quanto ele pode oferecer quando se forma um triangulo abaixo do candle ou um candle amarelo para a venda.
Ele funciona perfeitamente na B3 até as 11h 12h. Depois, como o mercado perde um pouco de liquidez ele nao tem o mesmo indice de eficiencia.
Não aceitar stops longos por se tratar do M1, se habilitar entrada e logo habilitar entrada no sentido contrario não pense duas vezes antes de sair da operação.
Aceite levar até 2 stops por dia com este indicador, se passar disso, o dia não está positivo para o indicador;
Stop:
Vai depender da relação de exposição a banca, geralmente para B3 (WDO) é indicado um stop de 3pts a 4ptos (Acima é força contraria e euforia)
Contato: 41 - 998964223 / 41 - 991154223 (Curitiba/Pr) - Brasil
"Escolha sempre estar ao lado de quem queira crescer e faça acontecer!!!"