Oath KeeperOath Keeper - Advanced Money Flow & Market Dynamics Indicator
A sophisticated indicator that analyzes market dynamics through money flow patterns, volume analysis, and liquidation detection to identify high-probability trading opportunities.
Core Features:
• Smart Money Flow Analysis: Proprietary calculation of institutional money movement
• Volume-Enhanced Signals: Multi-timeframe volume confirmation
• Liquidation Detection: Identifies potential forced liquidation events
• Advanced Signal Classification: Regular, Super, and Fakeout signals
Signal Types:
1. Regular Signals (Green/Purple Circles)
• Volume-confirmed momentum shifts
• Money flow threshold breaches
• Institutional participation confirmation
2. Super Signals (Green/Purple Squares)
• Deep oversold/overbought reversals
• High-volume rejection patterns
• Liquidation event confirmation
3. Fakeout Signals (Red X)
• Rapid sentiment shifts
• Trap detection
• False breakout warnings
Visual Components:
• Dynamic Money Flow Line (White/Purple)
• Order Flow Clouds (Green/Red with high transparency)
• Reference Levels (20, 50, 80)
• Multi-type Signal Markers
• Color-coded momentum visualization
Interpretation Guide:
• Green Cloud: Bullish money flow dominance
• Red Cloud: Bearish money flow dominance
• Circle Markers: Standard reversals
• Square Markers: High-conviction moves
• X Markers: Potential trap zones
Best Practices:
• Most effective on 1H+ timeframes
• Use with major trading pairs
• Wait for candle close confirmation
• Combine with support/resistance levels
• Monitor volume confirmation
• Use multiple timeframe analysis
This indicator helps traders identify institutional money flow, potential liquidation events, and market reversals by analyzing volume patterns and money flow dynamics, providing multiple confirmation layers for trade decisions.
Note: Performance varies with market conditions and timeframes. Always employ proper risk management.
Rsi-2

RSI Full [Titans_Invest]RSI Full
One of the most complete RSI indicators on the market.
While maintaining the classic RSI foundation, our indicator integrates multiple entry conditions to generate more accurate buy and sell signals.
All conditions are fully configurable, allowing complete customization to fit your trading strategy.
⯁ WHAT IS THE RSI❓
The Relative Strength Index (RSI) is a technical analysis indicator developed by J. Welles Wilder. It measures the magnitude of recent price movements to evaluate overbought or oversold conditions in a market. The RSI is an oscillator that ranges from 0 to 100 and is commonly used to identify potential reversal points, as well as the strength of a trend.
⯁ HOW TO USE THE RSI❓
The RSI is calculated based on average gains and losses over a specified period (usually 14 periods). It is plotted on a scale from 0 to 100 and includes three main zones:
Overbought: When the RSI is above 70, indicating that the asset may be overbought.
Oversold: When the RSI is below 30, indicating that the asset may be oversold.
Neutral Zone: Between 30 and 70, where there is no clear signal of overbought or oversold conditions.
⯁ ENTRY CONDITIONS
The conditions below are fully flexible and allow for complete customization of the signal.
______________________________________________________
🔹 CONDITIONS TO BUY 📈
______________________________________________________
• Signal Validity: The signal will remain valid for X bars .
• Signal Sequence: Configurable as AND/OR .
📈 RSI Conditions:
🔹 RSI > Upper
🔹 RSI < Upper
🔹 RSI > Lower
🔹 RSI < Lower
🔹 RSI > Middle
🔹 RSI < Middle
🔹 RSI > MA
🔹 RSI < MA
📈 MA Conditions:
🔹 MA > Upper
🔹 MA < Upper
🔹 MA > Lower
🔹 MA < Lower
📈 Crossovers:
🔹 RSI (Crossover) Upper
🔹 RSI (Crossunder) Upper
🔹 RSI (Crossover) Lower
🔹 RSI (Crossunder) Lower
🔹 RSI (Crossover) Middle
🔹 RSI (Crossunder) Middle
🔹 RSI (Crossover) MA
🔹 RSI (Crossunder) MA
🔹 MA (Crossover) Upper
🔹 MA (Crossunder) Upper
🔹 MA (Crossover) Lower
🔹 MA (Crossunder) Lower
📈 RSI Divergences:
🔹 RSI Divergence Bull
🔹 RSI Divergence Bear
______________________________________________________
______________________________________________________
🔸 CONDITIONS TO SELL 📉
______________________________________________________
• Signal Validity: The signal will remain valid for X bars .
• Signal Sequence: Configurable as AND/OR .
📉 RSI Conditions:
🔸 RSI > Upper
🔸 RSI < Upper
🔸 RSI > Lower
🔸 RSI < Lower
🔸 RSI > Middle
🔸 RSI < Middle
🔸 RSI > MA
🔸 RSI < MA
📉 MA Conditions:
🔸 MA > Upper
🔸 MA < Upper
🔸 MA > Lower
🔸 MA < Lower
📉 Crossovers:
🔸 RSI (Crossover) Upper
🔸 RSI (Crossunder) Upper
🔸 RSI (Crossover) Lower
🔸 RSI (Crossunder) Lower
🔸 RSI (Crossover) Middle
🔸 RSI (Crossunder) Middle
🔸 RSI (Crossover) MA
🔸 RSI (Crossunder) MA
🔸 MA (Crossover) Upper
🔸 MA (Crossunder) Upper
🔸 MA (Crossover) Lower
🔸 MA (Crossunder) Lower
📉 RSI Divergences:
🔸 RSI Divergence Bull
🔸 RSI Divergence Bear
______________________________________________________
______________________________________________________
🤖 AUTOMATION 🤖
• You can automate the BUY and SELL signals of this indicator.
______________________________________________________
______________________________________________________
⯁ UNIQUE FEATURES
______________________________________________________
Signal Validity: The signal will remain valid for X bars
Signal Sequence: Configurable as AND/OR
Condition Table: BUY/SELL
Condition Labels: BUY/SELL
Plot Labels in the Graph Above: BUY/SELL
Automate and Monitor Signals/Alerts: BUY/SELL
Signal Validity: The signal will remain valid for X bars
Signal Sequence: Configurable as AND/OR
Condition Table: BUY/SELL
Condition Labels: BUY/SELL
Plot Labels in the Graph Above: BUY/SELL
Automate and Monitor Signals/Alerts: BUY/SELL
______________________________________________________
📜 SCRIPT : RSI Full
🎴 Art by : @Titans_Invest & @DiFlip
👨💻 Dev by : @Titans_Invest & @DiFlip
🎑 Titans Invest — The Wizards Without Gloves 🧤
✨ Enjoy the Spell!
______________________________________________________
o Mission 🗺
• Inspire Traders to manifest Magic in the Market.
o Vision 𐓏
• To elevate collective Energy 𐓷𐓏

RSI + MA + Divergence + SnR + Price levelOverview
This indicator combines several technical analysis tools to give traders a comprehensive view based on the RSI indicator. Its main features include:
RSI & Moving Averages on RSI:
RSI: Calculates the RSI based on the closing price (or a user-selected source) with a configurable period (default is 14).
EMA and WMA: Computes and plots an Exponential Moving Average (EMA with a period of 9) and a Weighted Moving Average (WMA with a period of 45) on the RSI, helping to smooth out signals and better identify trends.
Price Ladder Based on RSI:
Draws horizontal lines at specified target RSI levels (from targetRSI1 to targetRSI7, default levels ranging from 20 to 80).
Calculates a target price based on the price change relative to the averaged gains and losses, providing an estimated price level when the RSI reaches those critical levels.
Divergence Detection:
Identifies divergence between price and RSI:
Bullish Divergence: Detected when the price forms a lower low but RSI fails to confirm with a corresponding lower low, with the RSI falling under a configurable threshold (d_below).
Bearish Divergence: Detected when the price forms a higher high while the RSI does not, with the RSI exceeding a configurable upper threshold (d_upper).
Optionally displays labels on the chart to alert the trader when divergence signals are detected.
Auto Support & Resistance on RSI:
Automatically calculates and plots support and resistance lines based on the RSI over different lookback periods (e.g., 34, 89, 200 bars).
Helps traders identify key RSI levels where price reversals or breakouts might occur.
Benefits for the Trader
This indicator is designed to assist traders in their decision-making process by integrating multiple technical analysis elements:
Identifying Market Trends:
By combining the RSI with its moving averages (EMA, WMA), traders can better assess market trends and the strength of these trends, thereby improving trade entry accuracy.
Early Reversal Signals via Divergence:
Divergence signals (both bullish and bearish) can help forecast potential reversals in the market, allowing traders to adjust their strategies timely.
Determining RSI-Based Support/Resistance Levels:
Automatic identification of support and resistance levels on the RSI provides key areas where a price reversal or breakout may occur, assisting traders in setting stop-loss and take-profit levels strategically.
Price Target Forecasting with the Price Ladder:
The target price labels calculated at important RSI levels provide insights into potential price objectives, aiding in risk management and profit planning.
Flexible Configuration:
Traders can customize key parameters such as the RSI period, lengths for EMA and WMA, target RSI levels, divergence conditions, and support/resistance settings. This flexibility allows the indicator to adapt to different trading styles and strategies.
How to read data
Some use-cases
Used to estimate price according to the RSI level.
When you trade using RSI, you want to set your stop-loss or take-profit levels based on RSI. By looking at the price ladder, you know the corresponding price level to enter a trade.
Used to determine the entry zone.
RSI often reacts to its own previously established support/resistance levels. Use the Auto SnR feature to identify those zones.
Used to determine the trend.
RSI and its moving averages help identify the price trend:
Uptrend: 3 lines separate and point upward.
Downtrend: 3 lines separate and point downward.
Use WMA45 to determine the trend:
Uptrend: WMA45 is moving upward or trading above the 50 level.
Downtrend: WMA45 is moving downward or trading below the 50 level.
Sideways: WMA45 is trading around the 50 level.
Use EMA9 to confirm the trend: A crossover of EMA9 through WMA45 confirms the formation of a new trend.
Configuration
The script allows users to configure a number of important parameters to suit their analytical preferences:
RSI Settings:
RSI Length (rsiLengthInput): The number of periods used to compute the RSI (default is 14, adjustable as needed).
RSI Source (rsiSourceInput): Select the price source (default is the closing price).
RSI Color (rsiClr): The color used to display the RSI line.
Moving Averages on RSI:
EMA Length (emaLength): The period for calculating the EMA on RSI (default is 9).
WMA Length (wmaLength): The period for calculating the WMA on RSI (default is 45).
EMA Color (emaClr) and WMA Color (wmaClr): Customize the colors of the EMA and WMA lines.
Price Ladder Settings:
Toggle Price Ladder (showPrice): Enable or disable the display of the price ladder.
Target RSI Levels: targetRSI1 through targetRSI7: RSI values at which target prices are calculated (default values range from 20, 30, 40, 50, 60, 70 to 80).
Price Label Color (priceColor): The text color for displaying the target price labels.
Divergence Settings:
Divergence Toggle (calculateDivergence): Option to enable or disable divergence calculation and display.
Divergence Conditions:
d_below: RSI level below which bullish divergence is considered.
d_upper: RSI level above which bearish divergence is considered.
Display Divergence Labels (showDivergenceLabel): Option to display labels on the chart when divergence is detected.
Auto Support & Resistance on RSI:
Toggle Auto S&R (enableAutoSnR): Enable or disable automatic plotting of support and resistance levels.
Lookback Periods for Support/Resistance:
L1_lookback: Lookback period for level 1 (e.g., 34 bars).
L2_lookback: Lookback period for level 2 (e.g., 89 bars).
L3_lookback: Lookback period for level 3 (e.g., 200 bars).
Support and Resistance Colors:
rsiSupportClr: Color for the support line.
rsiResistanceClr: Color for the resistance line.
Alerts:
Divergence Alerts: Alert conditions are set up to notify the trader when bullish or bearish divergence is detected, aiding in timely decision-making.

RSI Price LadderFX:XAUUSD
Overview
RSI Price Ladder is an indicator that visualizes RSI levels mapped directly to price levels across multiple timeframes.
It helps traders see where the RSI will reach certain threshold values (like 30, 50, 70) in terms of price, without calculating manually.
It dynamically draws ladder lines (price levels) based on user-defined RSI targets, allowing clear visualization of RSI movements versus price action.
Purpose for Traders
Forecast Price Zones: Understand at which price levels RSI would hit oversold/overbought zones.
Multi-Timeframe Analysis: Monitor RSI-price relationships across multiple timeframes simultaneously (e.g., M5, M15, H1, H4).
Timing Entries and Exits: Plan precise entries or exits based on expected RSI behavior without switching between charts.
Visual Clarity: Simplifies multi-timeframe RSI tracking by ladder-style price mapping directly on the current chart.
Configuration
RSI length: The period for RSI calculation (default 14).
RSI Target Levels (1–7): Define up to 7 custom RSI levels (e.g., 20, 30, 40, 50, 60, 70, 80).
Spacing Between Ladders: Horizontal spacing between different timeframe ladders on the chart.
Pointer Colors: Customize colors for current RSI, EMA(9) of RSI, and WMA(45) of RSI.
Show TF1–TF4: Toggle visibility of up to four different timeframe ladders.
Interval TF1–TF4: Select timeframes to draw ladders (choices from 1m to 1W including 3D).
Ladder Colors: Customize the ladder color for each timeframe separately.
How to read data
See explaination:
How to use
The primary goal of this indicator is to help traders easily and accurately see price levels corresponding to specific RSI values .
Identifying Multi-Timeframe Support and Resistance
According to RSI behavior:
- In an uptrend, RSI tends to find support around 40, previous RSI bottoms, and the WMA45.
- In a downtrend, RSI tends to face resistance around 60, previous RSI tops, and the WMA45.
Using the RSI Price Ladder, you can accurately pinpoint the exact price levels corresponding to these RSI support and resistance zones.
Defining Entry Zones, Stop Loss, and Take-Profit Areas Based on RSI
For example:
By observing RSI behavior, I noticed a downward trend forming.
On both M15 and H1 timeframes, RSI resistance levels align with the price zone around 3043–3054.
Thus, I can plan a sell trade in this entry zone:
- Stop loss: If RSI breaks above the resistance level, which also corresponds to a price resistance.
- Take-profits at two areas:
RSI support on M5 at RSI 30, corresponding to price 3007.
RSI support on M15 at RSI 30, corresponding to price 2988.
You see, with the ladder, we can directly visualize the price levels corresponding to RSI points on the chart, making decision-making more intuitive.
Result:
The price successfully hit TP1 and TP2.
Visualizing Buying and Selling Strength Across Timeframes
The indicator helps track the correlation of buying and selling strength across different timeframes at the same time. For instance: when selling pressure increases, higher timeframe RSI will typically be higher than lower timeframe RSI. Visualizing this makes it easier to observe and connect price movements across multiple timeframes quickly and clearly.
Visualizing When Combining with Other Methods
In this example:
- RSI shows support around 27.
- Instantly, on the price chart, I notice that the RSI 27 level aligns with the EMA200, a major dynamic price support.
Thus, a long setup can be considered:
- Entry: Near this confluence zone.
- Stop loss: Below the EMA200 or if RSI drops to 20.
Summary
RSI Price Ladder gives traders a powerful visual tool to link RSI behavior to real price levels across multiple timeframes, enhancing strategic entry/exit planning without needing to flip charts.
- Save time spotting RSI targets.
- Stay organized across multiple timeframes.
- Customize the entire ladder experience from colors to intervals.

TradeDots - Buy Sell Signals ProThe TradeDots - Buy Sell Signals Pro is an advanced technical analysis tool engineered to identify key market turning points and trend continuations. By combining multiple confirmation methods, this indicator provides traders with a comprehensive system for recognizing high-probability entry and exit points across various market conditions.
📝 HOW IT WORKS
Enhanced Supertrend Implementation
Unlike the traditional Supertrend indicator that simply changes color when price crosses above or below a calculated line, our implementation incorporates multiple layers of confirmation:
Advanced Calculation: Uses an enhanced ATR-based algorithm that incorporates trend bias detection and momentum filtering
Multi-Factor Confirmation: Considers price interaction with previous Supertrend values, not just current crossovers
Contextual Awareness: Distinguishes between different entry types based on market risk levels and momentum conditions
Visual Enhancement: Provides background shading to clearly indicate trend direction and strength
Smart Trendline Algorithm
The indicator employs a proprietary Smart Trendline that adapts to market conditions using an advanced moving average system. Unlike traditional moving averages that simply track price, the Smart Trendline incorporates volatility data to change colors based on momentum strength, providing immediate visual feedback about the current market phase with zero lag.
Calculation: Processes price data through selectable advanced calculation methods (including Hull, Jurik, and McGinley averages) with dynamic color-coding based on a modified Keltner Channel system.
Visualization: Green indicates strong bullish momentum, purple represents bearish momentum, and gray signals consolidation or uncertain conditions.
Multi-Signal Confirmation System
The indicator integrates three distinct signal mechanisms to confirm trading opportunities:
1. RSI-Sequential Reversal Signals: Combines RSI levels with seq count patterns to identify potential short-term reversals.
Calculation: Analyzes RSI conditions against specific thresholds while tracking consecutive pattern formations.
Visualization: Green triangles for buy signals and red triangles for sell signals.
2. Statistical Reversal Signals: Identifies statistically significant deviations from normal price behavior.
Calculation: Uses a modified standard deviation approach to determine when price has moved too far from its statistical average.
Visualization: Large green arrows emoji for powerful buy signals and red arrows emoji for powerful sell signals.
3. Supply & Demand Zone Detection: Automatically identifies key price levels where significant buying or selling pressure may exist.
Calculation: Uses RSI extremes combined with confirmation periods to establish high-probability reversal zones.
Visualization: Green-filled areas mark support (demand) zones and red-filled areas mark resistance (supply) zones.
Buy/Sell Signal Generation
The system generates several types of signals with varying strengths:
1. Regular Buy/Sell Signals: Generated when:
Price crosses with MA above/below the Supertrend line
RSI conditions confirm the direction
Candlestick patterns support the signal direction (bullish/bearish candle formation)
Visualized as green/red triangles
2. Strong Buy/Sell Signals: Appear when multiple confirmation factors align:
Regular buy/sell condition is met
Price is interacting with a Supply/Demand zone
Additional momentum confirmation from auxiliary indicators
Seq count reaches significant levels
Statistical Reversal signal confirms the direction
3. Breakout Signals: Special case signals that appear during:
Trend transitions after consolidation
When price breaks through significant resistance/support levels from previous trend
Following pattern completions that suggest increased momentum
Market Structure Analysis
The indicator categorizes market conditions and provides visual cues for traders:
Trend Identification: Supertrend-based algorithm with enhanced visual presentation identifies the prevailing market direction.
Bar Coloring System: Candles change color based on price position relative to EMAs to clearly display strength and direction of momentum
🛠️ HOW TO USE
Signal Interpretation
Buy Signals: "Buy" signals, Green triangles (RSI-Sequential) and large green arrows (Statistical Reversals) appear at potential buy points.
Sell Signals: "Sell" signals, Red triangles (RSI-Sequential) and large red arrows (Statistical Reversals) appear at potential sell points.
Highest Probability Entries: Occur when signals appear near or within Supply & Demand zones.
Trading Strategies
Trend-Following Strategy
1. Identify the main trend using the Smart Trendline color
2. Enter long positions during uptrends when:
Price pulls back to the Smart Trendline
Green triangles or arrows appear
Signals occur near green demand zones
3. Enter short positions during downtrends when:
Price bounces up to the Smart Trendline
Red triangles or arrows appear
Signals occur near red supply zones
Counter-Trend/Reversal Strategy
1. Look for Statistical Reversal arrows at significant price extremes
2. Confirm with an RSI-Sequential signal in the same direction
3. Pay special attention when these signals appear inside Supply & Demand zones
4. Use the Smart Trendline color change as additional confirmation
Multiple Confirmation Technique
For highest probability trades, look for:
Signal alignment (both signal types in same direction)
Supply/Demand zone interaction
Smart Trendline color supporting the signal direction
❗️LIMITATIONS
Signal Lag: The system identifies reversals after they have begun, potentially missing the absolute bottom or top.
False Signals: Can occur during periods of high volatility or range-bound markets.
Timeframe Sensitivity: Some signals work better on higher timeframes for long-term trading, while others are more effective on lower timeframes for short-term trading.
Bar Closing Requirement: All signals are based on closed candles and may be subject to change until the candle closes.
RISK DISCLAIMER
Trading involves substantial risk, and most traders may incur losses. All content, tools, scripts, articles, and education provided by TradeDots are for informational and educational purposes only. Past performance is not indicative of future results.
This indicator should be used as part of a complete trading approach that includes proper risk management, consideration of the broader market context, and confirmation from price action patterns. No trading system can guarantee profits, and users should always exercise caution and use appropriate position sizing.

Triple SRSI-MFI Ⅲ - Multi TimeframeTriple SRSI-MFI Ⅲ - Multi Timeframe Indicator
Description
The Triple SRSI-MFI Ⅲ - Multi Timeframe indicator is a powerful tool designed to combine Stochastic RSI (SRSI) and Money Flow Index (MFI) across multiple timeframes (higher, current, and lower). It provides a comprehensive view of market momentum and potential overbought/oversold conditions by calculating a weighted hybrid of SRSI-MFI values from three different timeframes. The indicator also integrates Bollinger Bands to help identify trend direction and volatility.
This indicator is ideal for traders who want to analyze market conditions across multiple timeframes without switching charts. It automatically adjusts settings based on the current timeframe and includes a dynamic weighting system optimized for Bitcoin volatility. Additionally, a real-time information panel displays the market state (buy/sell) and signal strength.
Key Features
Multi-Timeframe Analysis: Combines SRSI-MFI from higher, current, and lower timeframes for a holistic view.
Dynamic Weighting: Automatically adjusts weights for each timeframe based on Bitcoin volatility, with an option for manual customization.
Bollinger Bands Integration: Visualizes trend direction and volatility using Bollinger Bands, with customizable source selection.
Real-Time Info Panel: Displays market state (buy/sell) and signal strength (%) in the top-right corner of the chart.
Customizable Settings: Allows users to tweak MFI source, Bollinger Bands parameters, and visibility of individual components.
How to Use
Add to Chart: Add the "Triple SRSI-MFI Ⅲ - Multi Timeframe" indicator to your chart.
Interpret Signals:
Market State (Buy/Sell): Shown in the info panel. "Buy" when the average SRSI-MFI is above the Bollinger Bands basis, "Sell" when below.
Strength (%): The relative position of the average SRSI-MFI within the Bollinger Bands, scaled from 0% to 100%.
Overbought/Oversold Levels: The indicator plots horizontal lines at 80 (overbought) and 20 (oversold). Use these as potential reversal zones.
Combine with Price Action: Use the indicator in conjunction with price action or other tools for better decision-making.
Adjust Settings: Customize the settings (e.g., Bollinger Bands length, weights, visibility) to match your trading style.
Settings
MFI Source: Select the source for MFI calculation (default: "hlc3"). Options include "close", "open", "high", "low", "hl2", "hlc3", "ohlc4".
Bollinger Bands:
Length: Period for Bollinger Bands calculation (default: 20).
Multiplier: Standard deviation multiplier for the bands (default: 2.0).
Source: Choose which SRSI-MFI value to use for Bollinger Bands ("averageHybrid", "hybrid_higher", "hybrid_current", "hybrid_lower"; default: "hybrid_higher").
Weights:
Auto Weight Enabled: Enable/disable automatic weights based on Bitcoin volatility (default: true).
Higher/Current/Lower Weights: Manually set weights for each timeframe if auto-weight is disabled (defaults: 1.5, 1.0, 0.5).
Indicator On/Off:
Toggle visibility for Higher SRSI-MFI, Current SRSI-MFI, Lower SRSI-MFI, Average SRSI-MFI, and Bollinger Bands.
How It Works
SRSI-MFI Calculation:
Stochastic RSI (SRSI) and Money Flow Index (MFI) are calculated for three timeframes: higher, current, and lower.
The hybrid value (SRSI * (MFI / 100)) is computed for each timeframe.
Weighted Average:
The hybrid values are combined into a weighted average (averageHybrid) using dynamic or manual weights.
Bollinger Bands:
Bollinger Bands are applied to the selected source (e.g., hybrid_higher) to identify trend direction and volatility.
Relative Position:
The position of averageHybrid within the Bollinger Bands is scaled to a percentage (0% to 100%) for strength assessment.
Visualization:
Plots individual SRSI-MFI lines, Bollinger Bands, and overbought/oversold levels.
A real-time info panel provides market state and signal strength.
Notes
This indicator is best used as part of a broader trading strategy. It is not a standalone signal generator and should be combined with other forms of analysis.
The automatic weights are optimized for Bitcoin (BTC) volatility. For other assets, you may need to adjust the weights manually.
The indicator may require sufficient historical data to calculate higher and lower timeframe values accurately.

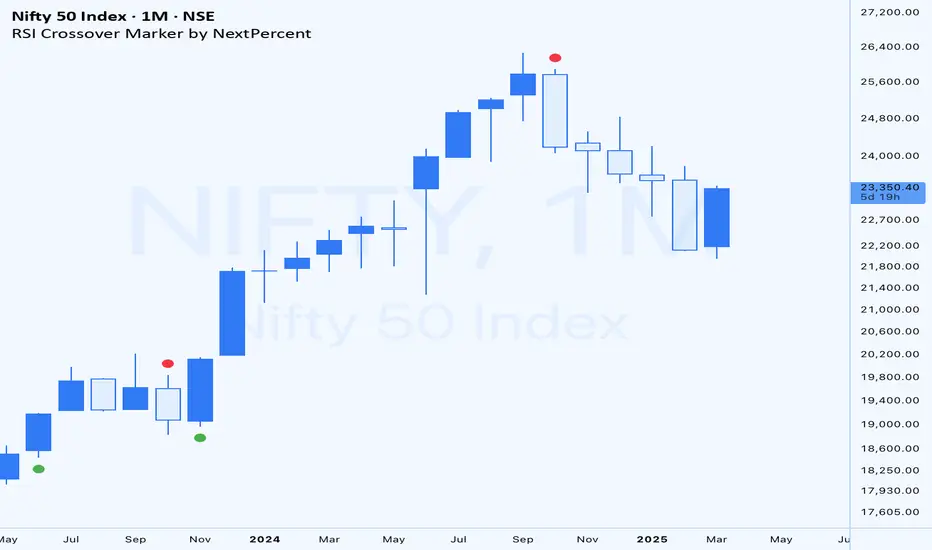
RSI Crossover Marker by NextPercentRSI Crossover Marker by NextPercent
This indicator combines RSI crossovers with moving averages and optional divergence detection to generate trading signals.
Key Features:
• RSI crossover signals with customizable moving average (EMA, SMA, WMA, RMA)
• Optional divergence detection
• Flexible timeframe settings
• Wait for candle close option
• Visual signals using triangles above/below price bars
Signal Generation:
• Bullish Signal: RSI crosses above the moving average
• Bearish Signal: RSI crosses below the moving average
• When divergence is enabled, signals only appear with confirmed divergence patterns
Customizable Parameters:
• RSI Length and Source
• Moving Average Type and Length
• Bollinger Band Standard Deviation
• Timeframe Selection
• Divergence Detection Toggle
Visual Signals:
• Green triangles appear below bars for bullish signals
• Red triangles appear above bars for bearish signals
Note:
This indicator is designed to help identify potential trend reversals and trading opportunities based on RSI momentum and optional divergence confirmation.
EMA Clouds with Strict Buy/Sell SignalsEMA Clouds with Strict Buy/Sell Signals - Precision Trading Unleashed
Unlock the power of trend-following precision with the EMA Clouds with Strict Buy/Sell Signals indicator, a sophisticated tool built for traders who demand reliability and clarity in their decision-making. Inspired by the legendary Ripster EMA Clouds, this indicator takes the classic cloud concept to the next level by incorporating stricter, high-confidence signals—perfect for navigating the markets on 15-minute or higher timeframes.
Why You’ll Want This on Your Chart:
Dual EMA Clouds for Crystal-Clear Trends: Watch as two dynamic clouds—formed by carefully paired Exponential Moving Averages (8/21 and 34/50)—paint a vivid picture of market momentum. The green short-term cloud and red long-term cloud provide an intuitive, at-a-glance view of trend direction and strength.
Stricter Signals, Fewer False Moves: Tired of chasing weak signals? This indicator only triggers buy and sell signals when the stars align: a cloud crossover (short-term crossing above or below long-term) and price confirmation above or below both clouds. The result? Fewer trades, higher conviction, and a cleaner chart.
Customizable Timeframe Power: Whether you’re a scalper on the 15-minute chart or a swing trader on the daily, tailor the clouds to your preferred higher timeframe (15min, 30min, 1hr, 4hr, or daily) for seamless integration into your strategy.
Visual Mastery Meets Actionable Alerts: Green buy triangles below the bars and red sell triangles above them make spotting opportunities effortless. Pair this with built-in alerts, and you’ll never miss a high-probability trade again.
How It Works:
Buy Signal: Triggers when the short-term cloud crosses above the long-term cloud and the price surges above both, signaling a robust bullish breakout.
Sell Signal: Activates when the short-term cloud dips below the long-term cloud and the price falls beneath both, confirming bearish dominance.
Cloud Visualization: The green cloud (8/21 EMA) tracks fast-moving trends, while the red cloud (34/50 EMA) anchors the broader market direction—together, they filter noise and spotlight tradable moves.
Why Traders Will Love It:
Designed for those who value precision over guesswork, this indicator cuts through market clutter to deliver signals you can trust. Whether you’re trading stocks, forex, crypto, or futures, its adaptability and strict logic make it a must-have tool for serious traders. Customize the EMA lengths, tweak the timeframe, and watch your edge sharpen.
Add EMA Clouds with Strict Buy/Sell Signals to your chart today and experience the confidence of trading with a tool that’s as disciplined as you are. Your next big move is waiting—don’t let it slip away.

Multi-Timeframe Stochastic RSI ArrowsMulti-Timeframe Stochastic RSI Arrows Indicator by The Venetian
Dear Moderators before you torch me alive theres nothing groundbreaking just very handy indicator for some users.
This indicator provides traders with a jet fighter-style heads-up display for market momentum across multiple timeframes. By displaying Stochastic RSI directional arrows for 12 different timeframes simultaneously, it offers a comprehensive view of market conditions without requiring multiple chart windows.
How It Works
The indicator calculates the Stochastic RSI for each of 12 common timeframes (1m to 3M) and represents directional movements with intuitive arrows:
- ▲ Green up arrow = Rising momentum
- ▼ Red down arrow = Falling momentum
- ◄► Yellow horizontal arrows = Flat/sideways momentum
- ► Gray right arrow = Just peaked (crossed above overbought)
- ◄ Gray left arrow = Just bottomed (crossed below oversold)
Each timeframe's status appears with its label (e.g., "1m ▲") in a clean, vertically-stacked display using ATR-based spacing to maintain consistent visual appearance regardless of price scale.
Key Features
- ATR-Based Spacing : Uses Average True Range to maintain consistent distances between labels even as chart scale changes
- Multi-Timeframe Analysis: Easily spot divergences and confluences across timeframes (1m, 3m, 5m, 15m, 30m, 1h, 2h, 4h, 1D, 1W, 1M, 3M)
- Sensitivity Control: Adjust flat detection sensitivity to filter out noise
- Customisable Appearance: Modify arrow size, vertical spacing, and show/hide timeframe labels
- Overbought/Oversold Detection: Highlights when momentum has peaked or bottomed at extreme levels
- Trading Applications
- Trend Alignment: Quickly identify when multiple timeframes align in the same direction
- Divergence Detection: Spot when shorter timeframes begin to shift against longer ones
- Entry/Exit Timing: Use crossovers of significant timeframes as potential signals
- Market Context: Maintain awareness of the bigger picture while trading shorter timeframes
This indicator doesn't break new ground technically but excels in presenting complex multi-timeframe information in a clean, actionable format — much like a pilot's heads-up display provides critical information at a glance. The ATR-based positioning ensures consistent visibility across different instruments and market conditions.
Great effort has been made for this script to adhere to TradingView's Pine Script house rules and focuses on trader usability rather than introducing novel technical concepts.

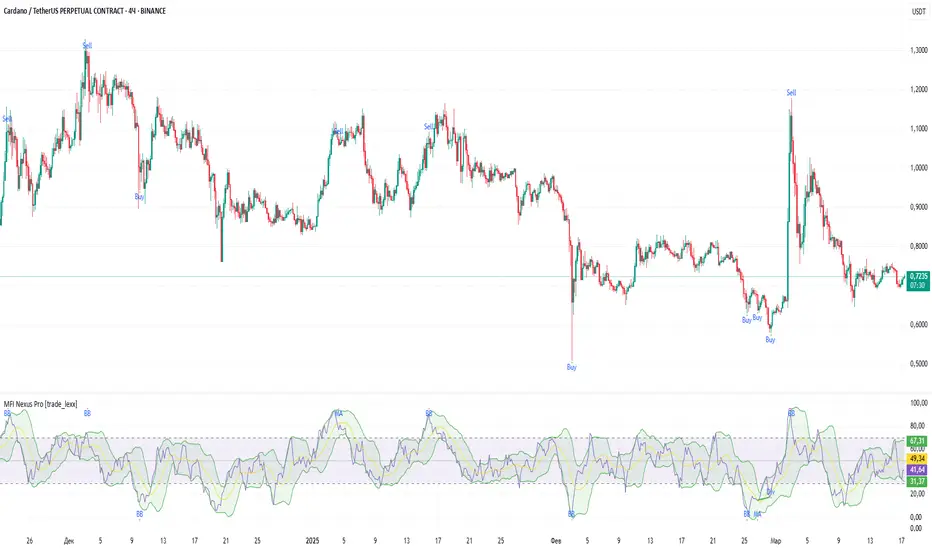
MFI Nexus Pro [trade_lexx]📈 MFI Nexus Pro is your reliable trading assistant!
📊 What is MFI Nexus Pro ?
MFI Nexus Pro is a trading indicator that analyzes cash flows in the market. It shows where money is moving — into or out of an asset, and based on this, generates buy or sell signals.
💡 The main components of the indicator
📊 The MFI Cash Flow Index (MFI)
shows the strength of cash flow into an asset. Values above 70 indicate overbought (an early sale is possible), and values below 30 indicate oversold (an early purchase is possible).
📈 Moving Averages (MA)
The indicator uses 10 different types of moving averages to smooth the MFI line.:
- SMA: Simple moving average
- EMA: Exponential moving average
- WMA: Weighted moving average
And other more complex types (HMA, KAMA, VWMA, ALMA, TEMA, ZLEMA, DEMA)
The choice of the type of moving average affects the speed of the indicator's response to market changes.
🎯 Bollinger Bands (BB)
Bands around the moving average that widen and narrow depending on volatility. They help determine when the MFI is out of the normal range.
🔄 Divergences
Divergences show discrepancies between price and MFI:
- Bullish divergence: the price is falling and the MFI is rising — an upward reversal is possible
- Bearish divergence: the price is rising and the MFI is falling — a downward reversal is possible
🔍 Indicator signals
1️⃣ Moving average signals (MA)
Buy signal
- What happens: MFI crosses its moving average from bottom to top
- What does it look like: the green triangle labeled "MA" under the chart
- What does it mean: money begins to actively flow into the asset, price growth is possible
Sell signal
- What happens: the MFI crosses the moving average from top to bottom
- What does it look like: a red triangle with the label "MA" above the chart
- What does it mean: money starts to leave the asset, the price may fall
2️⃣ Bollinger Band Signals (BB)
Buy signal
- What's happening: The MFI crosses the lower Bollinger band from bottom to top
- What it looks like: the green triangle marked "BB"
- What it means: The MFI was too low and is now starting to recover
Sell Signal
- What's going on: MFI crosses the upper Bollinger band from top to bottom
- What it looks like: a red triangle marked "BB"
- What it means: The MFI was too high and is now starting to decline
3️⃣ Divergence Signals (Div)
Buy Signal (Bullish Divergence)
- What's going on: the price is falling more than the MFI
- What it looks like: a green triangle marked "Div"
- What it means: despite the fall in price, money is already starting to return to the asset
Sell signal (bearish divergence)
- What is happening: the price is rising more strongly than the MFI
- What does it look like: the red triangle with the label "Div"
- What does it mean: despite the price increase, money is already starting to leave the asset
🛠️ Filters to filter out false signals
1️⃣ Minimum distance between the signals
- What it does: sets the minimum number of candles between signals
- Why it is needed: prevents signals from being too frequent during strong market fluctuations
- How to set it up: Set the number from 0 and above (default: 5)
2️⃣ "Waiting for the opposite signal" mode
- What it does: waits for a signal in the opposite direction before generating a new signal
- Why you need it: it helps you not to miss important trend reversals
- How to set up: just turn the function on or off
3️⃣ Filter by MFI levels
- What it does: generates signals only when the MFI is in the specified ranges
- Why it is needed: it helps to catch the moments when the market is oversold or overbought
- How to set up:
- For buy signals: set a range for oversold (e.g. 1-30)
- For sell signals: set a range for overbought (e.g. 70-100)
4️⃣ The RSI filter
- What it does: additionally checks the RSI values to confirm the signals
- Why it is needed: adds additional confirmation from another popular indicator
- How to set up: Similar to the MFI filter, set ranges for buying and selling
🔄 Signal combination modes
1️⃣ Normal mode ("None")
- How it works: all signals (MA, BB, Div) work independently of each other
- When to use it: for general market analysis or when learning how to work with the indicator
2️⃣ "And" mode ("MA and BB and Div")
- How it works: the alarm appears only when several conditions are triggered simultaneously
- Combination options:
- MA+BB: signals from the moving average and Bollinger bands
- MA+Div: signals from the moving average and divergence
- BB+Div: signals from the Bollinger bands and divergence
- MA+BB+Div: all three signals simultaneously
- When to use: for more reliable but rare signals
3️⃣ "OR" mode ("MA or BB or Div")
- How it works: the alarm appears when any of the conditions are triggered
- When to use: for frequent signals when you don't want to miss any opportunity.
🔌 Connecting to trading strategies
The indicator can be connected to your trading strategies using 5 different channels.:
1. Channel for MA signals: connects only signals from moving averages
2. BB signal channel: connects only the signals from the Bollinger bands
3. Channel for divergence signals: connects only divergence signals
4. Channel for "And" mode: connects only combined signals
5. Channel for "OR" mode: connects signals from any source
🔔 Setting up alerts
The indicator can send alerts when alarms appear.:
- Alerts for MA: when the MFI crosses the moving average
- Alerts for BB: when the MFI crosses the Bollinger bands
- Divergence alerts: when a divergence is detected
- Combined alerts: for "AND" and "OR" modes
🎭 What does the indicator look like on the chart ?
- MFI main line: purple line
- Overbought/oversold levels: horizontal lines at levels 30 and 70
- Middle line: dotted line at level 50
- MFI Moving Average: yellow line
- Bollinger bands: green lines around the moving average
- Signals: green and red triangles with corresponding labels
📚 How to start using MFI Nexus Pro
1️⃣ Initial setup
- Add an indicator to your chart
- Select the type of moving average and the period (you can leave it as the default)
- Activate the desired signal types (MA, BB, Div)
2️⃣ Filter settings
- Set the distance between the signals to get rid of unnecessary noise
- Adjust the MFI and RSI levels depending on how volatile your asset is
- If you need more reliable signals, turn on the "Waiting for the opposite signal" mode.
3️⃣ Operation mode selection
- First, use the standard mode to see all possible signals.
- When you get comfortable, try the "And" mode for more reliable signals.
- For active trading, you can use the "OR" mode
4️⃣ Setting up Alerts
- Select the types of signals you want to be notified about
- Set up alerts for "AND" or "OR" modes if you use them
5️⃣ Verification and adaptation
- Check the operation of the indicator on historical data
- Adjust the parameters for a specific asset
- Adapt the settings to your trading style
🌟 Usage examples
For trend trading
- Use MA signals in the direction of the main trend
- Turn on the "Waiting for the opposite signal" mode
- Set stricter levels for filters
For trading in a sideways range
- Use BB signals to detect bounces from the range boundaries
- Use the MFI level filter to confirm overbought/oversold conditions
- Adjust the Bollinger bands according to the width of the range
To determine the pivot points
- Pay attention to the divergence signals
- Use the "And" mode by combining divergences with other signals
- Check the RSI filter for additional confirmation
Supertrend and Fast and Slow EMA StrategyThis strategy combines Exponential Moving Averages (EMAs) and Average True Range (ATR) to create a simple, yet effective, trend-following approach. The strategy filters out fake or sideways signals by incorporating the ATR as a volatility filter, ensuring that trades are only taken during trending conditions. The key idea is to buy when the short-term trend (Fast EMA) aligns with the long-term trend (Slow EMA), and to avoid trades during low volatility periods.
How It Works:
EMA Crossover:
1). Buy Signal: When the Fast EMA (shorter-term, e.g., 20-period) crosses above the Slow EMA (longer-term, e.g., 50-period), this indicates a potential uptrend.
2). Sell Signal: When the Fast EMA crosses below the Slow EMA, this indicates a potential downtrend.
ATR Filter:
1). The ATR (Average True Range) is used to measure market volatility.
2). Trending Market: If the ATR is above a certain threshold, it indicates high volatility and a trending market. Only when ATR is above the threshold will the strategy generate buy/sell signals.
3). Sideways Market: If ATR is low (sideways or choppy market), the strategy will suppress signals to avoid entering during non-trending conditions.
When to Buy:
1). Condition 1: The Fast EMA crosses above the Slow EMA.
2). Condition 2: The ATR is above the defined threshold, indicating that the market is trending (not sideways or choppy).
When to Sell:
1). Condition 1: The Fast EMA crosses below the Slow EMA.
2). Condition 2: The ATR is above the defined threshold, confirming that the market is in a downtrend.
When Not to Enter the Trade:
1). Sideways Market: If the ATR is below the threshold, signaling low volatility and sideways or choppy market conditions, the strategy will not trigger any buy or sell signals.
2). False Crossovers: In low volatility conditions, price action tends to be noisy, which could lead to false signals. Therefore, avoiding trades during these periods reduces the risk of false breakouts.
Additional Factors to Consider Adding:
=> RSI (Relative Strength Index): Adding an RSI filter can help confirm overbought or oversold conditions to avoid buying into overextended moves or selling too low.
1). RSI Buy Filter: Only take buy signals when RSI is below 70 (avoiding overbought conditions).
2). RSI Sell Filter: Only take sell signals when RSI is above 30 (avoiding oversold conditions).
=> MACD (Moving Average Convergence Divergence): Using MACD can help validate the strength of the trend.
1). Buy when the MACD histogram is above the zero line and the Fast EMA crosses above the Slow EMA.
2). Sell when the MACD histogram is below the zero line and the Fast EMA crosses below the Slow EMA.
=> Support/Resistance Levels: Adding support and resistance levels can help you understand market structure and decide whether to enter or exit a trade.
1). Buy when price breaks above a significant resistance level (after a valid buy signal).
2). Sell when price breaks below a major support level (after a valid sell signal).
=> Volume: Consider adding a volume filter to ensure that buy/sell signals are supported by strong market participation. You could only take signals if the volume is above the moving average of volume over a certain period.
=> Trailing Stop Loss: Instead of a fixed stop loss, use a trailing stop based on a percentage or ATR to lock in profits as the trade moves in your favor.
=> Exit Signals: Besides the EMA crossover, consider adding Take Profit or Stop Loss levels, or even using a secondary indicator like RSI to signal an overbought/oversold condition and exit the trade.
Example Usage:
=> Buy Example:
1). Fast EMA (20-period) crosses above the Slow EMA (50-period).
2). The ATR is above the threshold, confirming that the market is trending.
3). Optionally, if RSI is below 70, the buy signal is further confirmed as not being overbought.
=> Sell Example:
1). Fast EMA (20-period) crosses below the Slow EMA (50-period).
2). The ATR is above the threshold, confirming that the market is trending.
3). Optionally, if RSI is above 30, the sell signal is further confirmed as not being oversold.
Conclusion:
This strategy helps to identify trending markets and filters out sideways or choppy market conditions. By using Fast and Slow EMAs combined with the ATR volatility filter, it provides a reliable approach to catching trending moves while avoiding false signals during low-volatility, sideways markets.

Averaged Stochastic RSI by TenozenSimplicity beats everything! Averaged Stochastic RSi is calculated using the 2 points of stochastic of the RSI, where the difference is by 2 (larger), and averaged out the stochastic's values. In result it is less noisy and more responsive towards the market's momentum.
I hope you guys find this indicator useful! So far this is the best indicator I ever had! And I also learned that simplicity is better than complex blurry/abstract problems. Ciao!

TrendMasterPro_FekonomiTrend Change and Start Signals with Weighted Conditions
The Trend Change and Start Signals with Weighted Conditions indicator leverages various technical analysis tools to generate reliable buy and sell signals. This indicator helps investors more accurately identify trend changes and start signals in the market.
Features:
Utilizes popular technical analysis tools such as MACD, RSI, EMA, and Ichimoku Cloud.
Enhances signal accuracy with additional indicators like ADX and Volume Increase.
Allows users to adjust the weights of each condition to set their importance.
The Confidence Level parameter lets you adjust the accuracy rate of the signals.
Visual Signals make it easy to track buy and sell points directly on the chart.
How It Works:
Condition Weights: Users assign weights to indicators like MACD, RSI, EMA, and Ichimoku Cloud. If you have no idea, use default settings.
Condition Fulfillment: Checks if the conditions for each indicator are met.
Confidence Level: The total weight of the fulfilled conditions must exceed the user-defined confidence level.
Signal Generation: When these conditions are met, a buy or sell signal is generated and visually displayed on the chart.
Customization:
Personalize Signals: By adjusting the weights of the indicators used, you can personalize the signals to match your trading strategy and preferences.
Use Cases:
Short-Term Investments: Identify quick trend changes for short-term trading decisions.
Long-Term Investments: Detect long-term trend starts and changes for strategic investment decisions.
Technical Analysis: Combine different technical analysis tools for more comprehensive and reliable analyses.
With this indicator, you can better understand market movements and make more informed investment decisions. Try it now and enhance your trading strategy!
by Fekonomi

Liquitive Buy/Sell Dollar AveragerLiquitive Buy/Sell Dollar Averager Indicator
The "Liquitive Buy/Sell Dollar Averager" is a versatile trading tool designed for intraday and multi-timeframe analysis, combining advanced range-bound calculations, RSI normalization, volume spikes, and candle pattern recognition to identify optimal buy and sell conditions. This indicator is particularly suitable for traders employing strategies that focus on dollar-cost averaging, position scaling, and systematic buy/sell decision-making.
Key Features:
Adaptive RSI-Based Levels:
Dynamically calculates inner bounds (IB) and outer bounds (OB) using RSI and price ranges, helping to identify overbought and oversold conditions relative to the price action.
Normalizes RSI values to the price range for seamless visualization overlaid on the chart.
Volume and Candle Analysis:
Detects significant volume spikes relative to a moving average, signaling increased market activity.
Identifies spiking green/red candles to capture momentum-driven price movements.
Dynamic Support and Resistance:
Calculates and plots support and resistance levels based on recent swing highs and lows.
Median and boundary lines help visualize key price levels for decision-making.
Profitability Check:
Buy and Sell Signals:
Checks profitability thresholds based on percentage gains/losses.
Incorporates logic for "time to buy" and "time to sell" using target profit margins.
Implements average move percentage to define realistic thresholds for buy/sell actions.
Time-Based Trading Restrictions:
Configures trading logic to disallow trades after a specific time (e.g., 3:40 PM for intraday sessions).
Ensures logical entry and exit decisions are only made within active trading hours.
Color-Coded Visualization:
Background colors dynamically shift between green (bullish), red (bearish), and neutral, depending on RSI and price position relative to the inner bounds.
Opacity of the background adjusts based on normalized RSI differences to provide a visual cue of market strength.
Customizable Parameters:
Allows user input for key settings like lookback periods, RSI length, percent ranges, volume thresholds, and transparency levels, enabling flexible configuration tailored to individual strategies.
Actionable Alerts and Signals:
Plots "Open Position", "Add to Position", and "Close Position" markers directly on the chart, making it easy to follow systematic trading rules.
How It Works:
Buy Signals:
Triggered when price conditions, volume spikes, and RSI-based thresholds align with profitability metrics.
Designed for dollar-cost averaging, identifying opportunities to add to long positions or open new positions.
Sell Signals:
Evaluates profitability conditions to identify when to close or scale out of positions.
Incorporates real-time evaluation of market momentum and profitability.

RSI+EMA+MZONES with DivergencesFeatures:
1. RSI Calculation:
Uses user-defined periods to calculate the RSI and visualize momentum shifts.
Plots key RSI zones, including upper (overbought), lower (oversold), and middle levels.
2. EMA of RSI:
Includes an Exponential Moving Average (EMA) of the RSI for trend smoothing and confirmation.
3. Bullish and Bearish Divergences:
Detects Regular divergences (labeled as “Bull” and “Bear”) for classic signals.
Identifies Hidden divergences (labeled as “H Bull” and “H Bear”) for potential trend continuation opportunities.
4. Customizable Labels:
Displays divergence labels directly on the chart.
Labels can be toggled on or off for better chart visibility.
5. Alerts:
Predefined alerts for both regular and hidden divergences to notify users in real time.
6. Fully Customizable:
Adjust RSI period, lookback settings, divergence ranges, and visibility preferences.
Colors and styles are easily configurable to match your trading style.
How to Use:
RSI Zones: Use RSI and its zones to identify overbought/oversold conditions.
EMA: Look for crossovers or confluence with divergences for confirmation.
Divergences: Monitor for “Bull,” “Bear,” “H Bull,” or “H Bear” labels to spot key reversal or continuation signals.
Alerts: Set alerts to be notified of divergence opportunities without constant chart monitoring.

RSI BB StdDev SignalOverview
The RSI BB StdDev Signal Indicator is a powerful tool designed to enhance your trading strategy by combining the Relative Strength Index (RSI) with Bollinger Bands (BB). This unique combination allows traders to identify potential buy and sell signals more accurately by leveraging the strengths of both indicators. The RSI helps in identifying overbought and oversold conditions, while the Bollinger Bands provide a dynamic range to assess volatility and potential price reversals.
Key Features
— RSI Calculation: The indicator calculates the RSI based on user-defined parameters, allowing for customization to fit different trading styles.
— Bollinger Bands Integration: The RSI values are smoothed using a moving average, and Bollinger Bands are applied to this smoothed RSI to generate buy and sell signals.
— Divergence Detection: The indicator includes an optional feature to detect and alert on bullish and bearish divergences between the RSI and price action.
— Customizable Alerts: Users can set up alerts for buy and sell signals, as well as for divergences, ensuring they never miss a trading opportunity.
— Visual Aids: The indicator plots the RSI, Bollinger Bands, and signals on the chart, making it easy to visualize and interpret the data.
How It Works
1. RSI Calculation:
— The RSI is calculated using the change in the source input (default is close price) over a specified period.
— The RSI values are then plotted on the chart with customizable overbought and oversold levels.
2. Smoothing and Bollinger Bands:
— The RSI values are smoothed using a moving average (SMA, EMA, SMMA, WMA, VWMA) selected by the user.
— Bollinger Bands are applied to the smoothed RSI to create dynamic upper and lower bands.
3. Signal Generation:
—Buy signals are generated when the RSI crosses above the lower Bollinger Band.
—Sell signals are generated when the RSI crosses below the upper Bollinger Band.
—These signals are plotted on both the RSI pane and the main price chart for easy reference.
4. Divergence Detection:
— The indicator can detect and alert on regular bullish and bearish divergences between the RSI and price action.
— Bullish divergences occur when the price makes a lower low, but the RSI makes a higher low.
— Bearish divergences occur when the price makes a higher high, but the RSI makes a lower high.
Usage
1. Setting Up:
— Add the indicator to your TradingView chart.
— Customize the RSI length, source, and other parameters in the settings panel.
— Enable or disable the divergence detection based on your trading strategy.
2. Interpreting Signals:
— Use the buy and sell signals generated by the RSI crossing the Bollinger Bands as potential entry and exit points.
— Pay attention to divergences for additional confirmation of trend reversals.
3. Alerts:
— Set up alerts for buy and sell signals to receive notifications in real-time.
— Enable divergence alerts to be notified of potential trend reversals.
Conclusion
The RSI BB StdDev Signal Indicator is a comprehensive tool that combines the strengths of the RSI and Bollinger Bands to provide traders with more accurate and reliable signals. Whether you are a beginner or an experienced trader, this indicator can enhance your trading strategy by offering clear visual cues and customizable alerts.
Note
This indicator is provided with open-source code, allowing users to understand its logic and customize it further if needed. The detailed description and customizable settings ensure that traders of all levels can benefit from its unique features.

Multifactor Buy/Sell Strategy V2 | RSI, MACD, ATR, EMA, Boll.BITGET:1INCHUSDT
This Pine Script code for TradingView is a multifactor Buy/Sell indicator that combines several technical factors to generate trading signals based on trend, volatility, and volume conditions. Here’s a breakdown of the main components and functionality:
Indicator Name
- Multifactor Buy/Sell Strategy V2 — an overlay indicator applied directly on the price chart.
### Input Parameters
The script includes multiple customizable parameters:
- RSI, EMA, MACD parameters — for setting periods and signals of MACD and RSI.
- ATR and Bollinger Bands — used for volatility analysis and level determination.
- Minimum Volatility Threshold — sets a minimum Bollinger Band width threshold for determining high volatility.
Core Indicators
1. RSI — calculated to identify oversold (below 30) and overbought (above 70) conditions.
2. EMA and MACD — calculates exponential moving averages and MACD histogram to determine trend direction.
3. ATR and Bollinger Bands — used to assess current volatility and establish dynamic upper and lower bands.
Volatility and Volume Analysis
- Determines the current ATR level and Bollinger Band width to evaluate high volatility.
- Calculates the volume moving average to track periods of increased volume during high volatility.
Trend Analysis
The script uses the difference between fast and slow EMAs to define strong trends:
- Uptrend — when the fast EMA is above the slow EMA, the price is above the fast EMA, and the trend is strong.
- Downtrend — when the fast EMA is below the slow EMA, the price is below the fast EMA, and the trend is strong.
Momentum Filter
- Based on the price change over the last three bars and compared against the minimum volatility threshold to identify strong momentum.
Buy and Sell Signal Generation
- Buy Signal: Uptrend with RSI oversold, positive MACD histogram, high volatility and volume, strong momentum, and sufficient Bollinger Band width.
- Sell Signal: Downtrend with RSI overbought, negative MACD histogram, high volatility and volume, strong momentum, and sufficient Bollinger Band width.
Visualization
- Buy and sell signals are displayed as green and red triangles on the chart.
- Plots for fast and slow EMAs, upper and lower bands, and Bollinger Bands.
Alerts
The script includes alert conditions for buy and sell signals, allowing notifications to be sent via email or mobile app.
Information Panel
A small table on the chart displays current volatility dataThis Pine Script code for TradingView is a multifactor Buy/Sell indicator that combines several technical factors to generate trading signals based on trend, volatility, and volume conditions. Here’s a breakdown of the main components and functionality:
Indicator Name
- Multifactor Buy/Sell Strategy V2 — an overlay indicator applied directly on the price chart.
Input Parameters
The script includes multiple customizable parameters:
- **RSI, EMA, MACD parameters** — for setting periods and signals of MACD and RSI.
- **ATR and Bollinger Bands** — used for volatility analysis and level determination.
- **Minimum Volatility Threshold** — sets a minimum Bollinger Band width threshold for determining high volatility.
Core Indicators
1. RSI — calculated to identify oversold (below 30) and overbought (above 70) conditions.
2. EMA and MACD — calculates exponential moving averages and MACD histogram to determine trend direction.
3. ATR and Bollinger Bands — used to assess current volatility and establish dynamic upper and lower bands.
Volatility and Volume Analysis
- Determines the current ATR level and Bollinger Band width to evaluate high volatility.
- Calculates the volume moving average to track periods of increased volume during high volatility.
Trend Analysis
The script uses the difference between fast and slow EMAs to define strong trends:
- Uptrend — when the fast EMA is above the slow EMA, the price is above the fast EMA, and the trend is strong.
- Downtrend — when the fast EMA is below the slow EMA, the price is below the fast EMA, and the trend is strong.
Momentum Filter
- Based on the price change over the last three bars and compared against the minimum volatility threshold to identify strong momentum.
Buy and Sell Signal Generation
- Buy Signal: Uptrend with RSI oversold, positive MACD histogram, high volatility and volume, strong momentum, and sufficient Bollinger Band width.
- Sell Signal: Downtrend with RSI overbought, negative MACD histogram, high volatility and volume, strong momentum, and sufficient Bollinger Band width.
Visualization
- Buy and sell signals are displayed as green and red triangles on the chart.
- Plots for fast and slow EMAs, upper and lower bands, and Bollinger Bands.
Alerts
The script includes alert conditions for buy and sell signals, allowing notifications to be sent via email or mobile app.
Information Panel
A small table on the chart displays current volatility
- Volatility Status — indicates high or low volatility.
- Bollinger Band Width — current width as a percentage.
- ATR Ratio — ratio of current ATR to long-term average ATR.
This script is suitable for trading in high-volatility conditions, combining multiple filters and factors to generate precise buy and sell signals.

Gabriel's Cyclic Smoothed RSI [Enhanced]Overview
Gabriel's Cyclic Smoothed RSI (short title: cRSI ) is a sophisticated technical indicator developed to provide traders with deeper insights into market rhythms and price momentum. Building upon the traditional Relative Strength Index (RSI), this enhanced version incorporates dynamic cycle analysis, divergence detection, and optional stochastic oscillators to deliver a more nuanced understanding of market conditions.
Key Features
Cyclic Smoothed RSI (cRSI):
Adaptive Momentum: The cRSI adapts to the dominant market cycle, providing a smoothed RSI that reacts dynamically to price changes.
Ultra-Smooth & Zero-Lag: Designed to minimize lag, ensuring timely signals that closely follow price movements.
Accurate Divergence Detection: Identifies both regular and hidden bullish/bearish divergences, enhancing signal reliability.
Dynamic Overbought/Oversold Bands:
Customizable Thresholds: Set dynamic overbought and oversold levels based on market rhythm analysis.
Adaptive Bands: Bands adjust according to the dominant cycle, offering a more accurate representation of market extremes.
Stochastic cRSI & KDJ Oscillator (Optional):
Enhanced Oscillators: Incorporate stochastic and KDJ oscillators for additional momentum analysis.
Ribbon Displays: Visual ribbons provide clarity on oscillator trends and potential reversal points.
Divergence Detection:
Regular & Hidden Divergences: Detects both regular and hidden bullish/bearish divergences to anticipate potential trend reversals.
Customizable Lookback: Adjust pivot lookback periods to fine-tune divergence sensitivity.
Visual Enhancements:
Triangles & Labels: Visual signals in the form of triangles and labels indicate buy/sell opportunities and divergence events.
Bar Coloring: Option to color bars based on signal strength, providing immediate visual cues.
Alert Conditions:
Custom Alerts: Set up alerts for various signal types, including strong buy/sell signals and divergence events, ensuring you never miss critical market movements.
Input Settings
cRSI Settings
Source: Select the data source for calculations (e.g., Close, Open, High, Low, HLC3, OHLC4).
Dominant Cycle Length: Define the dominant market cycle length based on rhythm analysis.
Vibration: Adjusts the sensitivity of the cRSI to price changes.
Leveling %: Determines the percentage level for dynamic band adjustments.
Show cRSI Plot: Toggle the display of the cRSI line.
Show Cyclic Smoothed Bands: Toggle the display of dynamic overbought and oversold bands.
Show Trend Fill: Enable or disable the trend fill cloud between upper and lower bands.
MA Settings
MA Type: Choose the type of Moving Average (SMA, Bollinger Bands, EMA, SMMA (RMA), WMA, VWMA) to smooth the cRSI.
MA Length: Set the length of the Moving Average.
BB StdDev: Define the standard deviation multiplier for Bollinger Bands.
Show cRSI-based MA: Toggle the display of the cRSI-based Moving Average line.
Stochastic Settings
Show Stochastic cRSI: Enable the stochastic oscillator based on cRSI.
Ribbon: Enable ribbon display for the Stochastic oscillator.
Show KDJ: Toggle the display of the KDJ oscillator.
KDJ Ribbon: Enable ribbon display for the KDJ oscillator.
Stochastic Length: Set the length for the Stochastic calculation.
%K Smoothing: Define the smoothing period for %K.
%D Smoothing: Define the smoothing period for %D.
Stoch Scaling %: Adjusts the vertical scaling of the stochastic to prevent distortion.
Overbought/Oversold Settings
Overbought: Set the Overbought threshold for the cRSI.
OB Extreme: Define the Extreme Overbought threshold for the Stochastic cRSI.
Oversold: Set the Oversold threshold for the cRSI.
OS Extreme: Define the Extreme Oversold threshold for the Stochastic cRSI.
Divergence Settings
Pivot Lookback Right: Number of bars to the right of the pivot for divergence detection.
Pivot Lookback Left: Number of bars to the left of the pivot for divergence detection.
Max of Lookback Range: Maximum number of bars to look back for divergence detection.
Min of Lookback Range: Minimum number of bars to look back for divergence detection.
Plot Bullish: Enable plotting of bullish divergence signals.
Plot Hidden Bullish: Enable plotting of hidden bullish divergence signals.
Plot Bearish: Enable plotting of bearish divergence signals.
Plot Hidden Bearish: Enable plotting of hidden bearish divergence signals.
Delay Plot Until Candle is Closed: Prevents repainting by delaying the plotting of divergence signals until the candle is fully closed.

Daksh RSI POINT to ShootHere are the key points and features of the Pine Script provided:
### 1. **Indicator Settings**:
- The indicator is named **"POINT and Shoot"** and is set for non-overlay (`overlay=false`) on the chart.
- `max_bars_back=4000` is defined, indicating the maximum number of bars that the script can reference.
### 2. **Input Parameters**:
- `Src` (Source): The price source, default is `close`.
- `rsilen` (RSI Length): The length for calculating RSI, default is 20.
- `linestylei`: Style for the trend lines (`Solid` or `Dashed`).
- `linewidth`: Width of the plotted lines, between 1 and 4.
- `showbroken`: Option to show broken trend lines.
- `extendlines`: Option to extend trend lines.
- `showpivot`: Show pivot points (highs and lows).
- `showema`: Show a weighted moving average (WMA) line.
- `len`: Length for calculating WMA, default is 9.
### 3. **RSI Calculation**:
- Calculates a custom RSI value using relative moving averages (`ta.rma`), and optionally uses On-Balance Volume (`ta.obv`) if `indi` is set differently.
- Plots RSI values as a green or red line depending on its position relative to the WMA.
### 4. **Pivot Points**:
- Utilizes the `ta.pivothigh` and `ta.pivotlow` functions to detect pivot highs and lows over the defined period.
- Stores up to 10 recent pivot points for highs and lows.
### 5. **Trend Line Drawing**:
- Lines are drawn based on pivot highs and lows.
- Calculates potential trend lines using linear interpolation and validates them by checking if subsequent bars break or respect the trend.
- If the trend is broken, and `showbroken` is enabled, it draws dotted lines to represent these broken trends.
### 6. **Line Management**:
- Initializes multiple lines (`l1` to `l20` and `t1` to `t20`) and uses these lines for drawing uptrend and downtrend lines.
- The maximum number of lines is set to 20 for uptrends and 20 for downtrends, due to a limit on the total number of lines that can be displayed on the chart.
### 7. **Line Style and Color**:
- Defines different colors for uptrend lines (`ulcolor = color.red`) and downtrend lines (`dlcolor = color.blue`).
- Line styles are determined by user input (`linestyle`) and use either solid or dashed patterns.
- Broken lines use a dotted style to indicate invalidated trends.
### 8. **Pivot Point Plotting**:
- Plots labels "H" and "L" for pivot highs and lows, respectively, to visually indicate turning points on the chart.
### 9. **Utility Functions**:
- Uses helper functions to get the values and positions of the last 10 pivot points, such as `getloval`, `getlopos`, `gethival`, and `gethipos`.
- The script uses custom logic for line placement based on whether the pivots are lower lows or higher highs, with lines adjusted dynamically based on price movement.
### 10. **Plotting and Visuals**:
- The main RSI line is plotted using a color gradient based on its position relative to the WMA.
- Horizontal lines (`hline1` and `hline2`) are used for visual reference at RSI levels of 60 and 40.
- Filled regions between these horizontal lines provide visual cues for potential overbought or oversold zones.
These are the main highlights of the script, which focuses on trend detection, visualization of pivot points, and dynamic line plotting based on price action.

Super RSI: Multi-Timeframe, Multi-RSI-MA, Multi Symbol [DucTri]█ Overview
RSI is a very popular indicator that almost every trader knows about. I created this indicator with the goal of helping you use RSI more conveniently and effectively.
█ Uses
Monitor the RSI of 10 currency pairs simultaneously.
The first column shows the RSI of the current currency pair.
RSI below 30 will have a Red background, and above 70 will have a Green background.
Display multiple RSI lines with different lengths (or timeframes).
Displays 3 RSI with 3 different lengths 7, 14 and 21
Displays two RSI lines with two different timeframes. The purple line shows RSI (14) for the 1H timeframe, and the blue line shows RSI (14) for the 4H timeframe.
Display MA and Bollinger Band lines for RSI.
Shows the RSI line along with two MA lines of the RSI: EMA (9) in blue and WMA (45) in red.
Identify RSI Divergence with custom settings
█ Input
- You can have up to three RSI lines, with customizable lengths and timeframes.
- You also have up to three RSI-MA lines, where you can customize the MA type and length.
- You can track RSI for up to 10 currency pairs at the same time.
- Additionally, you can change how the top (or bottom) is determined when identifying divergence.
█ Alerts
Send alerts when two RSI lines cross. For example, when the RSI 14 crosses above the RSI 21, or the RSI on the 1H timeframe crosses above the RSI on the 4H timeframe.*
Send alerts when RSI crosses above or below the RSI-MA line.
Send alerts when two RSI-MA lines cross. For example, when the RSI-EMA (9) crosses above the RSI-WMA (45).*
Send alerts when Divergence (Convergence) appears.
Send alerts when any currency pair in the monitored list shows an Overbought or Oversold signal.

WaveTrend With Divs & RSI(STOCH) Divs by WeloTradesWaveTrend with Divergences & RSI(STOCH) Divergences by WeloTrades
Overview
The "WaveTrend With Divergences & RSI(STOCH) Divergences" is an advanced Pine Script™ indicator designed for TradingView, offering a multi-dimensional analysis of market conditions. This script integrates several technical indicators—WaveTrend, Money Flow Index (MFI), RSI, and Stochastic RSI—into a cohesive tool that identifies both regular and hidden divergences across these indicators. These divergences can indicate potential market reversals and provide critical trading opportunities.
This indicator is not just a simple combination of popular tools; it offers extensive customization options, organized data presentation, and valuable trading signals that are easy to interpret. Whether you're a day trader or a long-term investor, this script enhances your ability to make informed decisions.
Originality and Usefulness
The originality of this script lies in its integration and the synergy it creates among the indicators used. Rather than merely combining multiple indicators, this script allows them to work together, enhancing each other's strengths. For example, by identifying divergences across WaveTrend, RSI, and Stochastic RSI simultaneously, the script provides multiple layers of confirmation, which reduces the likelihood of false signals and increases the reliability of trading signals.
The usefulness of this script is apparent in its ability to offer a consolidated view of market dynamics. It not only simplifies the analytical process by combining different indicators but also provides deeper insights through its divergence detection features. This comprehensive approach is designed to help traders identify potential market reversals, confirm trends, and ultimately make more informed trading decisions.
How the Components Work Together
1. Cross-Validation of Signals
WaveTrend: This indicator is primarily used to identify overbought and oversold conditions, as well as potential buy and sell signals. WaveTrend's ability to smooth price data and reduce noise makes it a reliable tool for identifying trend reversals.
RSI & Stochastic RSI: These momentum oscillators are used to measure the speed and change of price movements. While RSI identifies general overbought and oversold conditions, Stochastic RSI offers a more granular view by tracking the RSI’s level relative to its high-low range over a period of time. When these indicators align with WaveTrend signals, it adds a layer of confirmation that enhances the reliability of the signals.
Money Flow Index (MFI): This volume-weighted indicator assesses the inflow and outflow of money in an asset, giving insights into buying and selling pressure. By analyzing the MFI alongside WaveTrend and RSI indicators, the script can cross-validate signals, ensuring that buy or sell signals are supported by actual market volume.
Example Bullish scenario:
When a bullish divergence is detected on the RSI and confirmed by a corresponding bullish signal on the WaveTrend, along with an increasing Money Flow Index, the probability of a successful trade setup increases. This cross-validation minimizes the risk of acting on false signals, which might occur when relying on a single indicator.
Example Bearish scenario:
When a bearish divergence is detected on the RSI and confirmed by a corresponding bearish signal on the WaveTrend, along with an decreasing Money Flow Index, the probability of a successful trade setup increases. This cross-validation minimizes the risk of acting on false signals, which might occur when relying on a single indicator.
2. Divergence Detection and Market Reversals
Regular Divergences: Occur when the price action and an indicator (like RSI or WaveTrend) move in opposite directions. Regular bullish divergence signals a potential upward reversal when the price makes a lower low while the indicator makes a higher low. Conversely, regular bearish divergence suggests a downward reversal when the price makes a higher high, but the indicator makes a lower high.
Hidden Divergences: These occur when the price action and indicator move in the same direction, but with different momentum. Hidden bullish divergence suggests the continuation of an uptrend, while hidden bearish divergence suggests the continuation of a downtrend. By detecting these divergences across multiple indicators, the script identifies potential trend reversals or continuations with greater accuracy.
Example: The script might detect a regular bullish divergence on the WaveTrend while simultaneously identifying a hidden bullish divergence on the RSI. This combination suggests that while a trend reversal is possible, the overall market sentiment remains bullish, providing a nuanced view of the market.
A Regular Bullish Divergence Example:
A Hidden Bullish Divergence Example:
A Regular Bearish Divergence Example:
A Hidden Bearish Divergence Example:
3. Trend Strength and Sentiment Analysis
WaveTrend: Measures the strength and direction of the trend. By identifying the extremes of market sentiment (overbought and oversold levels), WaveTrend provides early signals for potential reversals.
Money Flow Index (MFI): Assesses the underlying sentiment by analyzing the flow of money. A rising MFI during an uptrend confirms strong buying pressure, while a falling MFI during a downtrend confirms selling pressure. This helps traders assess whether a trend is likely to continue or reverse.
RSI & Stochastic RSI: Offer a momentum-based perspective on the trend’s strength. High RSI or Stochastic RSI values indicate that the asset may be overbought, suggesting a potential reversal. Conversely, low values indicate oversold conditions, signaling a possible upward reversal.
Example:
During a strong uptrend, the WaveTrend & RSI's might signal overbought conditions, suggesting caution. If the MFI also shows decreasing buying pressure and the RSI reaches extreme levels, these indicators together suggest that the trend might be weakening, and a reversal could be imminent.
Example:
During a strong downtrend, the WaveTrend & RSI's might signal oversold conditions, suggesting caution. If the MFI also shows increasing buying pressure and the RSI reaches extreme levels, these indicators together suggest that the trend might be weakening, and a reversal could be imminent.
Conclusion
The "WaveTrend With Divergences & RSI(STOCH) Divergences" script offers a powerful, integrated approach to technical analysis by combining trend, momentum, and sentiment indicators into a single tool. Its unique value lies in the cross-validation of signals, the ability to detect divergences, and the comprehensive view it provides of market conditions. By offering traders multiple layers of analysis and customization options, this script is designed to enhance trading decisions, reduce false signals, and provide clearer insights into market dynamics.
WAVETREND
Display of WaveTrend:
Display of WaveTrend Setting:
WaveTrend Indicator Explanation
The WaveTrend indicator helps identify overbought and oversold conditions, as well as potential buy and sell signals. Its flexibility allows traders to adapt it to various strategies, making it a versatile tool in technical analysis.
WaveTrend Input Settings:
WT MA Source: Default: HLC3
What it is: The data source used for calculating the WaveTrend Moving Average.
What it does: Determines the input data to smooth price action and filter noise.
Example: Using HLC3 (average of High, Low, Close) provides a smoother data representation compared to using just the closing price.
Length (WT MA Length): Default: 3
What it is: The period used to calculate the Moving Average.
What it does: Adjusts the sensitivity of the WaveTrend indicator, where shorter lengths respond more quickly to price changes.
Example: A length of 3 is ideal for short-term analysis, providing quick reactions to price movements.
WT Channel Length & Average: Default: WT Channel Length = 9, Average = 12
What it is: Lengths used to calculate the WaveTrend channel and its average.
What it does: Smooths out the WaveTrend further, reducing false signals by averaging over a set period.
Example: Higher values reduce noise and help in identifying more reliable trends.
Channel: Style, Width, and Color:
What it is: Customization options for the WaveTrend channel's appearance.
What it does: Adjusts how the channel is displayed, including line style, width, and color.
Example: Choosing an area style with a distinct color can make the WaveTrend indicator clearly visible on the chart.
WT Buy & Sell Signals:
What it is: Settings to enable and customize buy and sell signals based on WaveTrend.
What it does: Allows for the display of buy/sell signals and customization of their shapes and colors.
When it gives a Buy Signal: Generated when the WaveTrend line crosses below an oversold level and then rises back, indicating a potential upward price movement.
When it gives a Sell Signal: Triggered when the WaveTrend line crosses above an overbought level and then declines, suggesting a possible downward trend.
Example: The script identifies these signals based on mean reversion principles, where prices tend to revert to the mean after reaching extremes. Traders can use these signals to time their entries and exits effectively.
WAVETREND OVERBOUGTH AND OVERSOLD LEVELS
Display of WaveTrend with Overbought & Oversold Levels:
Display of WaveTrend Overbought & Oversold Levels Settings:
WaveTrend Overbought & Oversold Levels Explanation
WT OB & OS Levels: Default: OB Level 1 = 53, OB Level 2 = 60, OS Level 1 = -53, OS Level 2 = -60
What it is: The default overbought and oversold levels used by the WaveTrend indicator to signal potential market reversals.
What it does: When the WaveTrend crosses above the OB levels, it indicates an overbought condition, potentially signaling a reversal or selling opportunity. Conversely, when it crosses below the OS levels, it indicates an oversold condition, potentially signaling a reversal or buying opportunity.
Example: A trader might use these levels to time entry or exit points, such as selling when the WaveTrend crosses into the overbought zone or buying when it crosses into the oversold zone.
Show OB/OS Levels: Default: True
What it is: Toggle options to show or hide the overbought and oversold levels on your chart.
What it does: When enabled, these levels will be visually represented on your chart, helping you to easily identify when the market reaches these critical thresholds.
Example: Displaying these levels can help you quickly see when the WaveTrend is approaching or has crossed into overbought or oversold territory, allowing for more informed trading decisions.
Line Style, Width, and Color for OB/OS Levels:
What it is: Options to customize the appearance of the OB and OS levels on your chart, including line style (solid, dotted, dashed), line width, and color.
What it does: These settings allow you to adjust how prominently these levels are displayed on your chart, which can help you better visualize and respond to overbought or oversold conditions.
Example: Setting a thicker, dashed line in a contrasting color can make these levels stand out more clearly, aiding in quick visual identification.
Example of Use:
Scenario: A trader wants to identify potential selling points when the market is overbought. They set the OB levels at 53 and 60, choosing a solid, red line style to make these levels clear on their chart. As the WaveTrend crosses above 53, they monitor for further price action, and upon crossing 60, they consider initiating a sell order.
WAVETREND DIVERGENCES
Display of WaveTrend Divergence:
Display of WaveTrend Divergence Setting:
WaveTrend Divergence Indicator Explanation
The WaveTrend Divergence feature helps identify potential reversal points in the market by highlighting divergences between the price and the WaveTrend indicator. Divergences can signal a shift in market momentum, indicating a possible trend reversal. This component allows traders to visualize and customize divergence detection on their charts.
WaveTrend Divergence Input Settings:
Potential Reversal Range: Default: 28
What it is: The number of bars to look back when detecting potential tops and bottoms.
What it does: Sets the range for identifying possible reversal points based on historical data.
Example: A setting of 28 looks back across the last 28 bars to find reversal points, offering a balance between responsiveness and reliability.
Reversal Minimum LVL OB & OS: Default: OB = 35, OS = -35
What it is: The minimum overbought and oversold levels required for detecting potential reversals.
What it does: Adjusts the thresholds that trigger a reversal signal based on the WaveTrend indicator.
Example: A higher OB level reduces the sensitivity to overbought conditions, potentially filtering out false reversal signals.
Lookback Bar Left & Right: Default: Left = 10, Right = 1
What it is: The number of bars to the left and right used to confirm a top or bottom.
What it does: Helps determine the position of peaks and troughs in the price action.
Example: A larger left lookback captures more extended price action before the peak, while a smaller right lookback focuses on the immediate past.
Lookback Range Min & Max: Default: Min = 5, Max = 60
What it is: The minimum and maximum range for the lookback period when identifying divergences.
What it does: Fine-tunes the detection of divergences by controlling the range over which the indicator looks back.
Example: A wider range increases the chances of detecting divergences across different market conditions.
R.Div Minimum LVL OB & OS: Default: OB = 53, OS = -53
What it is: The threshold levels for detecting regular divergences.
What it does: Adjusts the sensitivity of the regular divergence detection.
Example: Higher thresholds make the detection more conservative, identifying only stronger divergence signals.
H.Div Minimum LVL OB & OS: Default: OB = 20, OS = -20
What it is: The threshold levels for detecting hidden divergences.
What it does: Similar to regular divergence settings but for hidden divergences, which can indicate potential reversals that are less obvious.
Example: Lower thresholds make the hidden divergence detection more sensitive, capturing subtler market shifts.
Divergence Label Options:
What it is: Options to display and customize labels for regular and hidden divergences.
What it does: Allows users to visually differentiate between regular and hidden divergences using customizable labels and colors.
Example: Using different colors and symbols for regular (R) and hidden (H) divergences makes it easier to interpret signals on the chart.
Text Size and Color:
What it is: Customization options for the size and color of divergence labels.
What it does: Adjusts the readability and visibility of divergence labels on the chart.
Example: Larger text size may be preferred for charts with a lot of data, ensuring divergence labels stand out clearly.
FAST & SLOW MONEY FLOW INDEX
Display of Fast & Slow Money Flow:
Display of Fast & Slow Money Flow Setting:
Fast Money Flow Indicator Explanation
The Fast Money Flow indicator helps traders identify the flow of money into and out of an asset over a shorter time frame. By tracking the volume-weighted average of price movements, it provides insights into buying and selling pressure in the market, which can be crucial for making timely trading decisions.
Fast Money Flow Input Settings:
Fast Money Flow: Length: Default: 9
What it is: The period used for calculating the Fast Money Flow.
What it does: Determines the sensitivity of the Money Flow calculation. A shorter length makes the indicator more responsive to recent price changes, while a longer length provides a smoother signal.
Example: A length of 9 is suitable for traders looking to capture quick shifts in market sentiment over a short period.
Fast MFI Area Multiplier: Default: 5
What it is: A multiplier applied to the Money Flow area calculation.
What it does: Adjusts the size of the Money Flow area on the chart, effectively amplifying or reducing the visual impact of the indicator.
Example: A higher multiplier can make the Money Flow more prominent on the chart, aiding in the quick identification of significant money flow changes.
Y Position (Y Pos): Default: 0
What it is: The vertical position adjustment for the Fast Money Flow plot on the chart.
What it does: Allows you to move the Money Flow plot up or down on the chart to avoid overlap with other indicators.
Example: Adjusting the Y Position can be useful if you have multiple indicators on the chart and need to maintain clarity.
Fast MFI Style, Width, and Color:
What it is: Customization options for how the Fast Money Flow is displayed on the chart.
What it does: Enables you to choose between different plot styles (line or area), set the line width, and select colors for positive and negative money flow.
Example: Using different colors for positive (green) and negative (red) money flow helps to visually distinguish between periods of buying and selling pressure.
Slow Money Flow Indicator Explanation
The Slow Money Flow indicator tracks the flow of money into and out of an asset over a longer time frame. It provides a broader perspective on market sentiment, smoothing out short-term fluctuations and highlighting longer-term trends.
Slow Money Flow Input Settings:
Slow Money Flow: Length: Default: 12
What it is: The period used for calculating the Slow Money Flow.
What it does: A longer period smooths out short-term fluctuations, providing a clearer view of the overall money flow trend.
Example: A length of 12 is often used by traders looking to identify sustained trends rather than short-term volatility.
Slow MFI Area Multiplier: Default: 5
What it is: A multiplier applied to the Slow Money Flow area calculation.
What it does: Adjusts the size of the Money Flow area on the chart, helping to emphasize the indicator’s significance.
Example: Increasing the multiplier can help highlight the Money Flow in markets with less volatile price action.
Y Position (Y Pos): Default: 0
What it is: The vertical position adjustment for the Slow Money Flow plot on the chart.
What it does: Allows for vertical repositioning of the Money Flow plot to maintain chart clarity when used with other indicators.
Example: Adjusting the Y Position ensures that the Slow Money Flow indicator does not overlap with other key indicators on the chart.
Slow MFI Style, Width, and Color:
What it is: Customization options for the visual display of the Slow Money Flow on the chart.
What it does: Allows you to choose the plot style (line or area), set the line width, and select colors to differentiate positive and negative money flow.
Example: Customizing the colors for the Slow Money Flow allows traders to quickly distinguish between buying and selling trends in the market.
RSI
Display of RSI:
Display of RSI Setting:
RSI Indicator Explanation
The Relative Strength Index (RSI) is a momentum oscillator that measures the speed and change of price movements. It is typically used to identify overbought or oversold conditions in the market, providing traders with potential signals for buying or selling.
RSI Input Settings:
RSI Source: Default: Close
What it is: The data source used for calculating the RSI.
What it does: Determines which price data (e.g., close, open) is used in the RSI calculation, affecting how the indicator reflects market conditions.
Example: Using the closing price is standard practice, as it reflects the final agreed-upon price for a given time period.
MA Type (Moving Average Type): Default: SMA
What it is: The type of moving average applied to the RSI for smoothing purposes.
What it does: Changes the smoothing technique of the RSI, impacting how quickly the indicator responds to price movements.
Example: Using an Exponential Moving Average (EMA) will make the RSI more sensitive to recent price changes compared to a Simple Moving Average (SMA).
RSI Length: Default: 14
What it is: The period over which the RSI is calculated.
What it does: Adjusts the sensitivity of the RSI. A shorter length (e.g., 7) makes the RSI more responsive to recent price changes, while a longer length (e.g., 21) smooths out the indicator, reducing the number of signals.
Example: A 14-period RSI is commonly used for identifying overbought and oversold conditions, providing a balance between sensitivity and reliability.
RSI Plot Style, Width, and Color:
What it is: Options to customize the appearance of the RSI line on the chart.
What it does: Allows you to adjust the visual representation of the RSI, including the line width and color.
Example: Setting a thicker line width and a bright color like yellow can make the RSI more visible on the chart, aiding in quick analysis.
Display of RSI with RSI Moving Average:
RSI Moving Average Explanation
The RSI Moving Average adds a smoothing layer to the RSI, helping to filter out noise and provide clearer signals. It is particularly useful for confirming trend strength and identifying potential reversals.
RSI Moving Average Input Settings:
MA Length: Default: 14
What it is: The period over which the Moving Average is calculated on the RSI.
What it does: Adjusts the smoothing of the RSI, helping to reduce false signals and provide a clearer trend indication.
Example: A 14-period moving average on the RSI can smooth out short-term fluctuations, making it easier to spot genuine overbought or oversold conditions.
MA Plot Style, Width, and Color:
What it is: Customization options for how the RSI Moving Average is displayed on the chart.
What it does: Allows you to adjust the line width and color, helping to differentiate the Moving Average from the main RSI line.
Example: Using a contrasting color for the RSI Moving Average (e.g., magenta) can help it stand out against the main RSI line, making it easier to interpret the indicator.
STOCHASTIC RSI
Display of Stochastic RSI:
Display of Stochastic RSI Setting:
Stochastic RSI Indicator Explanation
The Stochastic RSI (Stoch RSI) is a momentum oscillator that measures the level of the RSI relative to its high-low range over a set period of time. It is used to identify overbought and oversold conditions, providing potential buy and sell signals based on momentum shifts.
Stochastic RSI Input Settings:
Stochastic RSI Length: Default: 14
What it is: The period over which the Stochastic RSI is calculated.
What it does: Adjusts the sensitivity of the Stochastic RSI. A shorter length makes the indicator more responsive to recent price changes, while a longer length smooths out the fluctuations, reducing noise.
Example: A length of 14 is commonly used to identify momentum shifts over a medium-term period, providing a balanced view of potential overbought or oversold conditions.
Display of Stochastic RSI %K Line:
Stochastic RSI %K Line Explanation
The %K line in the Stochastic RSI is the main line that tracks the momentum of the RSI over the chosen period. It is the faster-moving component of the Stochastic RSI, often used to identify entry and exit points.
Stochastic RSI %K Input Settings:
%K Length: Default: 3
What it is: The period used for smoothing the %K line of the Stochastic RSI.
What it does: Smoothing the %K line helps reduce noise and provides a clearer signal for potential market reversals.
Example: A smoothing length of 3 is common, offering a balance between responsiveness and noise reduction, making it easier to spot significant momentum shifts.
%K Plot Style, Width, and Color:
What it is: Customization options for the visual representation of the %K line.
What it does: Allows you to adjust the appearance of the %K line on the chart, including line width and color, to fit your visual preferences.
Example: Setting a blue color and a medium width for the %K line makes it stand out clearly on the chart, helping to identify key points of momentum change.
%K Fill Color (Above):
What it is: The fill color that appears above the %K line on the chart.
What it does: Adds visual clarity by shading the area above the %K line, making it easier to interpret the direction and strength of momentum.
Example: Using a light blue fill color above the %K line can help emphasize bullish momentum, making it visually prominent.
Display of Stochastic RSI %D Line:
Stochastic RSI %D Line Explanation
The %D line in the Stochastic RSI is a moving average of the %K line and acts as a signal line. It is slower-moving compared to the %K line and is often used to confirm signals or identify potential reversals when it crosses the %K line.
Stochastic RSI %D Input Settings:
%D Length: Default: 3
What it is: The period used for smoothing the %D line of the Stochastic RSI.
What it does: Smooths out the %D line, making it less sensitive to short-term fluctuations and more reliable for identifying significant market signals.
Example: A length of 3 is often used to provide a smoothed signal line that can help confirm trends or reversals indicated by the %K line.
%D Plot Style, Width, and Color:
What it is: Customization options for the visual representation of the %D line.
What it does: Allows you to adjust the appearance of the %D line on the chart, including line width and color, to match your preferences.
Example: Setting an orange color and a thicker line width for the %D line can help differentiate it from the %K line, making crossover points easier to spot.
%D Fill Color (Below):
What it is: The fill color that appears below the %D line on the chart.
What it does: Adds visual clarity by shading the area below the %D line, making it easier to interpret bearish momentum.
Example: Using a light orange fill color below the %D line can highlight bearish conditions, making it visually easier to identify.
RSI & STOCHASTIC RSI OVERBOUGHT AND OVERSOLD LEVELS
Display of RSI & Stochastic with Overbought & Oversold Levels:
Display of RSI & Stochastic Overbought & Oversold Settings:
RSI & Stochastic Overbought & Oversold Levels Explanation
The Overbought (OB) and Oversold (OS) levels for RSI and Stochastic RSI indicators are key thresholds that help traders identify potential reversal points in the market. These levels are used to determine when an asset is likely overbought or oversold, which can signal a potential trend reversal.
RSI & Stochastic Overbought & Oversold Input Settings:
RSI & Stochastic Level 1 Overbought (OB) & Oversold (OS): Default: OB Level = 170, OS Level = 130
What it is: The first set of thresholds for determining overbought and oversold conditions for both RSI and Stochastic RSI indicators.
What it does: When the RSI or Stochastic RSI crosses above the overbought level, it suggests that the asset might be overbought, potentially signaling a sell opportunity. Conversely, when these indicators drop below the oversold level, it suggests the asset might be oversold, potentially signaling a buy opportunity.
Example: If the RSI crosses above 170, traders might look for signs of a potential trend reversal to the downside, while a cross below 130 might indicate a reversal to the upside.
RSI & Stochastic Level 2 Overbought (OB) & Oversold (OS): Default: OB Level = 180, OS Level = 120
What it is: The second set of thresholds for determining overbought and oversold conditions for both RSI and Stochastic RSI indicators.
What it does: These levels provide an additional set of reference points, allowing traders to differentiate between varying degrees of overbought and oversold conditions, potentially leading to more refined trading decisions.
Example: When the RSI crosses above 180, it might indicate an extreme overbought condition, which could be a stronger signal for a sell, while a cross below 120 might indicate an extreme oversold condition, which could be a stronger signal for a buy.
RSI & Stochastic Overbought (OB) Band Customization:
OB Level 1: Width, Style, and Color:
What it is: Customization options for the visual appearance of the first overbought band on the chart.
What it does: Allows you to set the line width, style (solid, dotted, dashed), and color for the first overbought band, enhancing its visibility on the chart.
Example: A dashed red line with medium width can clearly indicate the first overbought level, helping traders quickly identify when this threshold is crossed.
OB Level 2: Width, Style, and Color:
What it is: Customization options for the visual appearance of the second overbought band on the chart.
What it does: Allows you to set the line width, style, and color for the second overbought band, providing a clear distinction from the first band.
Example: A dashed red line with a slightly thicker width can represent a more significant overbought level, making it easier to differentiate from the first level.
RSI & Stochastic Oversold (OS) Band Customization:
OS Level 1: Width, Style, and Color:
What it is: Customization options for the visual appearance of the first oversold band on the chart.
What it does: Allows you to set the line width, style (solid, dotted, dashed), and color for the first oversold band, making it visually prominent.
Example: A dashed green line with medium width can highlight the first oversold level, helping traders identify potential buying opportunities.
OS Level 2: Width, Style, and Color:
What it is: Customization options for the visual appearance of the second oversold band on the chart.
What it does: Allows you to set the line width, style, and color for the second oversold band, providing an additional visual cue for extreme oversold conditions.
Example: A dashed green line with a thicker width can represent a more significant oversold level, offering a stronger visual cue for potential buying opportunities.
RSI DIVERGENCES
Display of RSI Divergence Labels:
Display of RSI Divergence Settings:
RSI Divergence Lookback Explanation
The RSI Divergence settings allow traders to customize the parameters for detecting divergences between the RSI (Relative Strength Index) and price action. Divergences occur when the price moves in the opposite direction to the RSI, potentially signaling a trend reversal. These settings help refine the accuracy of divergence detection by adjusting the lookback period and range. ( NOTE: This setting only imply to the RSI. This doesn't effect the STOCHASTIC RSI. )
RSI Divergence Lookback Input Settings:
Lookback Left: Default: 10
What it is: The number of bars to look back from the current bar to detect a potential divergence.
What it does: Defines the left-side lookback period for identifying pivot points in the RSI, which are used to spot divergences. A longer lookback period may capture more significant trends but could also miss shorter-term divergences.
Example: A setting of 10 bars means the script will consider pivot points up to 10 bars before the current bar to check for divergence patterns.
Lookback Right: Default: 1
What it is: The number of bars to look forward from the current bar to complete the divergence pattern.
What it does: Defines the right-side lookback period for confirming a potential divergence. This setting helps ensure that the identified divergence is valid by allowing the script to check subsequent bars for confirmation.
Example: A setting of 1 bar means the script will look at the next bar to confirm the divergence pattern, ensuring that the signal is reliable.
Lookback Range Min: Default: 5
What it is: The minimum range of bars required to detect a valid divergence.
What it does: Sets a lower bound on the range of bars considered for divergence detection. A lower minimum range might capture more frequent but possibly less significant divergences.
Example: Setting the minimum range to 5 ensures that only divergences spanning at least 5 bars are considered, filtering out very short-term patterns.
Lookback Range Max: Default: 60
What it is: The maximum range of bars within which a divergence can be detected.
What it does: Sets an upper bound on the range of bars considered for divergence detection. A larger maximum range might capture more significant divergences but could also include less relevant long-term patterns.
Example: Setting the maximum range to 60 bars allows the script to detect divergences over a longer timeframe, capturing more extended divergence patterns that could indicate major trend reversals.
RSI Divergence Explanation
RSI divergences occur when the RSI indicator and price action move in opposite directions, signaling potential trend reversals. This section of the settings allows traders to customize the appearance and detection of both regular and hidden bullish and bearish divergences.
RSI Divergence Input Settings:
R. Bullish Div Label: Default: True
What it is: An option to display labels for regular bullish divergences.
What it does: Enables or disables the visibility of labels that mark regular bullish divergences, where the price makes a lower low while the RSI makes a higher low, indicating a potential upward reversal.
Example: A trader might use this to spot buying opportunities in a downtrend when a bullish divergence suggests the trend may be reversing.
Bullish Label Color, Line Width, and Line Color:
What it is: Settings to customize the appearance of regular bullish divergence labels.
What it does: Allows you to choose the color of the labels, adjust the width of the divergence lines, and select the color for these lines.
Example: Selecting a green label color and a distinct line width makes bullish divergences easily recognizable on your chart.
R. Bearish Div Label: Default: True
What it is: An option to display labels for regular bearish divergences.
What it does: Enables or disables the visibility of labels that mark regular bearish divergences, where the price makes a higher high while the RSI makes a lower high, indicating a potential downward reversal.
Example: A trader might use this to spot selling opportunities in an uptrend when a bearish divergence suggests the trend may be reversing.
Bearish Label Color, Line Width, and Line Color:
What it is: Settings to customize the appearance of regular bearish divergence labels.
What it does: Allows you to choose the color of the labels, adjust the width of the divergence lines, and select the color for these lines.
Example: Choosing a red label color and a specific line width makes bearish divergences clearly stand out on your chart.
H. Bullish Div Label: Default: False
What it is: An option to display labels for hidden bullish divergences.
What it does: Enables or disables the visibility of labels that mark hidden bullish divergences, where the price makes a higher low while the RSI makes a lower low, indicating potential continuation of an uptrend.
Example: A trader might use this to confirm an existing uptrend when a hidden bullish divergence signals continued buying strength.
Hidden Bullish Label Color, Line Width, and Line Color:
What it is: Settings to customize the appearance of hidden bullish divergence labels.
What it does: Allows you to choose the color of the labels, adjust the width of the divergence lines, and select the color for these lines.
Example: A softer green color with a thinner line width might be chosen to subtly indicate hidden bullish divergences, keeping the chart clean while providing useful information.
H. Bearish Div Label: Default: False
What it is: An option to display labels for hidden bearish divergences.
What it does: Enables or disables the visibility of labels that mark hidden bearish divergences, where the price makes a lower high while the RSI makes a higher high, indicating potential continuation of a downtrend.
Example: A trader might use this to confirm an existing downtrend when a hidden bearish divergence signals continued selling pressure.
Hidden Bearish Label Color, Line Width, and Line Color:
What it is: Settings to customize the appearance of hidden bearish divergence labels.
What it does: Allows you to choose the color of the labels, adjust the width of the divergence lines, and select the color for these lines.
Example: A muted red color with a thinner line width might be selected to indicate hidden bearish divergences without overwhelming the chart.
Divergence Text Size and Color: Default: S (Small)
What it is: Settings to adjust the size and color of text labels for RSI divergences.
What it does: Allows you to customize the size and color of text labels that display the divergence information on the chart.
Example: Choosing a small text size with a bright white color can make divergence labels easily readable without taking up too much space on the chart.
STOCHASTIC DIVERGENCES
Display of Stochastic RSI Divergence Labels:
Display of Stochastic RSI Divergence Settings:
Stochastic RSI Divergence Explanation
Stochastic RSI divergences occur when the Stochastic RSI indicator and price action move in opposite directions, signaling potential trend reversals. These settings allow traders to customize the detection and visual representation of both regular and hidden bullish and bearish divergences in the Stochastic RSI.
Stochastic RSI Divergence Input Settings:
R. Bullish Div Label: Default: True
What it is: An option to display labels for regular bullish divergences in the Stochastic RSI.
What it does: Enables or disables the visibility of labels that mark regular bullish divergences, where the price makes a lower low while the Stochastic RSI makes a higher low, indicating a potential upward reversal.
Example: A trader might use this to spot buying opportunities in a downtrend when a bullish divergence in the Stochastic RSI suggests the trend may be reversing.
Bullish Label Color, Line Width, and Line Color:
What it is: Settings to customize the appearance of regular bullish divergence labels in the Stochastic RSI.
What it does: Allows you to choose the color of the labels, adjust the width of the divergence lines, and select the color for these lines.
Example: Selecting a blue label color and a distinct line width makes bullish divergences in the Stochastic RSI easily recognizable on your chart.
R. Bearish Div Label: Default: True
What it is: An option to display labels for regular bearish divergences in the Stochastic RSI.
What it does: Enables or disables the visibility of labels that mark regular bearish divergences, where the price makes a higher high while the Stochastic RSI makes a lower high, indicating a potential downward reversal.
Example: A trader might use this to spot selling opportunities in an uptrend when a bearish divergence in the Stochastic RSI suggests the trend may be reversing.
Bearish Label Color, Line Width, and Line Color:
What it is: Settings to customize the appearance of regular bearish divergence labels in the Stochastic RSI.
What it does: Allows you to choose the color of the labels, adjust the width of the divergence lines, and select the color for these lines.
Example: Choosing an orange label color and a specific line width makes bearish divergences in the Stochastic RSI clearly stand out on your chart.
H. Bullish Div Label: Default: False
What it is: An option to display labels for hidden bullish divergences in the Stochastic RSI.
What it does: Enables or disables the visibility of labels that mark hidden bullish divergences, where the price makes a higher low while the Stochastic RSI makes a lower low, indicating potential continuation of an uptrend.
Example: A trader might use this to confirm an existing uptrend when a hidden bullish divergence in the Stochastic RSI signals continued buying strength.
Hidden Bullish Label Color, Line Width, and Line Color:
What it is: Settings to customize the appearance of hidden bullish divergence labels in the Stochastic RSI.
What it does: Allows you to choose the color of the labels, adjust the width of the divergence lines, and select the color for these lines.
Example: A softer blue color with a thinner line width might be chosen to subtly indicate hidden bullish divergences, keeping the chart clean while providing useful information.
H. Bearish Div Label: Default: False
What it is: An option to display labels for hidden bearish divergences in the Stochastic RSI.
What it does: Enables or disables the visibility of labels that mark hidden bearish divergences, where the price makes a lower high while the Stochastic RSI makes a higher high, indicating potential continuation of a downtrend.
Example: A trader might use this to confirm an existing downtrend when a hidden bearish divergence in the Stochastic RSI signals continued selling pressure.
Hidden Bearish Label Color, Line Width, and Line Color:
What it is: Settings to customize the appearance of hidden bearish divergence labels in the Stochastic RSI.
What it does: Allows you to choose the color of the labels, adjust the width of the divergence lines, and select the color for these lines.
Example: A muted orange color with a thinner line width might be selected to indicate hidden bearish divergences without overwhelming the chart.
Divergence Text Size and Color: Default: S (Small)
What it is: Settings to adjust the size and color of text labels for Stochastic RSI divergences.
What it does: Allows you to customize the size and color of text labels that display the divergence information on the chart.
Example: Choosing a small text size with a bright white color can make divergence labels easily readable without taking up too much space on the chart.
Alert System:
Custom Alerts for Divergences and Reversals:
What it is: The script includes customizable alert conditions to notify you of detected divergences or potential reversals based on WaveTrend, RSI, and Stochastic RSI.
What it does: Helps you stay informed of key market movements without constantly monitoring the charts, enabling timely decisions.
Example: Setting an alert for regular bearish divergence on the WaveTrend could notify you of a potential sell opportunity as soon as it is detected.
How to Use Alerts:
Set up custom alerts in TradingView based on these conditions to be notified of potential trading opportunities. Alerts are triggered when the indicator detects conditions that match the selected criteria, such as divergences or potential reversals.
By following the detailed guidelines and examples above, you can effectively use and customize this powerful indicator to suit your trading strategy.
For further understanding and customization, refer to the input settings within the script and adjust them to match your trading style and preferences.
How Components Work Together
Synergy and Cross-Validation: The indicator combines multiple layers of analysis to validate trading signals. For example, a WaveTrend buy signal that coincides with a bullish divergence in RSI and positive fast money flow is likely to be more reliable than any single indicator’s signal. This cross-validation reduces the likelihood of false signals and enhances decision-making.
Comprehensive Market Analysis: Each component plays a role in analyzing different aspects of the market. WaveTrend focuses on trend strength, Money Flow indicators assess market sentiment, while RSI and Stochastic RSI offer detailed views of price momentum and potential reversals.
Ideal For
Traders who require a reliable, multifaceted tool for detecting market trends and reversals.
Investors seeking a deeper understanding of market dynamics across different timeframes and conditions, whether in forex, equities, or cryptocurrency markets.
This script is designed to provide a comprehensive tool for technical analysis, combining multiple indicators and divergence detection into one versatile and customizable script. It is especially useful for traders who want to monitor various indicators simultaneously and look for convergence or divergence signals across different technical tools.
Acknowledgements
Special thanks to these amazing creators for inspiration and their creations:
I want to thank these amazing creators for creating there amazing indicators , that inspired me and also gave me a head start by making this indicator! Without their amazing indicators it wouldn't be possible!
vumanchu: VuManChu Cipher B Divergences.
MisterMoTa: RSI + Divergences + Alerts .
DevLucem: Plain Stochastic Divergence.
Note
This indicator is designed to be a powerful tool in your trading arsenal. However , it is essential to backtest and adjust the settings according to your trading strategy before applying it to live trading . If you have any questions or need further assistance, feel free to reach out.

Market Cipher B by WeloTradesMarket Cipher B by WeloTrades: Detailed Script Description
//Overview//
"Market Cipher B by WeloTrades" is an advanced trading tool that combines multiple technical indicators to provide a comprehensive market analysis framework. By integrating WaveTrend, RSI, and MoneyFlow indicators, this script helps traders to better identify market trends, potential reversals, and trading opportunities. The script is designed to offer a holistic view of the market by combining the strengths of these individual indicators.
//Key Features and Originality//
WaveTrend Analysis:
WaveTrend Channel (WT1 and WT2): The core of this script is the WaveTrend indicator, which uses the smoothed average of typical price to identify overbought and oversold conditions. WT1 and WT2 are calculated to track market momentum and cyclical price movements.
Major Divergences (🐮/🐻): The script detects and highlights major bullish and bearish divergences automatically, providing traders with visual cues for potential reversals. This helps in making informed decisions based on divergence patterns.
Relative Strength Index (RSI):
RSI Levels: RSI is used to measure the speed and change of price movements, with specific levels indicating overbought and oversold conditions.
Customizable Levels: Users can configure the overbought and oversold thresholds, allowing for a tailored analysis based on individual trading strategies.
MoneyFlow Indicator:
Fast and Slow MoneyFlow: This indicator tracks the flow of capital into and out of the market, offering insights into the underlying market strength. It includes configurable periods and multipliers for both fast and slow MoneyFlow.
Vertical Positioning: The script allows users to adjust the vertical position of MoneyFlow plots to maintain a clear and uncluttered chart.
Stochastic RSI:
Stochastic RSI Levels: This combines the RSI and Stochastic indicators to provide a momentum oscillator that is sensitive to price changes. It is used to identify overbought and oversold conditions within a specified period.
Customizable Levels: Traders can set specific levels for more precise analysis.
//How It Works//
The script integrates these indicators through advanced algorithms, creating a synergistic effect that enhances market analysis. Here’s a detailed explanation of the underlying concepts and calculations:
WaveTrend Indicator:
Calculation: WaveTrend is based on the typical price (average of high, low, and close) smoothed over a specified channel length. WT1 and WT2 are derived from this typical price and further smoothed using the Average Channel Length. The difference between WT1 and WT2 indicates momentum, helping to identify cyclical market trends.
RSI (Relative Strength Index):
Calculation: RSI calculates the average gains and losses over a specified period to measure the speed and change of price movements. It oscillates between 0 and 100, with levels set to identify overbought (>70) and oversold (<30) conditions.
MoneyFlow Indicator:
Calculation: MoneyFlow is derived by multiplying price changes by volume and smoothing the results over specified periods. Fast MoneyFlow reacts quickly to price changes, while Slow MoneyFlow offers a broader view of capital movement trends.
Stochastic RSI:
Calculation: Stochastic RSI is computed by applying the Stochastic formula to RSI values, which highlights the RSI’s relative position within its range over a given period. This helps in identifying momentum shifts more precisely.
//How to Use the Script//
Display Settings:
Users can enable or disable various components like WaveTrend OB & OS levels, MoneyFlow plots, and divergence alerts through checkboxes.
Example: Turn on "Show Major Divergence" to see major bullish and bearish divergence signals directly on the chart.
Adjust Channel Settings:
Customize the data source, channel length, and smoothing periods in the "WaveTrend Channel SETTINGS" group.
Example: Set the "Channel Length" to 10 for a more responsive WaveTrend line or adjust the "Average Channel Length" to 21 for smoother trends.
Set Overbought & Oversold Levels:
Configure levels for WaveTrend, RSI, and Stochastic RSI in their respective settings groups.
Example: Set the WaveTrend Overbought Level to 60 and Oversold Level to -60 to define critical thresholds.
Money Flow Settings:
Adjust the periods and multipliers for Fast and Slow MoneyFlow indicators, and set their vertical positions for better visualization.
Example: Set the Fast Money Flow Period to 9 and Slow Money Flow Period to 12 to capture both short-term and long-term capital movements.
//Justification for Combining Indicators//
Enhanced Market Analysis:
Combining WaveTrend, RSI, and MoneyFlow provides a more comprehensive view of market conditions. Each indicator brings a unique perspective, making the analysis more robust.
WaveTrend identifies cyclical trends, RSI measures momentum, and MoneyFlow tracks capital movement. Together, they provide a multi-dimensional analysis of the market.
Improved Decision-Making:
By integrating these indicators, the script helps traders make more informed decisions. For example, a bullish divergence detected by WaveTrend might be validated by an RSI moving out of oversold territory and supported by increasing MoneyFlow.
Customization and Flexibility:
The script offers extensive customization options, allowing traders to tailor it to their specific needs and strategies. This flexibility makes it suitable for different trading styles and timeframes.
//Conclusion//
The indicator stands out due to its innovative combination of WaveTrend, RSI, and MoneyFlow indicators, offering a well-rounded tool for market analysis. By understanding how each component works and how they complement each other, traders can leverage this script to enhance their market analysis and trading strategies, making more informed and confident decisions.
Remember to always backtest the indicator first before implying it to your strategy.

RSI Overbought/Oversold [Overlay Highlighter]Indicator to show when the RSI is in oversold(Below 30) or overbought (Above 70) conditions. The background color of the chart changes colors in the areas where the above conditions are met.
Price can often reverse in these areas. However, this depends on the strength of the trend and price may continue higher or lower in the direction of the overall trend.
Divergence has been added to aid the user in timing reversals. Divergences are plotted by circles above or below the candles. Divergence is confirmed so there is a delay of one candle before the signal is given on the previous candle. Again, everything depends on the strength of the trend so use proper risk management.
Once the RSI has entered into oversold/overbought conditions, it is recommended to wait for divergence before entering into the trade near areas of support or resistance. It is recommended to utilize this strategy on the H4 timeframe, however, this particular strategy works on all timeframes.
This indicator is a modified version of seoco's RSI Overbought/Oversold + Divergence Indicator . The user interface has been refined, is now overlayed on the chart, and my own divergence code has been inserted.
