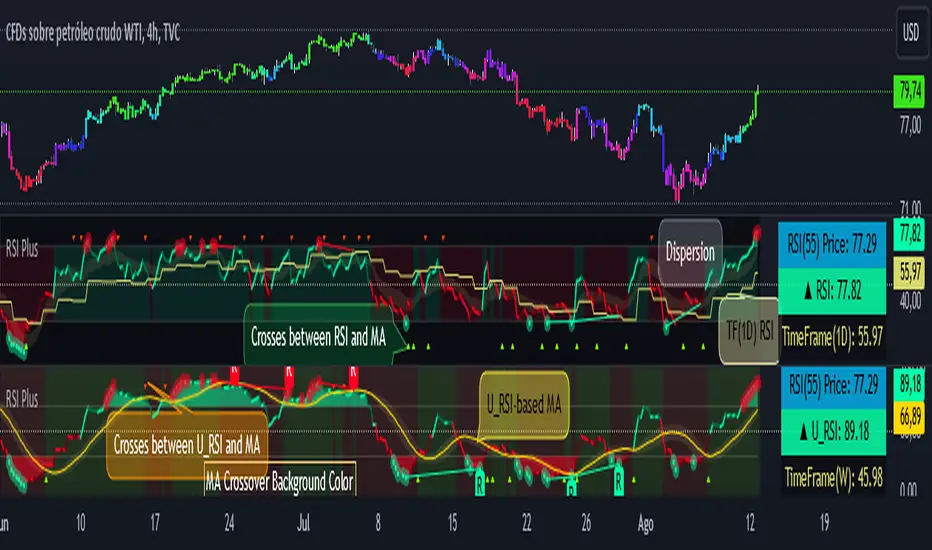
RSI PlusRSI Plus:
☑️ Show the divergences.
☑️ Shows the approximate price of an RSI level (by default it is level 55 but it can be changed for any other level).
☑️ Shows the bulls and bears zones, in green when crossing level 50 up and red when crossing down.
☑️ Circle the highest and lowest levels as possible purchases and sales.
☑️ Includes a smoothed RSI.
RSI Plus:
☑️ Muestra las divergencias.
☑️ Muestra el precio aproximado de un nivel del RSI (por defecto viene el nivel 55 pero se lo puede cambiar por cualquier otro nivel).
☑️ Muestra la zonas de toros y osos, en verde cuando cruza hacia arriba el nivel 50 y rojo cuando cruza hacia abajo.
☑️ Marca con un circulo los niveles mas alto y mas bajos como posibles compras y ventas.
☑️ Incluye un RSI suavizado.
Rsi_divergence
JMRT RSI Stock DivergenceThis oscillator organized by Four Line , control zone and Divergence Line
This oscillator has 4 lines and shows divergences
1- Heavy movement line
2- Slow movement line
3- Fast movement line
4- Stocke line
Oscillator areas include the following subdivisions
1- Neutral Zone between Fibo 38.2% & 61.8%
2- Bullish Control Zone
3- Bearish Control Zone
4- Divergence Line
there are three or four suggestions for finding tradable signals behind those parts.
In its simplest form, the fast line can be supported by slow and heavy lines in uptrends
Or in the downward trend, these lines act as a resistance for fast line
Following some rules can improve the quality of signals
1- Support that has occurred with divergence along with the process
2- If it is accompanied by a structure of different types of price action
3- And in which control area this happened is important. For example, in the neutral zone, signals against the trend can usually be of low quality
In the second method, the signals that are issued in the areas of change of the saturation trend of buying and selling
A change in the direction of the fast line in saturated areas can be accompanied by a confirmed divergence of a signal to change the current trend or correct the price.
The third theory is about the continuity of the current trend
When the fast line moves towards the neutral or descending area but the heavy slow line continues to move positively and upwards, it means that the movement can continue in the same flow and trend as it is. And vice versa
The stock line is suitable for times when the market is in place
Note: Fibonacci levels in line movement can act as support and resistance levels
The idea of this oscillator is inspired by @mrhashem Borjas Tarh Momentum and Cyber Momentum

Mr_tahlilgar RSI 3 line with DivergenceThis oscillator organized by three Line , control zone and Divergence Line
1:) Fast Line
2:) Slow Line
3:) Heavy Line
4:) Neutral Zone between Fibo 38.2% & 61.8%
5:) Bullish Control Zone
6:) Bearish Control Zone
7:) Super Bullish Control Zone
8:) Super Bearish Control Zone
9:) Divergence Line
And there are three theories of finding tradable signals behind those parts .
The first and the most simplest theory is the situation that the Fast Line has the possibility to be supported by Slow or Heavy Lines and basically reverse its slope !!
But there are some rules and notes for this theory ... First of all the accuracy and rate of that is variable in three main categories of situation
1:) with or without price action reversal structure like reversal pattern (Head&Shoulder , Quasimodo , .... )
2:) with or without regular divergence
3:) in which control zone ?
So basically the most powerful setup occurs when price action is already in the reversal structure and the potential to have at least one drive of regular divergence exist and also the Fast Line is in the opposite control zone of the current time frame trend .... so obviously if one of those rules will not be satisfied so the signal will be the less value
The second theory is the signals that occur after the reversal, obviously a sign of trend continuation. there are two type of that you can use with this oscillator
The first one happens when price reverses its trend and this oscillator is moving to the neutral zone ... so if at least one drive of hidden divergence exist the neutral zone will have good possibility to reverse the slope of the oscillator obviously this would happen usually after hidden divergence confirmed .
and the second one is basically the first type but after the reversal Subsequently in the outside of the bullish / bearish control zone ... those kinds of signals are NOT the reversal potency signal at all !! they designed for trend continuation... be careful of them and try trade with your old friend trend ! .... also The existence of hidden divergences will be better for trade in this kind of signals
The third theory is about the continuity of the current trend
When the fast line moves towards the neutral or descending area but the heavy slow line continues to move positively and upwards, it means that the movement can continue in the same flow and trend as it is. And vice versa

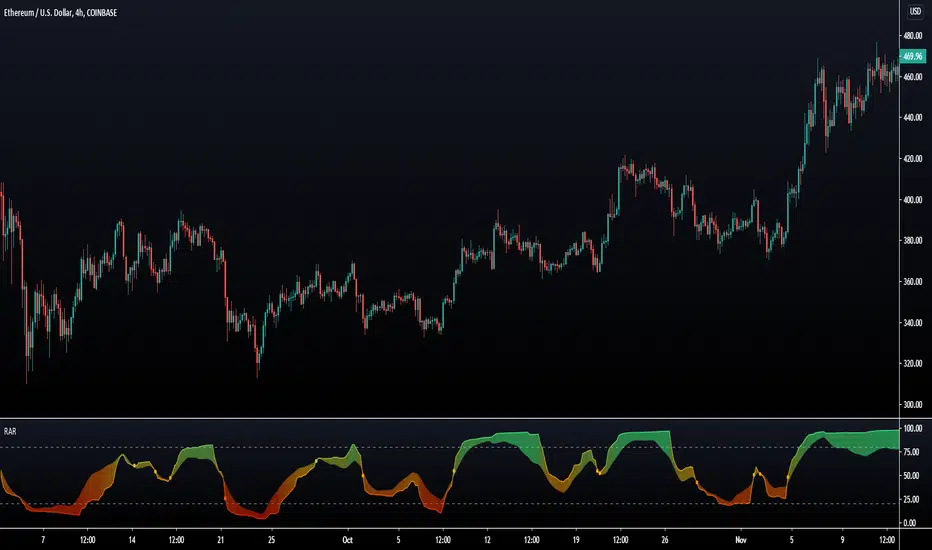
Rainbow Adaptive RSI [LuxAlgo]The following oscillator uses an adaptive moving average as an input for another RSI oscillator and aims to provide a way to minimize the impact of retracements over the oscillator output without introducing significant lag.
An additional trigger line is present in order to provide entry points from the crosses between the oscillator and the trigger line. More details are given below.
Settings
Length : period of the oscillator
Power : controls the sensitivity of the oscillator to retracements, with higher values minimizing the sensitivity to retracements.
Src : source input of the indicator
The indicator also includes the following graphical settings:
Gradient : Determines the color mode to use for the gradient, options include "Red To Green", "Red To Blue" and "None", with "None" displaying no gradient.
Color fill : Determines whether to fill the area between the oscillator and the trigger line or not, by default "On".
Circles : Determines whether to show circles highlighting the crosses between the oscillator and the trigger line.
Usage
The indicator can be used like any normalized oscillator, but unlike a classical RSI, it does not converge toward 50 with higher length values. This is caused by the RSI using a smooth input.
The power setting will minimize the impact of certain variations on the oscillator:
Here the oscillator at the bottom uses a power value of 1.5.
The trigger line is a smoothed RSI using an EMA as input, and it won't remain as near to 100 and 0 as the main oscillator. Using a moving average of the main oscillator as a trigger line would create faster crosses, but this approach allows us to have no crosses when a retracement is present.
Details
As previously discussed the main oscillator uses an adaptive moving average as input; this adaptive moving average is computed using a smoothing factor derived from an RSI oscillator, a similar adaptive moving average known as ARSI, but unlike ARSI which uses a classical RSI of the closing price for the calculation of the smoothing factor, our smoothing factor makes use of RSI on the adaptive moving average error, which provides a higher level of adaptiveness.
[YummyProfit] RSI DivergenceHi everyone,
This scripts are used for learning and research purposes. THESE ARE NOT BUY/SELL SIGNALS.
If you have a better idea, share it here or contact me via msg. I will improve this script better in next version.
Settings:
Basically, you only need to care about "Lookback Level For Divs", this is the number of previously adjacent peak.
Feel free to use, share, comment & feedback.
Get indicator trading signals at yummyprofit.
Good luck!


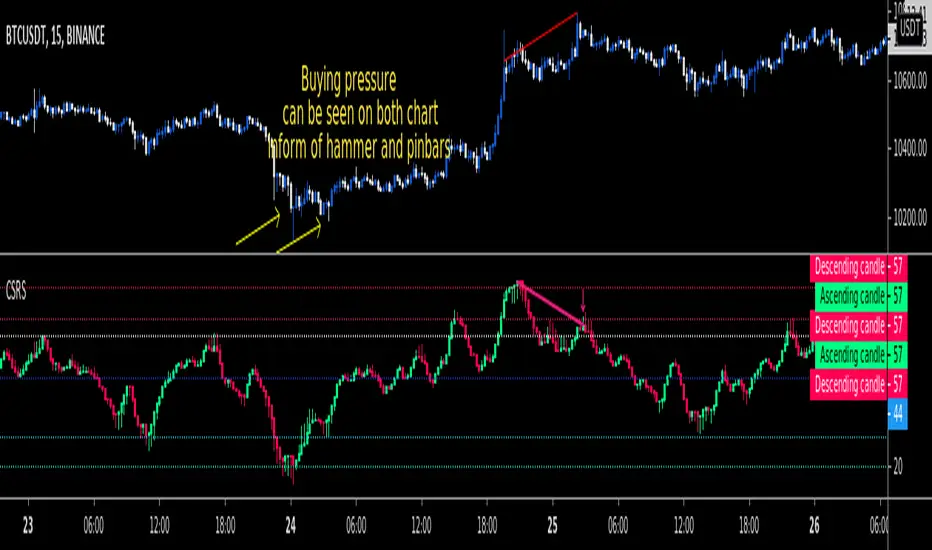
CSRSCandlesticked RSI for price action traders!
See the True Momentum.
You can smooth RSI to remove noises and also find divergences.
fully customizable.
RSI with Self-Adjusting Linear Regression Bands (Expo)RSI with Self-Adjusting Linear Regression Bands (Expo) makes use of RSI and Linear Regression to create an RSI that follows the current trend. The indicator has an upper and lower self-adjusting Linear Regression Band that act as RSI boundaries.
HOW TO USE
The indicator can be used in multiple ways, for instance, to find overbought and oversold areas. Or to identify trends as well as pullbacks in trends.
INDICATOR IN ACTION
This indicator is a modification of RafaelZioni's work "Linear Regression Trend bands"
Credit to: RafaelZioni
I hope you find this indicator useful , and please comment or contact me if you like the script or have any questions/suggestions for future improvements. Thanks!
I will continually work on this indicator, so please share your experience and feedback as it will enable me to make even better improvements. Thanks to everyone that has already contacted me regarding my scripts. Your feedback is valuable for future developments!
-----------------
Disclaimer
Copyright by Zeiierman.
The information contained in my scripts/indicators/ideas does not constitute financial advice or a solicitation to buy or sell any securities of any type. I will not accept liability for any loss or damage, including without limitation any loss of profit, which may arise directly or indirectly from the use of or reliance on such information.
All investments involve risk, and the past performance of a security, industry, sector, market, financial product, trading strategy, or individual’s trading does not guarantee future results or returns. Investors are fully responsible for any investment decisions they make. Such decisions should be based solely on an evaluation of their financial circumstances, investment objectives, risk tolerance, and liquidity needs.
My scripts/indicators/ideas are only for educational purposes!

PT RSx RSIVersion 1.0 of our RSx RSI indicator was developed initially as a scalper. It helps determine a possible top/bottom for a specified time frame. The indicator is a modified version of the original RSI . We added a second line to help give you a visual on a bull/bear cross.
Bull crosses at the bottom of the range indicate that the current trend is trying to reverse & vice versa.
We also added a series of Fibonacci levels that act as pivotal areas. We have two highlighted areas that offer volatility . Our Red zone (upper fibs) should prompt you to look for short entries & our Grey zone (mid fibs), which acts as a neutral/range area.
This Oscillator was built around our buy sell indicator & it is used on all time frames for swinging & scalping. It is included as part of the library. Just message us for access!

TMsignal - RSI Divergence V1.0TMsignal - RSI Divergence V1.0: It automatically shows RSI Divergence, being much useful for detecting future changes in the tendency of the current stock, and weakness in the actual tendency.
Different timeframes can be set up to meet your needs.
We hope you like it! Contact us any question or improvement suggestions.

HM_RSI [By Nitish Sir]Concept by NITISH Sir;
Hilega Milega System;
LONG Entry when RSI is GREEN & Above "dash" line
SHORT Entry when RSI is RED & Below "dash" line
LONG Exit when RSI turns to RED from GREEN
SHORT Exit when RSI turns to GREEN from RED
SIDEWAYS movement when RSI line is BLACK; Wait for pullback or reversals here.
Use on Higher Timeframes only.

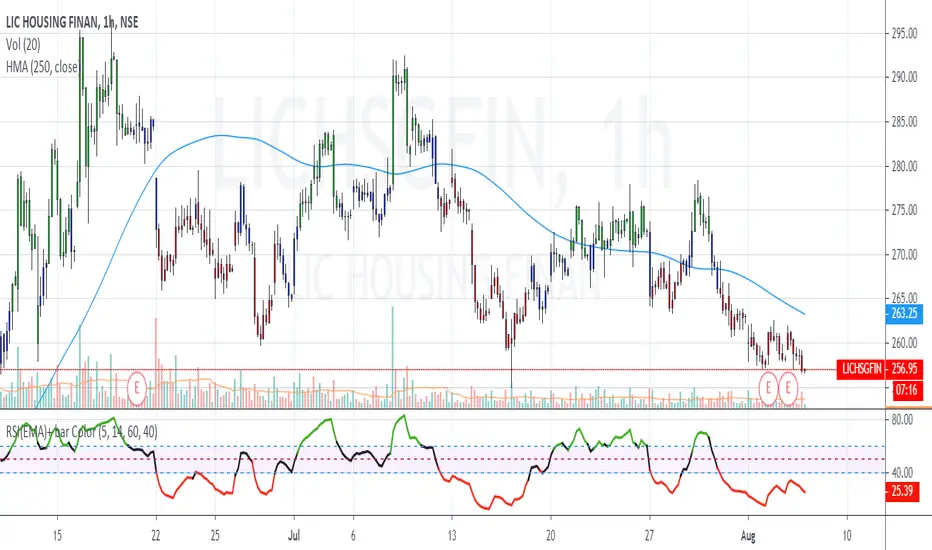
RSI(EMA) - Reducing Noise This script is a modified version of the Relative Strength Indicator ( RSI ). While using RSI to trade the markets, the signals generated are very choppy.
Approach 1. One way to reduce this noise is to use a higher period for the RSI calculation. (say 20 instead of 14 period). In this approach, the valid signal comes quite late.
Approach 2. My unique solution is to use a Exponential Moving Average as the input for the RSI calculation. Usually RSI calculations are based on close value of the candles. If we use an appropriate EMA value, then the signal efficiency will increase.
Using the approach 2, strategies similar to regular RSI can be utilized i.e. RSI breakout, RSI divergence, RSI Hidden divergence.
RSI Colors explained
GREEN = BULLISH momentum when RSI >60
RED = BEARISH momentum when RSI <40
BLACK = NEUTRAL market conditions when RSI is between 40 and 60
Breakout Strategy
LONGS - RSI color is GREEN + Price breaks a Resistance
SHORTS - RSI color is RED + Price breaks a Support
Recommended default settings: EMA =7 period , RSI =14 period
ADDITIONAL TIP: Works wonderfully with Pivot Points (standard)
I recommended to use on minimum 5 MINUTE timeframe for intraday trades . But you can use different timeframes as well.
Please leave comment below If you have any question or development idea.
[Antipanic] RSI Relative Strength Index EnhancedRSI Enhanced Version
- Additional settings
- Middle line
- Bars coloring
- Overbought/oversold highlighting
- Divergence detection (SOON)
- Use it with other signals
RSI Length = 7 (twice faster than original indicator, change to 14 for default settings).
Simple signals
Blue: buy and don't sell.
Orange: sell and don't buy.
Gray: stay calm.
It is not an investment recommendation. Your use is at your own risk.
Cheers.
Share.
Like.
🤝

Stoch+RSI With Color Combination. Hello Everyone This Indicater Base on (RSI and Stoch) COMBINATION With Color Combination.
You Can also use for
1-Divergence.
2-Overbought.
3-Oversold.
4-Breakout.
5-Support & Resistance Zones.

Divergence RSI [mado]Divergence screener for OBV RSI
Regular Bullish: "D" navy label
Hidden Bullish: "H" navy label
Regular Bearish: "D" red label
Hidden Bearish: "H" red label

VWAP Relative Strength Index [CC]This is a custom indicator of mine that uses the volume weighted average price instead of the close price as the source for calculations of the relative strength index. Buy when the indicator line is green and sell when it is red.
This was a custom request so let me know if there are any other scripts you would like to see me do or if you want something custom done!

RSI Market trendClear indication of market up and down trend so that you can stick to Buy or Sell strategy based on RSI.
{INDYAN} RSI + MACDModded RSI and MACD for intraday use. If rsi above 60 and macd is above zero line then go for buy and if rsi is below 40 and macd below zero line then go for sell side. use it in small timeframe i.e. 3 minute or less.
better for scalp trading
Happy Trading
Love INDYAN
#It can be used best with INDYAN Go With Trend

RSI5_50 with DivergenceThis is variation of RSI Divergence strategy.
I have added a filter (long term RSI) to the Rules. strategy BUYs when RSI 50 period is above 50 line and there is divergence on the short term RSI
settings
=========
short term RSI period 5
long term RSI period 50
stopLoss is 8% --- if setting is enabled
BUY Rule
========
RSI 50 is above 50 line
short term RSI is showing divergence
Add to existing
==============
if already in position, BUY when shorTermRSI is crossing above 20
TakeProfit
=========
when longTermRSI reaches 60,65, 70 and 75 level , take partial profits .
(not when crossing down --- This may affect on profits , because when price goes down , it goes very fast )
Exit
=====
when longTermRSI is crossing down 30
OR stopLoss value hits
Note: When I tested this with GOOGL stock , I have got excellent results ... any experts there , please check everything is good with scripting ...
Happy Trading

RSI V Pattern IndicatorThis is the indicator version of RSI V Pattern strategy
alertconditions added.
Note: This beta version , I still need to fix the color for the Exit when trade is not in Long ...

Double Smoothed Relative Strength IndexThe Double Smoothed RSI Indicator was created by William Blau (Stocks & Commodities V. 9:5 (202-205)) and is a variation of the classic RSI using his Momenta Indicator and his Momenta RSI formula. I have color coded everything to make it very easy to determine buy and sell signals.
Let me know if you would like to see me write scripts for other indicators!

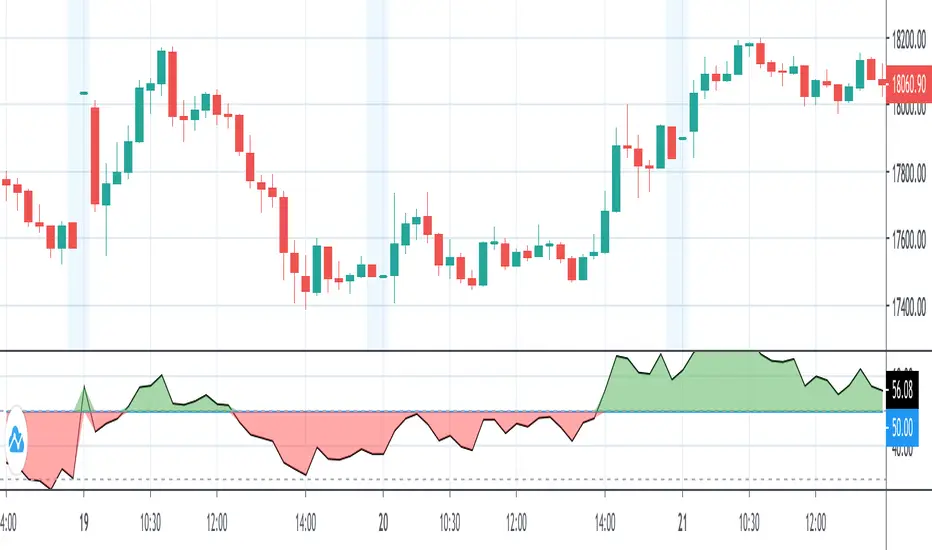
TradeChartist MTF RSI Spotter™TradeChartist MTF RSI Spotter is an elegant Multi Timeframe RSI tool that helps spot price trends using visually engaging and appealing RSI plots and backgrounds compared to the basic RSI plot. Also the Bull and the Bear background fills + HTF RSI based background fills are highly useful for traders who like to visually understand areas of entry and exit based on RSI .
What does ™TradeChartist MTF RSI Spotter do?
Plots RSI with visually spottable colors for Bull and Bear zones (Green and Red) with optional background fill.
Plots RMA based on User specified length.
Plots user preferred HTF RSI on same chart as chart TF - HTF resolution from indicator settings drop-down must be used.
Fills Bull and Bear zone colors based on HTF based RSI movement.
Spots Regular RSI Bullish and Bearish Divergences.
Plots RSI color candles on main chart based on Upper and Lower RSI band.
Plots RSI based on RSI smoothing (1 for Regular RSI without smoothing) and Heikin Ashi RSI if opted from indicator settings.
This indicator works like a dream when used with other indicators for confirmation of Trends.
Note 1: Divergences don't work to trader's expectations all the time. It is a great indicator but has to be used with caution and entries must be confirmed using another indicator like Volume , Trend, fundamentals, market sentiment etc. They can't be used on their own to decide entry and exit.
Note 2: Bull and Bear RMA with chart TF RSI should be used for confirmation and not as a standalone indicator for entry and exit.
Example charts
Premium Scripts - Trial access and Information
Trial access offered on all Premium scripts.
PM me directly to request trial access to the scripts or for more information.

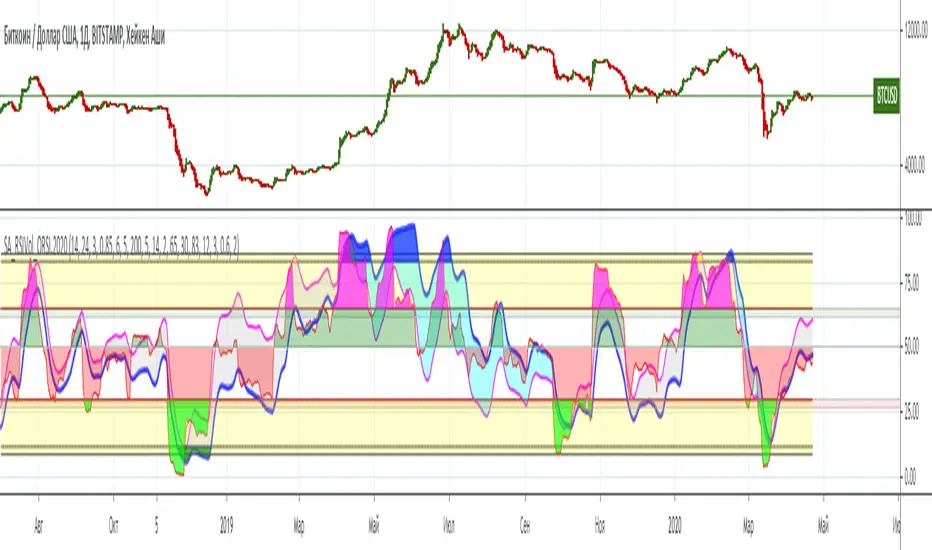
SA_RSIVolume_ORSI.2020.bibl[wozdux] Description of the SA_RSIvol_ORSI indicator
The rsivol indicator has undergone changes and additions. Since this modified indicator is used in the video, I publish it with explanations.
First add-on
In order to eliminate some delay in the rsivol blue line, A rsivol with a period of 200 was introduced. Then this line became some long-term reference and the regular RSIVOL was divided into RSIVOL200. The result is a pink line. In the indicator, it is indicated as RSIVOL200 by a pink line.
Second addition
In the old indicator, the rsivol parameter itself is calculated as the RSI of the conditional volume price. This volume price is calculated as the average product of the price per volume divided by the average volume for a certain period.
OS=ema (volume*cena, TT)/ ema(volume, TT)
Here, an exponential moving average is used to calculate the volume price. Then the RSI function is taken from this calculated price. As we know from the meaning of the RSI, this is the percentage of purchases from the sum of all transactions or the intensity of purchases. Using volume prices instead of simple prices, we get a more truthful picture of purchases in the market.
So, the EMA itself is good, but it tends to be late. There is another formula for calculating the moving average, which contains the advantages of the EMA and does not have its disadvantages. This function is ALMA.
An alternative way to calculate the volume price is to use the ALMA function instead of the EMA. In this function, in addition to the period, two additional parameters are used.
ALMA(xx, TT,ss,kk)
In the indicator, it is possible to simultaneously see the RSIVOL lines, both with EMA and ALMA.
The third addition
Similarly, you can use ALMA instead of EMA to calculate a simple price RSI. However, there were no interesting results for the price RSI. In the indicator, I left the option to see how it looks just for information. If you are interested, you can watch it.
The fourth addition
The fourth addition concerns the regular RSI. The function itself has been changed. The built-in RSI function is re-created and named ORSI. It is supplemented with volume. In other words, ORSI calculates the purchase rate based on volume, but in a different way than RSIVOL. As a result, we have two lines of RSI and ORSI simultaneously. The price RSI shows the rate of price increase. Volume ORSI shows the rate of volume engagement. The greater the difference between these indicators, the stronger the trend in one direction or another. These two speeds are represented as two lines with the area between them filled in with color.
The indicator also shows a different way of displaying it: a histogram of the difference between these speeds. You can turn the histogram on or off.
New line coloring
The RSI and ORSI chart is made as a colored area above and below the 50 level. Above the level, the color is green, below the level, the color is red.
How do I use the indicator?
The indicator is used just like any other. We are looking for divergences between the indicator lines and the price chart.
RSIVOL200 responds faster to a trend reversal. The divergences on RSIvol200 are clearer.
RSI-ORSI . You can use either one option or the other for trading. Everyone chooses the most convenient one.
Sharing or as a histogram of the difference allows you to see the market picture more subtly.
I have not yet studied this indicator in all its manifestations. I suggest that everyone who wants to do this.
SETTINGS
switch close <==> ( H+L)/2 == switch KEY to select the price type
blue RSIVOL= switch the color of the fields == enable / disable rsivol coloring above and below levels
blue => vp=volume * price === period for calculating the volume price
blue => RSIVOL(vp,len) === period for calculating RSIVOL
blue RSIVOL KEY === enable / disable rsivol line
blue _RSIVOL_ to include the width LINE === enable the RSIVOL line as a ribbon
blue_RSIVOL_ line width == = ribbon width
blue _RSIVOL => EMA(true) or ALMA(false) coefficients ( kk, ss) = = = use EMA or ALMA to calculate the volume price. By default, ALMA, when the button does not have a check mark.
ALMA-->kk=={0,1} = = = coefficient for the formula ALMA with a range of changes from 0 to 1
ALMA-->ss=={1.10} = = = coefficient for the formula ALMA with a range of changes from 1 to 10
key => and-and RSIVOL(ema) blue + RSIVOL (alma) black === This key allows you to display both RSIVOL lines on the chart simultaneously as both ema and alma.
blue__o1=> ema ( RSIVOL, o1) = = = additional rsivol smoothing after all calculations
fuchsia RSIVOL ( 200 ) = rsivol/rsivol200 = = = enable RSIVOL200
fuchsia__ => RsiVol200 (vp, 200) === period for calculating RSIvol200
fuchsia__o2=> ema ( RSIVOL200 , o2) = = = additional rsivol200 smoothing
key red => rsi(close) === disable key RSI
key => or-or price RSI <--> volume ORSI ===key for displaying the RSI or ORSI
key => and-and price RSI + volume ORSI = = = key for displaying both RSI and ORSI
red=rsi (close, 14) === period for calculating the RSI and ORSI
red= ema ( RSI, 2) = = additional smoothing of RSI and ORSI
key ==> histogram of the difference (RSI-ORSI) === enable displaying the RSI-ORSI difference histogram
yellow line level_UP_ _ rsi === upper level for RSI-ORSI
yellow line level_DOWN_ _ rsi== = lower level for RSI-ORSI
level_UP_rsivol == top level for RSIvol
level_DOWN_rsivol == lower level for RSIvol
RSI => replace EMA true --> ALMA(kk, ss) false== replace EMA with ALMA in the RSI calculation
ALMA=>kk=={0,1} = = = coefficient of alma
ALMA=>ss=={1.10} = = = coefficient of alma
======Описание на русском языке=========
Описание индикатора SA_RSIvol_ORSI
Индикатор RSIVOL претерпел изменения и дополнения. Поскольку этот измененный индикатор используется в видео, то публикую его с пояснениями.
Первое дополнение
Для того, чтобы устранить некоторое запаздывание синей линии RSIVOL, была введена RSIVOL с периодом 200. Затем эта линия стала некоторым долгосрочным эталоном и обычную RSIVOL разделили на RSIVOL200. В результате получилась розовая линия. В индикаторе она обозначена как RSIVOL200 розовой линией.
Второе дополнение
В старом индикаторе сам параметр RSIVOL вычисляется как RSI от условной объемной цены. Эта объемная цена вычисляется как усредненное произведение цены на объем, деленное на усредненный объем за какой-то период.
ОС=ema(volume*cena, TT)/ ema(volume,TT)
Здесь для вычисления объемной цены используется экспоненциальная скользящая средняя. Далее от этой вычисленной цены берется функция RSI. Как мы знаем по смыслу RSI это доля закупок от суммы всех сделок или интенсивность закупок. Используя объемную цены вместо простой цены, мы получаем более правдивую картину закупок на рынке.
Так вот, сама по себе EMA хорошая, но она имеет свойство запаздывать. Существует другая формула вычисления скользящей средней, которая содержит достоинства EMA и отсутствуют её недостатки. Эта функция ALMA.
Альтернативным способом вычисления объемной цены является использование вместо EMA функции ALMA. В этой функции, кроме периода используются дополнительные два параметра.
ALMA(xx,TT,ss,kk)
В индикаторе есть возможность одновременно видеть линии RSIVOL , как с EMA, так и ALMA.
Третье дополнение
Аналогично для вычисления простой ценовой RSI можно использовать ALMA вместо EMA. Однако для ценовой RSI интересных результатов не получилось. В индикаторе я оставила возможность посмотреть, как это выглядит просто для информации. Кому интересно, можете посмотреть.
Четвертое дополнение
Четвертое дополнение касается обычной RSI. В саму функцию внесены изменения. Встроенная функция RSI сделана заново и названа ORSI. Она дополнена объемом. Иначе говоря, ORSI вычисляет скорость закупок с учетом объема, но другим способом, чем RSIVOL. В результате, имеем две линии RSI и ORSI одновременно. Ценовая RSI показывает скорость наращивания цены. Объемная ORSI показывает скорость вовлечения объема. Чем больше разница между этими показателями, тем сильнее тренд в ту или иную сторону. Эти две скорости представлены как две линии, область между которыми заполнена цветом.
В индикаторе представлен и другой способ отображения: гистограмма разницы между этими скоростями. Гистограмму можно включить или выключить.
Новая раскраска линий
График RSI и ORSI выполнен как окрашенная область над и под уровнем 50. Над уровнем окраска зеленым цветом, под уровнем окраска красным цветом.
Как использовать индикатор?
Индикатор используется также, как любой другой. Ищем дивергенции между линиями индикатора и ценовым графиком.
RSIVOL200 быстрее реагирует на разворот тренда. Дивергенции на RSIvol200 более четкие.
RSI-ORSI . Можно использовать либо один вариант, либо другой для торговли. Каждый выбирает для себя наиболее удобный.
Совместное использование или в виде гистограммы разницы позволяет более тонко видеть картину рынка.
Я еще не изучила данный индикатор во всех его проявлениях. Предлагаю это сделать каждому, кто пожелает.
НАСТРОЙКИ
switch close <==> ( H+L)/2 == КЛЮЧ переключатель для выбора типа цены
blue RSIVOL= switch the color of the fields == включить / выключить окраску RSIVOL над и под уровнями
blue => vp=volume * price === период для вычисления объемной цены
blue => RSIVOL(vp,len) === период для вычисления RSIVOL
blue RSIVOL KEY === включить \ выключить линию RSIVOL
blue _RSIVOL_ to include the width LINE === включить линию RSIVOL в виде ленты
blue_RSIVOL_ line width ===ширина ленты
blue _RSIVOL => EMA(true) or ALMA(false) coefficients ( kk, ss) === использовать EMA или ALMA для вычисления объемной цены. По умолчанию ALMA, когда на кнопке нет галочки.
ALMA-->kk=={0,1} === коэффициент для формулы ALMA с диапазоном изменения от 0 до 1
ALMA-->ss=={1,10} === коэффициент для формулы ALMA с диапазоном изменения от 1 до 10
key => and-and RSIVOL(ema) blue + RSIVOL (alma) black === Этот ключ позволяет отобразить на графике обе линии RSIVOL одновременно и как ema и как alma.
blue__o1=> ema ( RSIVOL, o1) === дополнительное сглаживание RSIVOL после всех вычислений
fuchsia RSIVOL ( 200 ) = rsivol/rsivol200 === включить RSIVOL200
fuchsia__ => RsiVol200 (vp,200) === период для вычисления RSIvol200
fuchsia__o2=> ema ( RSIVOL200 , o2) === дополнительное сглаживание RSIvol200
key red => rsi(close) === ключ выключения RSI
key => or-or price RSI <--> volume ORSI ===ключ для отображения RSI или ORSI
key => and-and price RSI + volume ORSI === ключ для отображения одновременно RSI и ORSI
red=rsi (close,14) === период вычисления RSI и ORSI
red= ema ( RSI ,2) == дополнительное сглаживание RSI и ORSI
key ==> histogram of the difference (RSI-ORSI) === включить отображение гистограммы разницы RSI-ORSI
yellow line level_UP__rsi === верхний уровень для RSI-ORSI
yellow line level_DOWN__rsi=== нижний уровень для RSI-ORSI
level_UP_rsivol == верхний уровень для RSIvol
level_DOWN_rsivol == нижний уровень для RSIvol
RSI => replace EMA true --> ALMA(kk,ss) false== заменить EMA на ALMA в вычислении RSI
ALMA=>kk=={0,1} === коэффициент alma
ALMA=>ss=={1,10} === коэффициент alma