Multi-indicator Signal Builder [Skyrexio]Overview
Multi-Indicator Signal Builder is a versatile, all-in-one script designed to streamline your trading workflow by combining multiple popular technical indicators under a single roof. It features a single-entry, single-exit logic, intrabar stop-loss/take-profit handling, an optional time filter, a visually accessible condition table, and a built-in statistics label. Traders can choose any combination of 12+ indicators (RSI, Ultimate Oscillator, Bollinger %B, Moving Averages, ADX, Stochastic, MACD, PSAR, MFI, CCI, Heikin Ashi, and a “TV Screener” placeholder) to form entry or exit conditions. This script aims to simplify strategy creation and analysis, making it a powerful toolkit for technical traders.
Indicators Overview
1. RSI (Relative Strength Index)
Measures recent price changes to evaluate overbought or oversold conditions on a 0–100 scale.
2. Ultimate Oscillator (UO)
Uses weighted averages of three different timeframes, aiming to confirm price momentum while avoiding false divergences.
3. Bollinger %B
Expresses price relative to Bollinger Bands, indicating whether price is near the upper band (overbought) or lower band (oversold).
4. Moving Average (MA)
Smooths price data over a specified period. The script supports both SMA and EMA to help identify trend direction and potential crossovers.
5. ADX (Average Directional Index)
Gauges the strength of a trend (0–100). Higher ADX signals stronger momentum, while lower ADX indicates a weaker trend.
6. Stochastic
Compares a closing price to a price range over a given period to identify momentum shifts and potential reversals.
7. MACD (Moving Average Convergence/Divergence)
Tracks the difference between two EMAs plus a signal line, commonly used to spot momentum flips through crossovers.
8. PSAR (Parabolic SAR)
Plots a trailing stop-and-reverse dot that moves with the trend. Often used to signal potential reversals when price crosses PSAR.
9. MFI (Money Flow Index)
Similar to RSI but incorporates volume data. A reading above 80 can suggest overbought conditions, while below 20 may indicate oversold.
10. CCI (Commodity Channel Index)
Identifies cyclical trends or overbought/oversold levels by comparing current price to an average price over a set timeframe.
11. Heikin Ashi
A type of candlestick charting that filters out market noise. The script uses a streak-based approach (multiple consecutive bullish or bearish bars) to gauge mini-trends.
12. TV Screener
A placeholder condition designed to integrate external buy/sell logic (like a TradingView “Buy” or “Sell” rating). Users can override or reference external signals if desired.
Unique Features
1. Multi-Indicator Entry and Exit
You can selectively enable any subset of 12+ classic indicators, each with customizable parameters and conditions. A position opens only if all enabled entry conditions are met, and it closes only when all enabled exit conditions are satisfied, helping reduce false triggers.
2. Single-Entry / Single-Exit with Intrabar SL/TP
The script supports a single position at a time. Once a position is open, it monitors intrabar to see if the price hits your stop-loss or take-profit levels before the bar closes, making results more realistic for fast-moving markets.
3. Time Window Filter
Users may specify a start/end date range during which trades are allowed, making it convenient to focus on specific market cycles for backtesting or live trading.
4. Condition Table and Statistics
A table at the bottom of the chart lists all active entry/exit indicators. Upon each closed trade, an integrated statistics label displays net profit, total trades, win/loss count, average and median PnL, etc.
5. Seamless Alerts and Automation
Configure alerts in TradingView using “Any alert() function call.”
The script sends JSON alert messages you can route to your own webhook.
The indicator can be integrated with Skyrexio alert bots to automate execution on major cryptocurrency exchanges
6. Optional MA/PSAR Plots
For added visual clarity, optionally plot the chosen moving averages or PSAR on the chart to confirm signals without stacking multiple indicators.
Methodology
1. Multi-Indicator Entry Logic
When multiple entry indicators are enabled (e.g., RSI + Stochastic + MACD), the script requires all signals to align before generating an entry. Each indicator can be set for crossovers, crossunders, thresholds (above/below), etc. This “AND” logic aims to filter out low-confidence triggers.
2. Single-Entry Intrabar SL/TP
One Position At a Time: Once an entry signal triggers, a trade opens at the bar’s close.
Intrabar Checks: Stop-loss and take-profit levels (if enabled) are monitored on every tick. If either is reached, the position closes immediately, without waiting for the bar to end.
3. Exit Logic
All Conditions Must Agree: If the trade is still open (SL/TP not triggered), then all enabled exit indicators must confirm a closure before the script exits on the bar’s close.
4. Time Filter
Optional Trading Window: You can activate a date/time range to constrain entries and exits strictly to that interval.
Justification of Methodology
Indicator Confluence: Combining multiple tools (RSI, MACD, etc.) can reduce noise and false signals.
Intrabar SL/TP: Capturing real-time spikes or dips provides a more precise reflection of typical live trading scenarios.
Single-Entry Model: Straightforward for both manual and automated tracking (especially important in bridging to bots).
Custom Date Range: Helps refine backtesting for specific market conditions or to avoid known irregular data periods.
How to Use
1. Add the Script to Your Chart
In TradingView, open Indicators , search for “Multi-indicator Signal Builder”.
Click to add it to your chart.
2. Configure Inputs
Time Filter: Set a start and end date for trades.
Alerts Messages: Input any JSON or text payload needed by your external service or bot.
Entry Conditions: Enable and configure any indicators (e.g., RSI, MACD) for a confluence-based entry.
Close Conditions: Enable exit indicators, along with optional SL (negative %) and TP (positive %) levels.
3. Set Up Alerts
In TradingView, select “Create Alert” → Condition = “Any alert() function call” → choose this script.
Entry Alert: Triggers on the script’s entry signal.
Close Alert: Triggers on the script’s close signal (or if SL/TP is hit).
Skyrexio Alert Bots: You can route these alerts via webhook to Skyrexio alert bots to automate order execution on major crypto exchanges (or any other supported broker).
4. Visual Reference
A condition table at the bottom summarizes active signals.
Statistics Label updates automatically as trades are closed, showing PnL stats and distribution metrics.
Backtesting Guidelines
Symbol/Timeframe: Works on multiple assets and timeframes; always do thorough testing.
Realistic Costs: Adjust commissions and potential slippage to match typical exchange conditions.
Risk Management: If using the built-in stop-loss/take-profit, set percentages that reflect your personal risk tolerance.
Longer Test Horizons: Verify performance across diverse market cycles to gauge reliability.
Example of statistic calculation
Test Period: 2023-01-01 to 2025-12-31
Initial Capital: $1,000
Commission: 0.1%, Slippage ~5 ticks
Trade Count: 468 (varies by strategy conditions)
Win rate: 76% (varies by strategy conditions)
Net Profit: +96.17% (varies by strategy conditions)
Disclaimer
This indicator is provided strictly for informational and educational purposes .
It does not constitute financial or trading advice.
Past performance never guarantees future results.
Always test thoroughly in demo environments before using real capital.
Enjoy exploring the Multi-Indicator Signal Builder! Experiment with different indicator combinations and adjust parameters to align with your trading preferences, whether you trade manually or link your alerts to external automation services. Happy trading and stay safe!
Rsiindicator

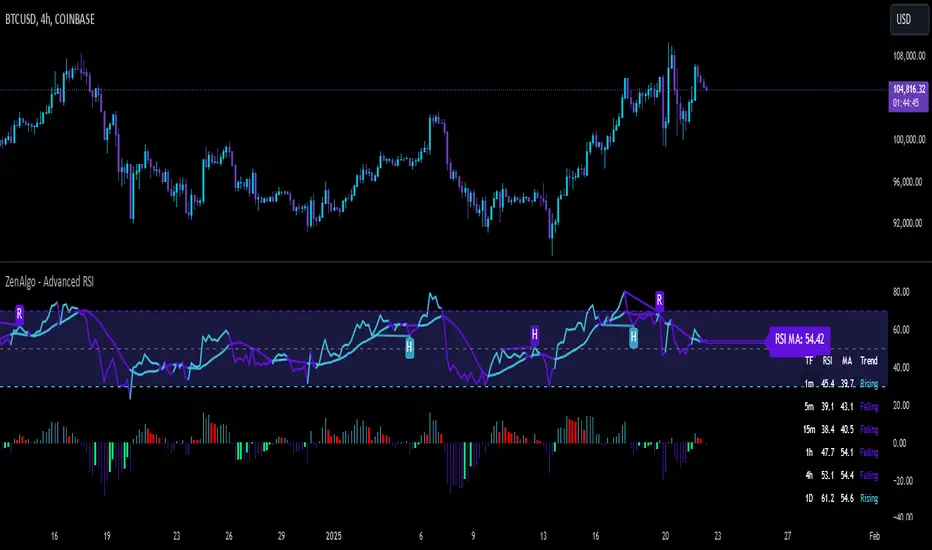
ZenAlgo - Advanced RSIZenAlgo - Advanced RSI is a technical indicator that combines the classic Relative Strength Index (RSI) with advanced tools, such as moving averages, histograms, divergence detection, and trend analysis. This integration provides traders with deeper insights into market dynamics, helping them identify critical entry and exit points. The indicator is designed to synergistically merge these features, delivering a comprehensive analytical tool that simplifies market analysis while providing actionable insights.
Additionally, it includes a Multi TimeFrame table, allowing traders to monitor RSI values and trends across six different timeframes in one view. This enhancement provides a broader perspective on market dynamics and helps traders identify consistent or diverging trends across multiple timeframes, enabling more precise decision-making.
Features
RSI with Moving Averages:
Offers five types of moving averages (SMA, EMA, WMA, SMMA, VWMA) to suit various trading styles and market conditions.
Moving averages are overlaid on RSI, allowing traders to detect support/resistance levels and momentum shifts directly on the RSI panel.
RSI Histogram:
Displays the difference between RSI and its moving average.
Positive histogram values indicate rising momentum, while negative values show declining momentum.
Automatically detects and highlights divergences with color-coded bars (red for bearish, green for bullish).
Bollinger Bands for RSI:
Adds upper and lower bands to RSI, visualizing volatility and overbought/oversold conditions.
Divergence Detection:
Identifies and visualizes both regular and hidden divergences, marking key reversal or trend continuation points.
Labels divergences with R (regular) or H (hidden) to provide clarity on their implications.
Bollinger Bands for RSI:
Adds upper and lower bands to RSI, visualizing volatility and overbought/oversold conditions.
Diamond Signals:
Marks crossovers of RSI and its moving average in overbought (RSI > 70) or oversold (RSI < 30) zones with diamond symbols, highlighting potential reversals.
Multi TimeFrame Table:
Displays RSI values for six different timeframes in a clear and intuitive table.
Calculates the trend on each timeframe based on the average direction of the last three candles. Trends are categorized as "rising" (increasing), "falling" (decreasing), or "neutral" (stable).
Provides easily interpretable insights across timeframes, allowing traders to focus on the current chart without switching timeframes manually.
Added Value: Why Is This Indicator Original/Why Shall You Pay for This Indicator?
ZenAlgo - Advanced RSI is a cohesive system where each component enhances the others. The originality and added value of the indicator come from:
1. Synergy Between Components:
Unlike standalone indicators, which can provide isolated or incomplete insights, ZenAlgo - Advanced RSI combines RSI, moving averages, and divergence detection into a unified system. For instance:
The RSI histogram integrates momentum and trend strength in a single visualization, eliminating the need for multiple separate tools.
Divergences are calculated using both price action and histogram trends, providing more reliable signals compared to divergence detection using only RSI.
2. Customization for Traders:
The ability to select from various moving averages (e.g., EMA for fast responses, SMA for smoother trends) allows users to tailor the indicator to different trading environments and strategies.
3. Actionable Visual Cues:
Diamond signals, histogram bars, and divergence markings make complex market patterns easier to interpret, reducing the cognitive load for traders.
4. Enhanced Divergence Analysis:
Built-in detection of regular and hidden divergences offers clarity and saves traders the effort of manually analyzing charts.
5. Bollinger Bands Integration:
Adding Bollinger Bands to RSI provides insights into volatility and momentum that go beyond what traditional Bollinger Bands or RSI can deliver individually.
6. Multi TimeFrame Table:
The Multi Time Frame table adds a new layer of analytical depth by consolidating RSI values and trends from multiple timeframes into a single tool. This helps traders identify consistent or diverging trends across timeframes, which is crucial for adjusting trading strategies to suit specific market conditions.
7. All-in-One Efficiency:
Instead of juggling multiple indicators, traders gain a streamlined tool that consolidates trend, momentum, and volatility analysis into a single, easy-to-read panel.
How It Works
1. RSI Calculation:
RSI is calculated using the standard formula to determine the relative strength of upward and downward price movements over a specified period.
2. Moving Averages:
Users choose from SMA, EMA, WMA, SMMA, or VWMA. The selected moving average is computed using RSI values, not price data, to better align with the indicator's momentum focus.
3. Histogram:
The histogram shows the difference between RSI and its moving average. Positive values indicate RSI is above its moving average, signaling increasing momentum; negative values indicate the opposite.
4. Divergence Detection:
Regular divergences are identified when price forms higher highs or lower lows, while RSI trends in the opposite direction.
Hidden divergences are marked when price forms higher lows or lower highs, but RSI trends differently.
Divergence is validated using both histogram and price trends for enhanced reliability.
5. Bollinger Bands for RSI:
The upper and lower bands are based on the RSI and a configurable standard deviation, highlighting moments of high volatility and overbought/oversold conditions.
6. Trend Analysis:
The indicator computes an average RSI value over last few candles to detect trend strength and direction, helping traders identify when trends are gaining or losing momentum.
7. Diamond Signals:
Signals are triggered when RSI crosses its moving average within overbought or oversold zones. These events are plotted as diamonds for quick visualization.
Please note that this indicator does not trigger any alerts or direct buy/sell signals.
8. Multi TimeFrame Table:
RSI values are calculated for six separate time frames chosen by the user (e.g., 1-minute, 5-minute, 1-hour).
The trend is determined by averaging the direction of the last three candles on each timeframe. Results are displayed as "rising," "falling," or "neutral" in the table.
The table serves as a quick-reference tool for analyzing trends and RSI values across multiple market perspectives.
Usage Examples
Tracking Trends: Use the histogram to monitor momentum: positive values indicate strengthening trends, while negative values suggest weakening trends.
Spotting Divergences: Look for regular divergences (R) to anticipate reversals and hidden divergences (H) to confirm trend continuation.
Utilizing Diamond Signals: When diamonds appear in overbought or oversold zones, they signal potential market reversals, allowing traders to act quickly.
Analyzing Volatility: Bollinger Bands on RSI highlight moments of high volatility, providing additional confirmation for potential trend changes.
Quick Assessment of RSI values: Use the Multi TimeFrame table to quickly assess RSI values and trends on different timeframes. Consistent trends (e.g., "rising" RSI on most timeframes) suggest market alignment, while diverging trends may indicate potential reversals or conflicting market signals. Use this insight to refine entries and exits.
Settings
RSI Length: Number of candles used for RSI calculation.
RSI Source: Data source for RSI calculation.
MA Type: Type of moving average (SMA, EMA, RMA, WMA, VWMA).
MA Length: Number of RSI values used for moving average calculation.
BB StdDev: Standard deviation length for Bollinger Bands calculation.
Disable / enable display of: Bullish, Bearish, Hidden Bullish and Hidden Bearish divergences.
Show table RSI & MA: display or hide Multi TimeFrame RSI table.
Table position / size: set MultiTimeFrame table position to suit your needs and keep it from obstructing other indicator views
Important Notes
This indicator is a technical analysis tool and does not guarantee trading success.
Use it in conjunction with other indicators and fundamental analysis for a more comprehensive trading strategy.
In strong trends, divergences may become less reliable as price action overrides momentum indicators.
RSI BB StdDev SignalOverview
The RSI BB StdDev Signal Indicator is a powerful tool designed to enhance your trading strategy by combining the Relative Strength Index (RSI) with Bollinger Bands (BB). This unique combination allows traders to identify potential buy and sell signals more accurately by leveraging the strengths of both indicators. The RSI helps in identifying overbought and oversold conditions, while the Bollinger Bands provide a dynamic range to assess volatility and potential price reversals.
Key Features
— RSI Calculation: The indicator calculates the RSI based on user-defined parameters, allowing for customization to fit different trading styles.
— Bollinger Bands Integration: The RSI values are smoothed using a moving average, and Bollinger Bands are applied to this smoothed RSI to generate buy and sell signals.
— Divergence Detection: The indicator includes an optional feature to detect and alert on bullish and bearish divergences between the RSI and price action.
— Customizable Alerts: Users can set up alerts for buy and sell signals, as well as for divergences, ensuring they never miss a trading opportunity.
— Visual Aids: The indicator plots the RSI, Bollinger Bands, and signals on the chart, making it easy to visualize and interpret the data.
How It Works
1. RSI Calculation:
— The RSI is calculated using the change in the source input (default is close price) over a specified period.
— The RSI values are then plotted on the chart with customizable overbought and oversold levels.
2. Smoothing and Bollinger Bands:
— The RSI values are smoothed using a moving average (SMA, EMA, SMMA, WMA, VWMA) selected by the user.
— Bollinger Bands are applied to the smoothed RSI to create dynamic upper and lower bands.
3. Signal Generation:
—Buy signals are generated when the RSI crosses above the lower Bollinger Band.
—Sell signals are generated when the RSI crosses below the upper Bollinger Band.
—These signals are plotted on both the RSI pane and the main price chart for easy reference.
4. Divergence Detection:
— The indicator can detect and alert on regular bullish and bearish divergences between the RSI and price action.
— Bullish divergences occur when the price makes a lower low, but the RSI makes a higher low.
— Bearish divergences occur when the price makes a higher high, but the RSI makes a lower high.
Usage
1. Setting Up:
— Add the indicator to your TradingView chart.
— Customize the RSI length, source, and other parameters in the settings panel.
— Enable or disable the divergence detection based on your trading strategy.
2. Interpreting Signals:
— Use the buy and sell signals generated by the RSI crossing the Bollinger Bands as potential entry and exit points.
— Pay attention to divergences for additional confirmation of trend reversals.
3. Alerts:
— Set up alerts for buy and sell signals to receive notifications in real-time.
— Enable divergence alerts to be notified of potential trend reversals.
Conclusion
The RSI BB StdDev Signal Indicator is a comprehensive tool that combines the strengths of the RSI and Bollinger Bands to provide traders with more accurate and reliable signals. Whether you are a beginner or an experienced trader, this indicator can enhance your trading strategy by offering clear visual cues and customizable alerts.
Note
This indicator is provided with open-source code, allowing users to understand its logic and customize it further if needed. The detailed description and customizable settings ensure that traders of all levels can benefit from its unique features.

RSI Exponential Smoothing (Expo)█ Background information
The Relative Strength Index (RSI) and the Exponential Moving Average (EMA) are two popular indicators. Traders use these indicators to understand market trends and predict future price changes. However, traders often wonder which indicator is better: RSI or EMA.
What if these indicators give similar results? To find out, we wanted to study the relationship between RSI and EMA. We focused on a hypothesis: when the RSI goes above 50, it might be similar to the price crossing above a certain length of EMA. Similarly, when the RSI goes below 50, it might be similar to the price crossing below a certain length of EMA.
Our goal was simple: to figure out if there is any connection between RSI and EMA.
Conclusion: Yes, it seems that there is a correlation between RSI and EMA, and this indicator clearly displays that relationship. Read more about the study here:
█ Overview of the indicator
The RSI Exponential Smoothing indicator displays RSI levels with clear overbought and oversold zones, shown as easy-to-understand moving averages, and the RSI 50 line as an EMA. Another excellent feature is the added FIB levels. To activate, open the settings and click on "FIB Bands." These levels act as short-term support and resistance levels which can be used for scalping.
█ Benefits of using this indicator instead of regular RSI
The findings about the Relative Strength Index (RSI) and the Exponential Moving Average (EMA) highlight that both indicators are equally accurate (when it comes to crossings), meaning traders can choose either one without compromising accuracy. This empowers traders to pick the indicator that suits their personal preferences and trading style.
█ How it works
Crossings over/under the value of 50
The EMA line in the indicator acts as the corresponding 50 line in the RSI. When the RSI crosses the value 50 equals when Close crosses the EMA line.
Bouncess from the value 50
In this example, we can see that the EMA line on the chart acts as support/resistance equals when RSI rejects the 50 level.
Overbought and Oversold
The indicator comes with overbought and oversold bands equal when RSI becomes overbought or oversold.
█ How to use
This visual representation helps traders to apply RSI strategies directly on the price chart, potentially making RSI trading easier for traders.
-----------------
Disclaimer
The information contained in my Scripts/Indicators/Ideas/Algos/Systems does not constitute financial advice or a solicitation to buy or sell any securities of any type. I will not accept liability for any loss or damage, including without limitation any loss of profit, which may arise directly or indirectly from the use of or reliance on such information.
All investments involve risk, and the past performance of a security, industry, sector, market, financial product, trading strategy, backtest, or individual's trading does not guarantee future results or returns. Investors are fully responsible for any investment decisions they make. Such decisions should be based solely on an evaluation of their financial circumstances, investment objectives, risk tolerance, and liquidity needs.
My Scripts/Indicators/Ideas/Algos/Systems are only for educational purposes!

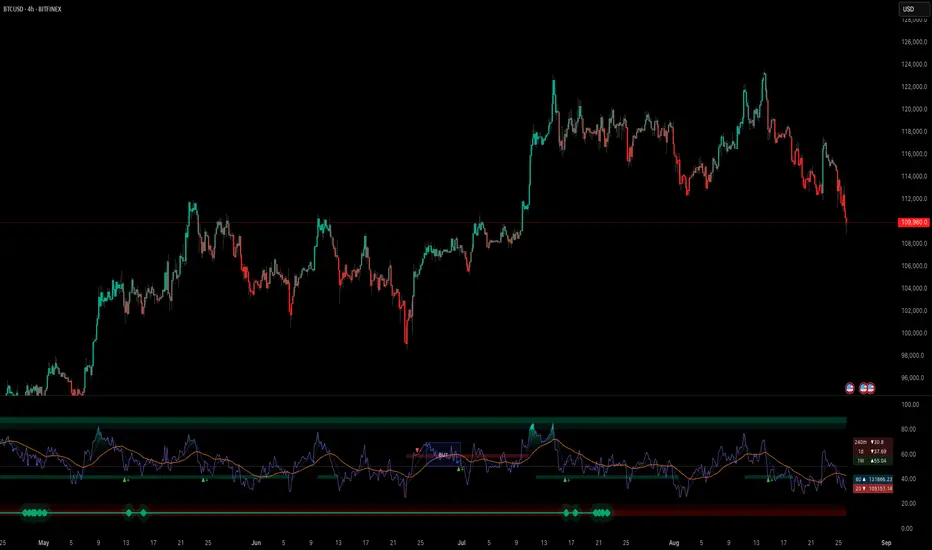
RSI Swing v2 [Premium]The RSI signal is displayed with different color zones to reflect the value on the chart. This makes field evaluation more efficient.
RSI values of different time frames are displayed in the table, helping to evaluate the market more objectively.
A Retest Buy signal is given when the RSI value decreases from the area of more than 80 to 50.
Retest Sell signal is given when the RSI value increases from less than 20 to 50.
Retest Validation results are highlighted in bold for easy detection.
Settings:
* Length, source RSI
* Text size
* Type + Length MA
* RSI ADVANCE SETTINGS:
- Value RSI Range retest for Long trend
- Value RSI Range retest for Sell trend
This Indicator alert was created for the RSI Retest.
Recommendation: Should be used in combination with other Indicators to observe the market more effectively