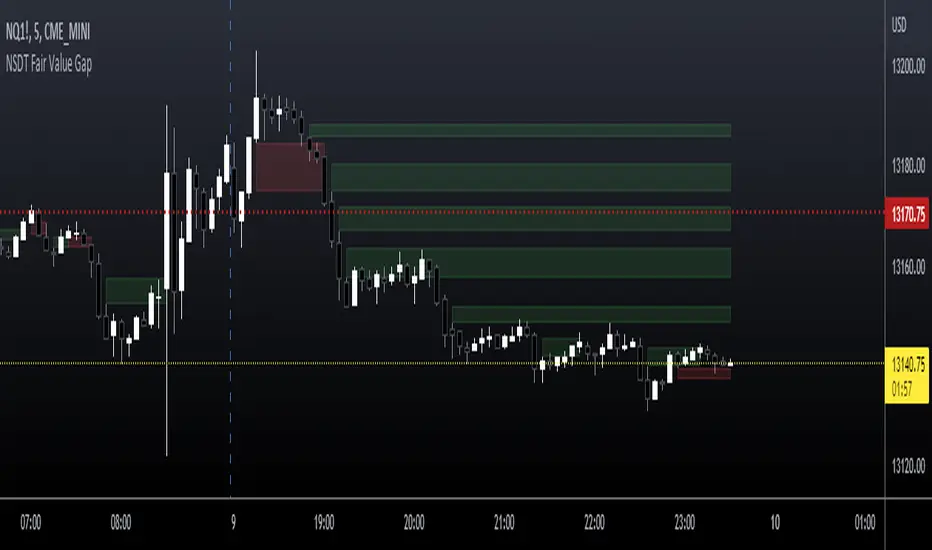
Mossy Pop is a variation on the CM Chris Moody Pop 1 that is on the public library. Bars are colored to show when the Pop is red crossing over the blue line turning bullish (Green Buy Bar) or when it is overbought in green turning into blue going bearish (Red Sell Bar) Use with other indicators but can work well on confirming a position on its own. I find...
//These signals mostly consist of crossovers between a 13 VWMA and a 62 VWMA. I've found these two moving averages to be quite special in their ability to //recognize a quick trend using volume data. The VWAP is used in the alert system as well, to give some perspective on which direction we are looking to take. We //are also using ATR. We only take trades when...
The strategy consist in every time that price failed to break any of the EMAs, we need to wait for the right price action and make a buy or sell when it bounce from it to keep surfing on the trend (using the stochastic oscillator and the 5-13 EMAs cross as an additional confirmation). When do we start looking for a change on the trend? When it repeats the blue...
Moving averages for 5m time frame. The 96 and 252 are the 8 and 21 on 1h Inspired by this simple scalping strategy
A simple scalping indicator, based on Highs and Lows. It's working in any timeframe, the only condition is ... volatility . Values are already set, but you can change them according to your preferences and to your chart. Alerts are enabled. Enjoy! @ Zekis
Hi probably trade setups indicator intended to be used with Heikin Ashi candles. It uses fibo EMAs and MACD to signal longs/shorts. Intended for scalping high cap coin with high volume on lower time frames.
//This is a new update with specific signals. Clearly, when the red line cut down the green line with a white candle, you had a sell signal for a few candles after. At the back side,.....
Using EMA5 (Exponential Moving Average) as the main trend of price, the intersection with EMA10 will signal the point of entry (go long, go short) reasonable. At this point, I pushed the EMA10 at high price to sell sooner and at low price to buy early. More specific: - When the red line crosses the blue line, the signal is the Buy. - When the red line cut the...
This is a simple script to quickly see changes in % in each candle. In blue open/close variation. In red Histogram with range between high and low. This helps me understand very quickly what's the typical change in % for a specific timeframe/pair, so I can fine tune my Stop Losses and Take Profits.
TTM scalper indicator of John Carter’s Scalper Buys and Sells. The methodology is a close approximation of the one described in his book Mastering the Trade. The book is highly recommended. Note the squares are not real-time but will show up once the third bar has confirmed a reversal. WARNING: - This script to change bars colors.
This is a diversified Binary Option or Scalping Alert indicator originally designed for lower Time Frame Trend or Swing trading. Although you will find it a useful tool for higher time frames as well. The Alerts are generated by the changing direction of the ColouredMA (HullMA by default), you then have the choice of selecting the Directional filtering on these...
This indicator is an implementation of the Bollinger Band and Awesome Oscillator Scalping system. This technique is for those who want the most simple method that is very effective. It is BEST traded during the busiest trading hours, 3am to 12am EST NY time. This method doesn't work in sideways markets, only in volatile trending markets. Time Frames: 1, 5, 10,...
Description This study project is a Scalping Pullback trading Tool that incorporates the majority of the indicators needed to analyse and scalp Trends for Pull Backs and reversals on 1min, 5min or 15min charts. The set up utilies Heikin Ashi candle charts. Incorporated within this tool are the following indicators: 1. Major industry (Banks) recognised important...
Triple SAR scalping method must be used with a 5 minute chart. Look for the patterns that 3 bands overlap. Close deal within 4-5 pip profit or build your own style after getting comfortable with this technique and share your approach with us for maybe higher profits.
The original script was posted on ProRealCode by user Nicolas. This indicator is an attempt of scalping strategy by crossing the mean high or low weigthed price over a short "n" period. This 2 lines represent the black "trench" on screenshots attached. When signal line (blue one) crossing the buy trigger one (dotted green one) a buy signal should occur and...
This is a simple scalping strategy that works for all time frames... I have only tested it on FOREX It works by checking if the price is currently in an uptrend and if it crosses the 20 EMA. If it crosses the 20 EMA and its in and uptrend it will post a BUY SIGNAL. If it crosses the 20 EMA and its in and down it will post a SELL SIGNAL. The red line is the...
This Oscillator helps to identify the ending of waves, good to get entries and exits. Now, with a tolerance line.