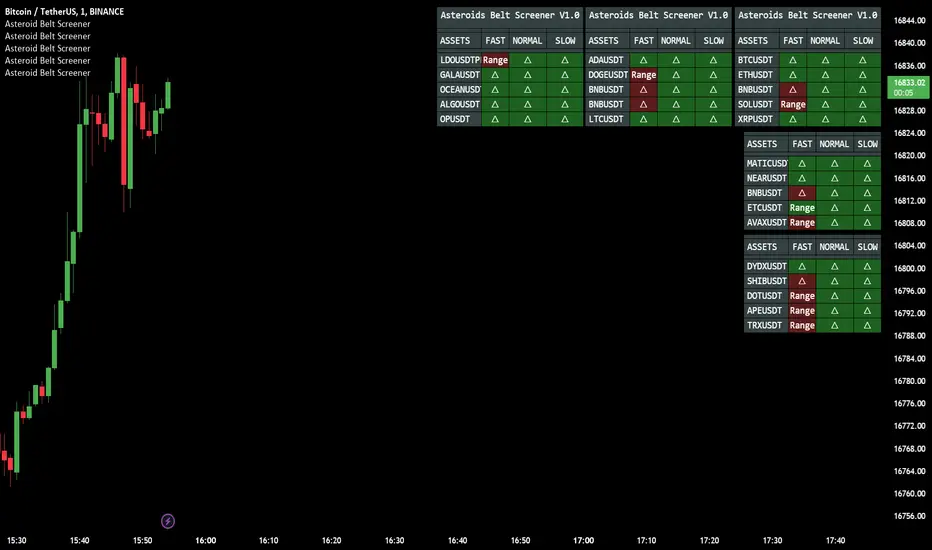
[volfgang] WAVE ScannerThe Wave Scanner helps you make more informed decisions about when to buy and sell.
This indicator operates on a series of inputs and global variable declarations. Based on the same parameters as the WAVE Indicator. It uses different parameters such as the closing price, Stochastic Momentum Index, and smoothing factors such as the EMA to calculate the potential trade signals.
The scanner allows you to adjust the thresholds for bullish and bearish counts, which can be tailored to your personal trading strategy.
The minimum value is 4 and maximum is 8.
In total you can use 8 different timeframes for your signals from the following;
3D
1D
12h
8h
4h
1h
15m
5m
The scanner's unique ability to scan across multiple timeframes is what makes this indicator unique. This multi timeframe analysis can be incredibly useful for identifying broader trends in the market.
The Wave Scanner settings also includes inputs for you to enter risk management settings, including your total capital and the risk percentage you are willing to take per trade. It uses this information to display data in a label on the chart including;
Position Size
Stop Loss Level
Potential Profit
Risk Reward Ratio
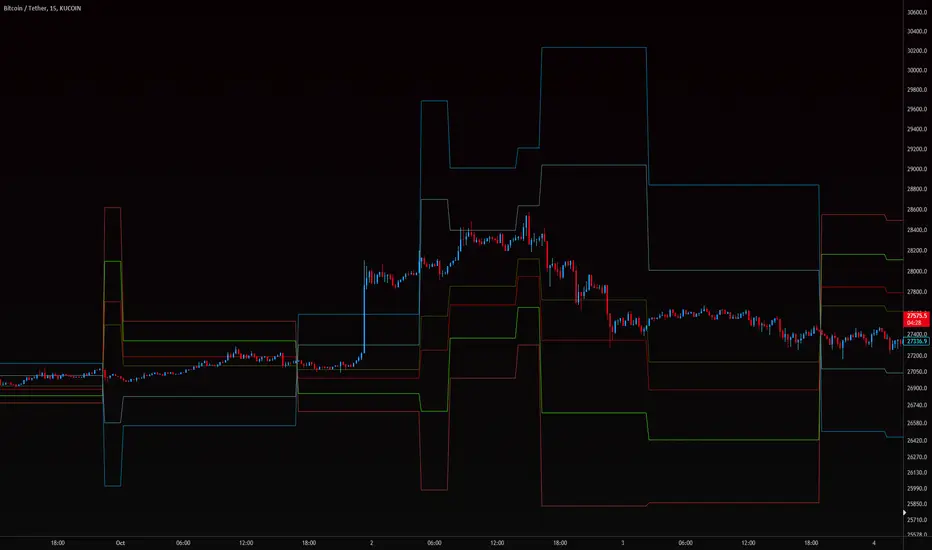
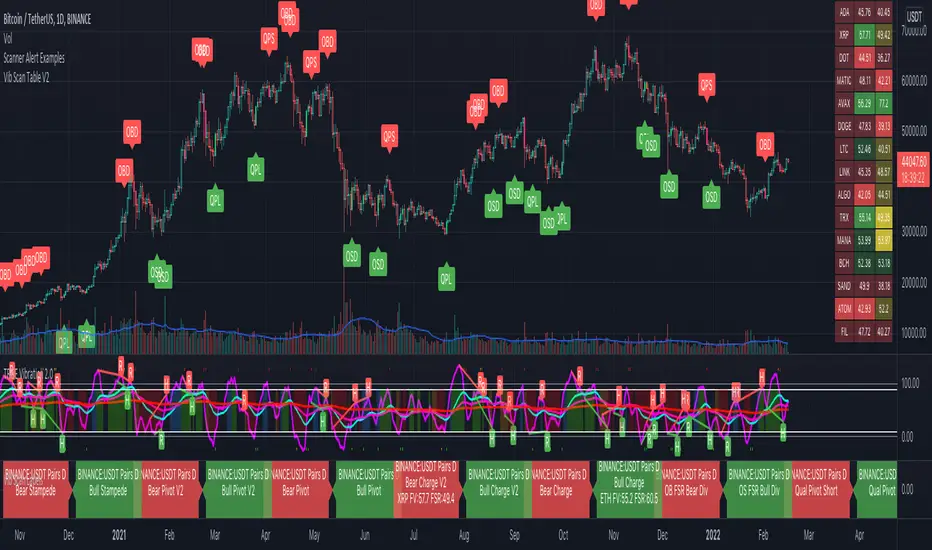
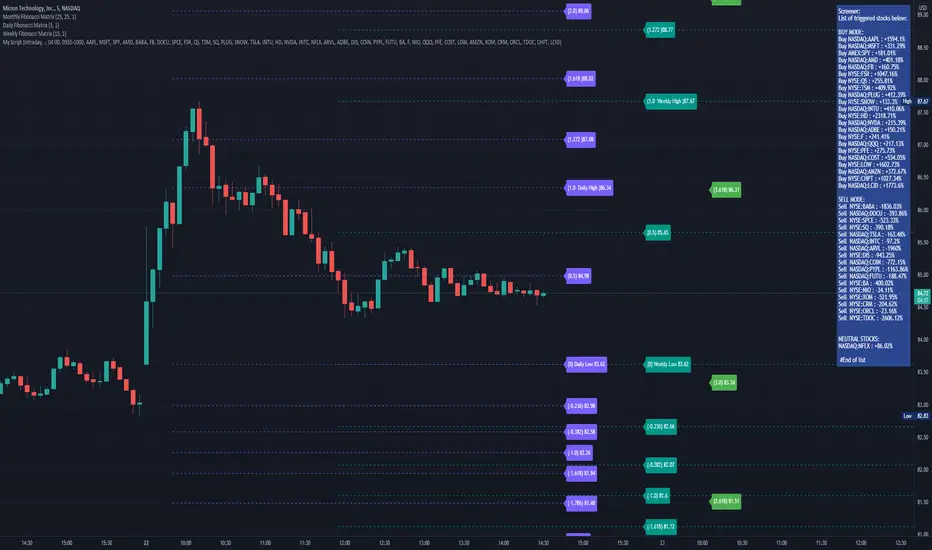
On your chart, the WAVE Scanner will plot the ideal Entry Levels, Stop Loss and Take Profit Levels by calculating Fibonacci Levels, which is a popular tool for identifying potential support and resistance levels.
These are marked as follows;
GREEN Lines: Entry Levels
PINK Line: Stop Loss (can be customized in the settings)
GREY Line: Breakeven Level (move SL to breakeven at this level)
BLUE Line: Take Profit Level
So, if you're a trader looking to level up your strategy, the Wave Scanner is a tool you won't want to miss out on.
Penunjuk Pine Script®