The Butterfly [theUltimator5]This is a technical analysis tool designed to automatically detect and visualize Butterfly harmonic patterns based on recent market pivot structures. This indicator uses a unique plotting and detection algorithm to find and display valid Butterfly patterns on the chart.
The indicator works in real-time and historically by identifying major swing highs and lows (pivots) based on a user-defined ZigZag length. It then evaluates whether the most recent price structure conforms to the ideal proportions of a bullish or bearish Butterfly pattern. If the ratios between price legs XA, AB, BC, and projected CD meet defined tolerances, the pattern is plotted on the chart along with a projected D point for potential reversal.
Key Features:
Automatic Pivot Detection: The script analyzes recent price action to construct a ZigZag pattern, identifying swing points as potential X, A, B, and C coordinates.
Butterfly Pattern Validation: The pattern is validated against traditional Fibonacci ratios:
--AB should be approximately 78.6% of XA.
--BC must lie between 38.2% and 88.6% of AB.
--CD is projected as a multiple of BC, with user control over the ratio (e.g., 1.618–2.24).
Bullish and Bearish Recognition: The pattern logic detects both bullish and bearish Butterflies, automatically adjusting plotting direction and color themes.
Custom Ratio Tolerance: Users can define how strictly the AB/XA and BC/AB legs must adhere to ideal ratios, using a percentage-based tolerance slider.
Fallback Detection Logic: If a new pattern is not identified in recent bars, the script performs a backward search on the last four pivots to find the most recent valid pattern.
Force Mode: A toggle allows users to force the drawing of a Butterfly pattern on the most recent pivot structure, regardless of whether the ideal Fibonacci rules are satisfied.
Dynamic Visualization:
--Clear labeling of X, A, B, C, and D points.
--Colored connecting lines and filled triangles to visualize structure.
--Optional table displaying key Fibonacci ratios and how close each leg is to ideal values.
Inputs:
Length: Controls the sensitivity of the ZigZag pivots. Smaller values result in more frequent pivots.
Tolerance (%): Adjustable threshold for acceptable deviation in AB/XA and BC/AB ratios.
CD Length Multiplier: Projects point D by multiplying the BC leg using a value between 1.618 and 2.24.
Force New Pattern: Overrides validation checks to display a Butterfly structure on recent pivots regardless of ratio accuracy.
Show Table: Enables a table showing calculated ratios and deviations from the ideal.
Cari dalam skrip untuk "博时黄金ETF联接C基金同类基金的最大回撤率、波动率、夏普比率对比数据"

Murrey Math Lines v6Murrey Math Lines v6
This is not just another Murrey Math indicator. It's a complete, ground-up modernization of the classic concept, rebuilt with the latest Pine Script features for unparalleled performance, accuracy, and usability. While preserving the core mathematical genius of T.H. Murrey's system, this version introduces a suite of modern tools designed for today's trader.
What are Murrey Math Lines?
Murrey Math Lines (MML) are a powerful system of support and resistance based on geometric formulas developed by T.H. Murrey. As a derivation of W.D. Gann's observations, Murrey's geometry simplifies Gann's theories into a more accessible application. The core principle is that price action tends to trend and retrace in 1/8th intervals.
These intervals create a "trading octave" with distinct levels, each having its own characteristic behavior:
& - Ultimate Resistance & Support: These lines are the hardest to break. They represent the top and bottom of the expected price range and are prime areas for reversals.
- Major Pivot: This is the most significant level, offering the strongest support and resistance within the octave. Price has a high probability of stopping and reversing here.
& - Strong Pivot/Reversal: These are strong, secondary pivot points where price often struggles to pass through.
& - The Trading Range: The price tends to consolidate between these two lines about 50% of the time. A decisive break outside this range often signals the start of a new trend.
& - Weak Support/Resistance: These levels are weaker, but when price moves too quickly towards them, they can act as initial stopping points or areas for a minor reversal.
& - Extended Octave: These lines show extreme overbought and oversold conditions beyond the primary 0/8 to 8/8 octave.
Modern Enhancements in This Version
Session-Locked Precision: Anchor the Murrey Lines to the start of a specific trading session (e.g., NYSE open). The levels remain constant for the entire session, providing a stable and reliable framework for your daily analysis.
Visual Trading & Reversal Zones: Instead of just lines, this indicator can fill the key trading range (3/8 to 5/8) and reversal zones (0/8-1/8 & 7/8-8/8) with color, giving you an instant visual reference of market sentiment.
Dynamic "Closest Price" Labels: Declutter your chart! The indicator can intelligently display only the label for the Murrey level closest to the current price, keeping your view clean while providing critical information at a glance.
Integrated Alert System: Never miss a key level touch again. Set up alerts for when the price approaches major lines, the trading range, or all lines, customized to your trading style.
Advanced Pine Script Engine: Built on a modern codebase using User-Defined Types and dynamic drawing objects (line, box, label). This ensures the indicator is fast, efficient, and non-repainting, even on lower timeframes.
Intuitive User Interface: Settings are neatly organized into collapsible groups with clear tooltips, making it incredibly easy to customize every aspect of the indicator, from calculation parameters to colors.
A Note on Accuracy
Some of the other Murrey Math indicators on TradingView use different formulas and therefore produce varying results. This version has been carefully checked against MML indicators on other professional platforms to ensure its calculations are accurate and reliable.
Credits
This indicator is a complete overhaul and modernization of the original "MM Lines " script. Full credit for the original calculation logic and concept goes to its author, JRL_6.

Normalized Volume & True RangeThis indicator solves a fundamental challenge that traders face when trying to analyze volume and volatility together on their charts. Traditionally, volume and price volatility exist on completely different scales, making direct comparison nearly impossible. Volume might range from thousands to millions of shares, while volatility percentages typically stay within single digits. This indicator brings both measurements onto a unified scale from 0 to 100 percent, allowing you to see their relationship clearly for the first time.
The core innovation lies in the normalization process, which automatically calculates appropriate scaling factors for both volume and volatility based on their historical statistical properties. Rather than using arbitrary fixed scales that might work for one stock but fail for another, this system adapts to each instrument's unique characteristics. The indicator establishes baseline averages for both measurements and then uses statistical analysis to determine reasonable maximum values, ensuring that extreme outliers don't distort the overall picture.
You can choose from three different volatility calculation methods depending on your analytical preferences. The "Body" option measures the distance between opening and closing prices, focusing on the actual trading range that matters most for price action. The "High/Low" method captures the full daily range including wicks and shadows, giving you a complete picture of intraday volatility. The "Close/Close" approach compares consecutive closing prices, which can be particularly useful for identifying gaps and overnight price movements.
The indicator displays volume as colored columns that match your candlestick colors, making it intuitive to see whether high volume occurred during up moves or down moves. Volatility appears as a gray histogram, providing a clean background reference that doesn't interfere with volume interpretation. Both measurements are clipped at 100 percent, which represents their calculated maximum normal values, so any readings near this level indicate unusually high activity in either volume or volatility.
The baseline reference line shows you what "normal" volume looks like for the current instrument, helping you quickly identify when trading activity is above or below average. Optional moving averages for both volume and volatility are available if you prefer smoothed trend analysis over raw daily values. The entire system updates in real-time as new data arrives, continuously refining its statistical calculations to maintain accuracy as market conditions evolve.
This two-in-one indicator provides a straightforward way to examine how price movements relate to trading volume by presenting both measurements on the same normalized scale, making it easier to spot patterns and relationships that might otherwise remain hidden when analyzing these metrics separately.

LRHA Trend Shift DetectorLRHA Trend Shift Detector (TSD)
The LRHA Trend Shift Detector is an advanced momentum exhaustion indicator that identifies potential trend reversals and changes by analyzing Linear Regression Heikin Ashi (LRHA) candle patterns. TSD focuses on detecting when strong directional moves begin to lose momentum.
🔬 Methodology
The indicator employs a three-stage detection process:
LRHA Calculation: Applies linear regression smoothing to Heikin Ashi candles, creating ultra-smooth trend-following candles that filter out market noise
Extended Move Detection: Identifies sustained directional moves by counting consecutive bullish or bearish LRHA candles
Momentum Exhaustion Analysis: Monitors for significant changes in candle size compared to recent averages
When an extended move shows clear signs of momentum exhaustion, the indicator signals a potential trend shift with red dots plotted above or below your candlesticks.
⚙️ Parameters
Core Settings
LRHA Length (11): Linear regression period for smoothing calculations. Lower values = more responsive, higher values = smoother trends.
Minimum Trend Bars (4): Consecutive candles required to establish an "extended move." Higher number detects longer term trend changes.
Exhaustion Bars (3): Number of consecutively smaller candles needed to signal exhaustion. Lower is more sensitive.
Size Reduction Threshold (40%): Percentage decrease in candle size to qualify as "exhaustion." Lower is more sensitive.
Trend Trading
Pullback Entries: Identify exhaustion in counter-trend moves for trend continuation
Exit Strategy: Recognize when main trend momentum is fading
Position Sizing: Reduce size when seeing exhaustion in your direction
🎛️ Optimization Tips
For More Signals (Aggressive)
- Decrease LRHA Length (7-9)
- Reduce Minimum Trend Bars (2-3)
- Lower Size Reduction Threshold (25-35%)
For Higher Quality (Conservative)
- Increase LRHA Length (13-18)
- Raise Minimum Trend Bars (5-6)
- Higher Size Reduction Threshold (45-55%)
⚠️ Important Notes⚠️
- **Not a Complete Strategy**: Use as confluence with other analysis methods
- **Market Context Matters**: Consider overall trend direction and key support/resistance levels
- **Risk Management Essential**: Always use proper position sizing and stop losses
- **Backtest First**: Optimize parameters for your specific trading style and instruments

VWAP %BVWAP %B - Volume Weighted Average Price Percent B
The VWAP %B indicator combines the reliability of VWAP (Volume Weighted Average Price) with the analytical power of %B oscillators, similar to Bollinger Bands %B but using volume-weighted statistics.
## How It Works
This indicator calculates where the current price sits relative to VWAP-based standard deviation bands, expressed as a percentage from 0 to 1:
• **VWAP Calculation**: Uses volume-weighted average price as the center line
• **Standard Deviation Bands**: Creates upper and lower bands using standard deviation around VWAP
• **%B Formula**: %B = (Price - Lower Band) / (Upper Band - Lower Band)
## Key Levels & Interpretation
• **Above 1.0**: Price is trading above the upper VWAP band (strong bullish momentum)
• **0.8 - 1.0**: Overbought territory, potential resistance
• **0.5**: Price exactly at VWAP (equilibrium)
• **0.2 - 0.0**: Oversold territory, potential support
• **Below 0.0**: Price is trading below the lower VWAP band (strong bearish momentum)
## Trading Applications
**Trend Following**: During strong trends, breaks above 1.0 or below 0.0 often signal continuation rather than reversal.
**Mean Reversion**: In ranging markets, extreme readings (>0.8 or <0.2) may indicate potential reversal points.
**Volume Context**: Unlike traditional %B, this incorporates volume weighting, making it more reliable during high-volume periods.
## Parameters
• **Length (20)**: Period for standard deviation calculation
• **Standard Deviation Multiplier (2.0)**: Controls band width
• **Source (close)**: Price input for calculations
## Visual Features
• Reference lines at key levels (0, 0.2, 0.5, 0.8, 1.0)
• Background highlighting for extreme breaks
• Real-time values table
• Clean oscillator format below price chart
Perfect for intraday traders and swing traders who want to combine volume analysis with momentum oscillators.

ALEX - ATR Extensions + ADR + TableALEX - ATR Extensions + ADR + Table
Overview
The ALEX ATR Extensions indicator is a comprehensive volatility and momentum analysis tool that combines Average True Range (ATR), Average Daily Range (ADR), and moving average distance calculations in a single, customizable display. This indicator helps traders assess current price action relative to historical volatility and key moving averages, providing crucial context for risk management and trade planning.
Key Features
Multi-Metric Analysis
- ATR Percentage: Current ATR as a percentage of price for volatility assessment
- ADR Percentage: Average Daily Range as a percentage for typical daily movement
- Low of Day Distance: Distance from current price to daily low
- Moving Average Distance: ATR-normalized distance from 21 and 50 period moving averages
Flexible Moving Average Options
- Configurable MA Types: Choose between EMA or SMA for both 21 and 50 period averages
- Customizable Periods: Adjust moving average lengths to suit your trading style
- Daily Timeframe Data: Uses daily moving averages regardless of chart timeframe
ATR Extension Levels
- Dynamic Price Targets: Calculate extension levels based on ATR multiples from moving averages
- Visual Reference Lines: Optional overlay lines showing ATR extension targets
- Customizable Multipliers: Adjust ATR multipliers for different risk/reward scenarios
Smart Visual Alerts
- Color-Coded Distance Metrics: Automatic color changes based on distance thresholds
- Symbol Plotting: Customizable chart symbols when distance thresholds are exceeded
- Threshold-Based Alerts: Visual cues when price reaches significant ATR distances
Comprehensive Data Table
- Real-Time Metrics: Live updating table with all key measurements
- Customizable Display: Toggle individual metrics on/off based on preference
- Professional Styling: Adjustable colors, fonts, and transparency
How to Use
Volatility Assessment
- High ATR%: Indicates elevated volatility, larger position sizing considerations
- Low ATR%: Suggests compressed volatility, potential for expansion
- ADR% Comparison: Compare current day's range to historical average
Moving Average Analysis
- ATR Distance 21/50: Normalized distance showing how extended price is from key levels
- Positive Values: Price above moving average (bullish positioning)
- Negative Values: Price below moving average (bearish positioning)
- Color Changes: Automatic alerts when reaching threshold levels
Extension Target Planning
- ATR Extension Lines: Visual price targets based on volatility-adjusted projections
- Risk/Reward Planning: Use extension levels for profit target placement
- Breakout Confirmation: Extension levels can confirm breakout validity
Symbol Alert System
- Chart Symbols: Automatic plotting when distance thresholds are breached
- Customizable Triggers: Set your own threshold levels for alerts
- Visual Scanning: Quick identification of extended conditions across multiple charts
Settings
Display Controls
- Show ADR%: Toggle average daily range percentage display
- Show ATR%: Toggle average true range percentage display
- Show LoD Distance: Toggle low of day distance calculation
- Show LoD Price: Toggle actual low of day price display
- Show ATR Distance from 21/50 DMA: Toggle moving average distance metrics
- Show 21/50 DMA Price: Toggle actual moving average price display
- Show ATR Extension Levels: Toggle extension target display in table
Moving Average Configuration
- 21/50 DMA Type: Choose between EMA or SMA calculation methods
- 21/50 DMA Period: Customize moving average lengths
- ADR/ATR Length: Adjust calculation periods for range measurements
Color Thresholds
- Threshold Levels: Set distance levels for color changes (default 2.0 and 5.0)
- Custom Colors: Choose colors for different threshold breaches
- Separate 21/50 Settings: Independent color schemes for each moving average
Symbol Settings
- Show Char Symbol: Toggle symbol plotting for each moving average
- Custom Symbols: Choose any character for chart plotting
- Symbol Colors: Customize colors for visual distinction
- Threshold Levels: Set trigger points for symbol appearance
ATR Extension Lines
- Show Extension Lines: Toggle visual extension level lines
- ATR Multipliers: Customize extension distance (default 2.0x)
- Line Colors: Choose colors for extension level visualization
Table Customization
- Background Color: Adjust table transparency and color
- Text Color: Customize default text appearance
- Font Size: Choose from tiny to huge font options
Advanced Applications
Trend Strength Analysis
- Large ATR distances suggest strong trending moves
- Small ATR distances indicate potential consolidation or reversal zones
- Compare current readings to recent historical ranges
Risk Management
- Use ATR% for position sizing calculations
- Extension levels provide natural profit target zones
- Distance metrics help identify overextended conditions
Multi-Timeframe Context
- Apply to different timeframes for comprehensive analysis
- Daily data provides consistency across all chart intervals
- Combine with weekly/monthly analysis for broader context
Market Regime Identification
- High volatility periods: Increased ATR% readings
- Low volatility periods: Compressed ATR% readings
- Trending markets: Sustained high distance readings
- Consolidating markets: Low distance readings with frequent color changes
Best Practices
Volatility-Adjusted Trading
- Increase position sizes during low volatility periods
- Reduce position sizes during high volatility periods
- Use ATR% for stop-loss placement relative to normal market movement
Extension Level Usage
- Primary targets: 1.5-2.0x ATR extensions
- Secondary targets: 2.5-3.0x ATR extensions
- Avoid chasing prices beyond 3x ATR extensions
Threshold Optimization
- Backtest different threshold levels for your trading style
- Consider market conditions when setting alert levels
- Adjust thresholds based on instrument volatility characteristics
Integration Strategies
- Combine with momentum indicators for confirmation
- Use alongside support/resistance levels
- Incorporate into systematic trading approaches
Technical Specifications
- Compatible with Pine Script v6
- Uses daily timeframe data for consistency
- Optimized for real-time performance
- Works on all chart types and timeframes
- Supports all tradeable instruments
Ideal For
- Swing traders using daily charts
- Position traders seeking volatility context
- Day traders needing intraday reference levels
- Risk managers requiring volatility metrics
- Systematic traders building rule-based strategies
Disclaimer
This indicator is for educational and informational purposes only. It should not be used as the sole basis for trading decisions. Always combine with other forms of analysis, proper risk management techniques, and consider your individual trading plan and risk tolerance. Past performance does not guarantee future results.
Compatible with Pine Script v6 | Optimized for daily timeframe analysis | Works across all markets and instruments

21DMA Structure Counter (EMA/SMA Option)21DMA Structure Counter (EMA/SMA Option)
Overview
The 21DMA Structure Counter is an advanced technical indicator that tracks consecutive periods where price action remains above a 21-period moving average structure. This indicator helps traders identify momentum phases and potential trend exhaustion points using statistical analysis.
Key Features
Moving Average Structure
- Configurable MA Type: Choose between EMA (Exponential Moving Average) or SMA (Simple Moving Average)
- 21-Period Default: Optimized for the widely-watched 21-period moving average
- Triple MA Structure: Tracks high, close, and low moving averages for comprehensive analysis
Statistical Analysis
- Cycle Counting: Automatically counts consecutive periods above the MA structure
- Historical Data: Maintains up to 2,500 historical cycles (approximately 10 years of daily data)
- Z-Score Calculation: Provides statistical context using mean and standard deviation
- Multiple Standard Deviation Levels: Displays +1, +2, and +3 standard deviation thresholds
Visual Indicators
Color-Coded Bars:
- Gray: Below 10-year average
- Yellow: Between average and +1 standard deviation
- Orange: Between +1 and +2 standard deviations
- Red: Between +2 and +3 standard deviations
- Fuchsia: Above +3 standard deviations (extreme readings)
Breadth Integration
- Multiple Breadth Options: NDFI, NDTH, NDTW (NASDAQ breadth indicators), or VIX
- Background Shading: Visual alerts when breadth reaches extreme levels
- High/Low Thresholds: Customizable levels for breadth analysis
- Real-time Display: Current breadth value shown in data table
Smart Reset Logic
- High Below Structure Reset: Automatically resets count when daily high falls below the lowest MA
- Flexible Hold Period: Continues counting during temporary weakness as long as structure isn't violated
- Precise Entry/Exit: Strict criteria for starting cycles, flexible for maintaining them
How to Use
Trend Identification
- Rising Counts: Indicate sustained momentum above key moving average structure
- Extreme Readings: Z-scores above +2 or +3 suggest potential trend exhaustion
- Historical Context: Compare current cycles to 10-year statistical averages
Risk Management
- Breadth Confirmation: Use breadth shading to confirm market-wide strength/weakness
- Statistical Extremes: Exercise caution when readings reach +3 standard deviations
- Reset Signals: Pay attention to structure violations for potential trend changes
Multi-Timeframe Application
- Daily Charts: Primary timeframe for swing trading and position management
- Weekly/Monthly: Longer-term trend analysis
- Intraday: Shorter-term momentum assessment (adjust MA period accordingly)
Settings
Moving Average Options
- Type: EMA or SMA selection
- Period: Default 21 (customizable)
- Reset Days: Days below structure required for reset
Visual Customization
- Standard Deviation Lines: Toggle and customize colors for +1, +2, +3 SD
- Breadth Selection: Choose from NDFI, NDTH, NDTW, or VIX
- Threshold Levels: Set custom high/low breadth thresholds
- Table Styling: Customize text colors, background, and font size
Technical Notes
- Data Retention: Maintains 2,500 historical cycles for robust statistical analysis
- Real-time Updates: Calculations update with each new bar
- Breadth Integration: Uses security() function to pull external breadth data
- Performance Optimized: Efficient array management prevents memory issues
Best Practices
1. Combine with Price Action: Use alongside support/resistance and chart patterns
2. Monitor Breadth Divergences: Watch for breadth weakness during strong readings
3. Respect Statistical Extremes: Exercise caution at +2/+3 standard deviation levels
4. Context Matters: Consider overall market environment and sector rotation
5. Risk Management: Use appropriate position sizing, especially at extreme readings
Disclaimer
This indicator is for educational and informational purposes only. It should not be used as the sole basis for trading decisions. Always combine with other forms of analysis and proper risk management techniques.
Compatible with Pine Script v6 | Optimized for daily timeframes | Best used on major indices and liquid stocks

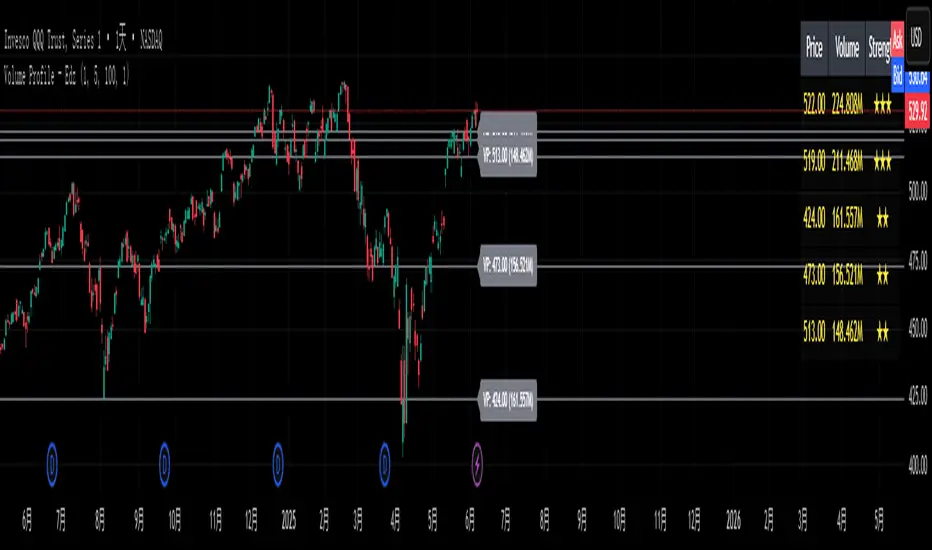
Volume Profile - EdzVolume Profile – Edz is a lightweight indicator that identifies the top high-volume price levels over a recent range of candles, using customizable price binning (priceStep) and lookback length. It highlights the top N volume clusters with horizontal lines, labels, and strength-based star ratings (★–★★★), and displays a compact summary table showing price, volume, and relative strength. Optimized for intraday and short-term trading, this tool updates only on the latest bar for maximum performance and is ideal for spotting volume-based support, resistance, and high-confluence trading zones.
SMEMA Trend CoreSMEMA Trend Core is a multi-timeframe trend analysis tool designed to provide a clean, adaptive and structured view of the market’s directional bias. It can be used in short term, swing or long term contexts. The internal calculation adjusts automatically based on the selected trading style, while always combining data from six timeframes.
At its core, the indicator uses a SMEMA, which is a Simple Moving Average applied to an EMA. This combination improves smoothness without losing reactivity. The SMEMA is calculated separately on 1H, 4H, 1D, 3D, 1W and 1M timeframes. These six values are then combined using dynamic weights that depend on the trading mode:
Short Term mode gives more influence to 1H and 4H
Swing Trading mode gives more influence to 1D, 3D and 1W
Long Term mode gives more influence to 1W and 1M
However, all six timeframes are always included in the final result. This avoids the tunnel vision of relying on a single resolution and ensures that the indicator captures both local and structural movements.
The result is a synthetic trend line, called Global SMEMA, that adapts to market conditions and offers a realistic view of the ongoing trend. To enhance the reading, the indicator calculates a Trend Score. This score reflects the position of price relative to the Global SMEMA, scaled by a long-term ATR, and adjusted by the slope of the trend line. A hyperbolic tangent function is used to normalize values and reduce distortion from outliers.
The final score is capped between -10 and +10, and used to define the trend state:
Green when the trend is bullish (score > +1.5)
Red when the trend is bearish (score < -1.5)
Brown when the trend is neutral (score between -1.5 and +1.5)
Optional Deviation Bands can be displayed at ±1, ±2 and ±3 ATR distances around the central line. These dynamic zones help identify extended price movements or potential support and resistance areas, depending on the current trend bias.
Main features:
A single, stable trend line based on six timeframes
Automatic rebalancing depending on trading mode
Quantified score integrating distance and slope
No overreaction to short-term noise
Deviation zones for advanced market context
No repainting, no lookahead, 100% real-time
SMEMA Trend Core is not a signal tool. It is a directional framework that helps you stay aligned with the real structure of the market. Use it to confirm setups, filter trades or simply understand where the market stands in its trend cycle.

Auto-Trend Finder (Pivot + ADX)Inspired in part by LuxAlgo Trendlines with Breaks. Extended and enhanced for directional clarity and pivot-based precision.
🔍 What It Does
The Auto-Trend Finder (Pivot + ADX) is a smart trend-detection toolkit that combines:
Pivot-based swing detection (HH, HL, LH, LL)
ADX-filtered trendline projections
Custom slope estimation using ATR, Standard Deviation, Linear Regression, or a blended approach
Candlestick pattern detection for added confirmation (e.g., hammer, engulfing, shooting star)
📈 How It Works
1. Swing Detection
Uses ta.pivothigh / ta.pivotlow to mark major price turning points.
Labels pivots as Higher High (HH), Lower High (LH), Lower Low (LL), or Higher Low (HL).
Optionally overlays basic candle pattern names for visual context.
2. Trendline Logic
Connects successive pivot highs/lows with real-time trendlines.
Draws separate Uptrend and Downtrend lines with distinct colors.
3. Extended Projections
Projects extended dashed lines from the last pivot using slope formulas:
ATR-based (volatility)
Stdev-based (dispersion)
Linear Regression (trend best-fit)
Or a Combined slope using user-defined weights.
Color changes dynamically on breakout to visually signal momentum shifts.
4. ADX Trend Strength Filter
Optional ADX filter disables trendline updates unless directional strength exceeds a threshold (e.g. 20+).
Helps remove noise in sideways markets.
⚠️ Important Notes
Backpainting Warning: This script includes a backpainting setting (backpaint) that may cause lines to appear "reliably predictive" in historical data. Backpainting does not repaint once the pivot is confirmed, but it still reflects a post-fact state. Use this feature cautiously in live trading decisions.
Reused Code Attribution: Extended trendline concept and breakout color logic were inspired by publicly available open-source versions of LuxAlgo's trendline logic. Credit is given in the script comments and here as required.
🛠️ How to Use It
Adjust Pivot Length for swing detection sensitivity.
Toggle ADX filtering on or off to avoid choppy signals.
Choose your preferred Slope Calculation Method.
Use candlestick labels as potential entry signals near trendline retests or breaks.
✅ Why This Is More Than a Mashup
This tool integrates several separate technical methods into one cohesive, customizable framework:
It’s not just combining indicators, it’s engineering synergy between them.
The slope and ADX filtering mechanics dynamically adjust to trend strength.
Candlestick confirmation and labeling give visual, real-time trade confidence.
It enhances open-source logic by adding modular slope options, ADX gating, pattern labeling, and user control.
"Know the structure. Follow the strength. Trade with clarity. Auto-Trend Finder is your edge in the chaos."

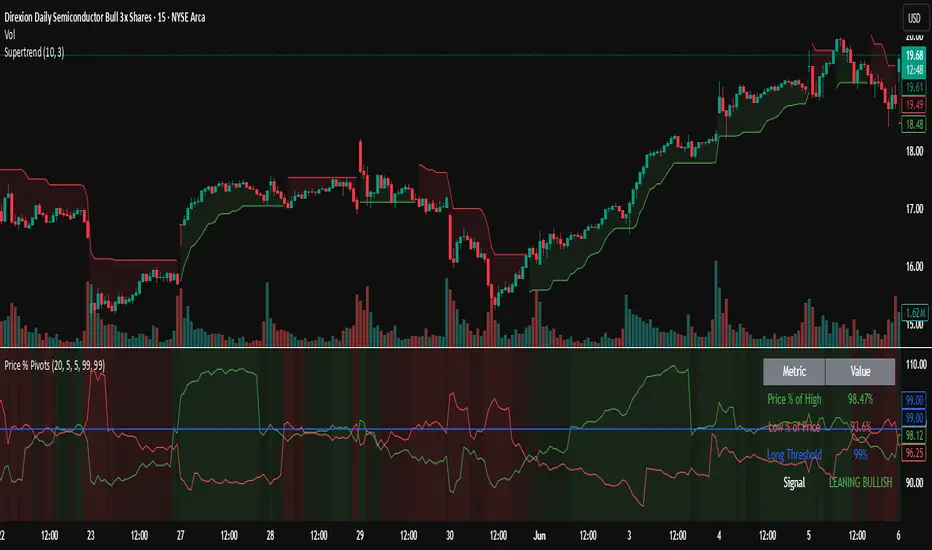
Trending Indicator: Price % of Pivots# Price % of Pivots Indicator
## Overview
A trend-following indicator that measures current price position relative to recent pivot highs and lows as percentages, providing normalized trend analysis across all timeframes and instruments.
## Key Features
- **Real-time trend table** with live signal updates (Strong Bullish/Bearish, Leaning Bullish/Bearish, Neutral)
- **Dual percentage tracking**: Price % of high pivot and low pivot % of current price
- **Universal compatibility** - works on any timeframe and asset class
- **Faster than some other trend indicators** - catches trend changes earlier with less lag
## Trading Signals
- **Bullish bias**: When price % of high pivot > low pivot % of price
- **Bearish bias**: When low pivot % of price > price % of high pivot
- **Customizable thresholds** (default 99%) with alert system
- **Color-coded backgrounds** for immediate visual confirmation
## Configuration
- Adjustable pivot lookback period (5-100 bars)
- Customizable left/right bars for pivot confirmation
- Threshold settings from 50-110% with 0.5% increments
- Full color customization for all elements
## Advantages
- **Speed**: More responsive than traditional ATR-based indicators
- **Clarity**: Clean percentage-based display with professional info table
- **Alerts**: Multiple conditions for automated and manual trading
- **Versatility**: Effective for day trading, swing trading, and multi-timeframe analysis
Perfect for traders seeking a fast, reliable trend indicator that works consistently across all markets and timeframes.
Pullback Candle (Bullish & Bearish, No EMA)🔍 Purpose
This indicator detects simple pullback reversal patterns based on price action and swing highs/lows — without any moving average or trend filters.
It highlights:
Bullish pullbacks (potential bounce/long setups)
Bearish pullbacks (potential rejection/short setups)
📈 Bullish Pullback Criteria
Three-bar pattern:
Bar 3: Highest close
Bar 2: Lower close
Bar 1: Even lower close
Current bar closes above previous bar (bullish reversal)
One of the last two candles is the lowest low of the past 6 bars (swing low)
📍 Result: A small green cross is plotted below the bar, and the bar is colored green.
📉 Bearish Pullback Criteria
Three-bar pattern:
Bar 3: Lowest close
Bar 2: Higher close
Bar 1: Even higher close
Current bar closes below previous bar (bearish reversal)
One of the last two candles is the highest high of the past 10 bars (swing high)
📍 Result: A small red cross is plotted above the bar, and the bar is colored red.
🔔 Alerts
One alert condition each for bullish and bearish pullback detection.
Can be used to trigger TradingView alerts.
🛠️ Customization
No inputs — fully automated logic
Clean, minimal, and fast
Can be extended with labels, alert sounds, or signals

Vix_Fix Enhanced MTF [Cometreon]The VIX Fix Enhanced is designed to detect market bottoms and spikes in volatility, helping traders anticipate major reversals with precision. Unlike standard VIX Fix tools, this version allows you to control the standard deviation logic, switch between chart styles, customize visual outputs, and set up advanced alerts — all with no repainting.
🧠 Logic and Calculation
This indicator is based on Larry Williams' VIX Fix and integrates features derived from community requests/advice, such as inverse VIX logic.
It calculates volatility spikes using a customizable standard deviation of the lows and compares it to a moving high to identify potential reversal points.
All moving average logic is based on Cometreon's proprietary library, ensuring accurate and optimized calculations on all 15 moving average types.
🔷 New Features and Improvements
🟩 Custom Visual Styles
Choose how you want your VIX data displayed:
Line
Step Line
Histogram
Area
Column
You can also flip the orientation (bottom-up or top-down), change the source ticker, and tailor the display to match your charting preferences.
🟩 Multi-MA Standard Deviation Calculation
Customize the standard deviation formula by selecting from 15 different moving averages:
SMA (Simple Moving Average)
EMA (Exponential Moving Average)
WMA (Weighted Moving Average)
RMA (Smoothed Moving Average)
HMA (Hull Moving Average)
JMA (Jurik Moving Average)
DEMA (Double Exponential Moving Average)
TEMA (Triple Exponential Moving Average)
LSMA (Least Squares Moving Average)
VWMA (Volume-Weighted Moving Average)
SMMA (Smoothed Moving Average)
KAMA (Kaufman’s Adaptive Moving Average)
ALMA (Arnaud Legoux Moving Average)
FRAMA (Fractal Adaptive Moving Average)
VIDYA (Variable Index Dynamic Average)
This gives you fine control over how volatility is measured and allows tuning the sensitivity for different market conditions.
🟩 Full Control Over Percentile and Deviation Conditions
You can enable or disable lines for standard deviation and percentile conditions, and define whether you want to trigger on over or under levels — adapting the indicator to your exact logic and style.
🟩 Chart Type Selection
You're no longer limited to candlestick charts! Now you can use Vix_Fix with different chart formats, including:
Candlestick
Heikin Ashi
Renko
Kagi
Line Break
Point & Figure
🟩 Multi-Timeframe Compatibility Without Repainting
Use a different timeframe from your chart with confidence. Signals remain stable and do not repaint. Perfect for spotting long-term reversal setups on lower timeframes.
🟩 Alert System Ready
Configure alerts directly from the indicator’s panel when conditions for over/under signals are met. Stay informed without needing to monitor the chart constantly.
🔷 Technical Details and Customizable Inputs
This indicator includes full control over the logic and appearance:
1️⃣ Length Deviation High - Adjusts the lookback period used to calculate the high deviation level of the VIX logic. Shorter values make it more reactive; longer values smooth out the signal.
2️⃣ Ticker - Choose a different chart type for the calculation, including Heikin Ashi, Renko, Kagi, Line Break, and Point & Figure.
3️⃣ Style VIX - Change the visual style (Line, Histogram, Column, etc.), adjust line width, and optionally invert the display (bottom-to-top).
📌 Fill zones for deviation and percentile are active only in Line and Step Line modes
4️⃣ Use Standard Deviation Up / Down - Enable the overbought and oversold zone logic based on upper and lower standard deviation bands.
5️⃣ Different Type MA (for StdDev) - Choose from 15 different moving averages to define the calculation method for standard deviation (SMA, EMA, HMA, JMA, etc.), with dedicated parameters like Phase, Sigma, and Offset for optimized responsiveness.
6️⃣ BB Length & Multiplier - Adjust the period and multiplier for the standard deviation bands, similar to how Bollinger Bands work.
7️⃣ Show StdDev Up / Down Line - Enable or disable the visibility of upper and lower standard deviation boundaries.
8️⃣ Use Percentile & Length High - Activate the percentile-based logic to detect extreme values in historical volatility using a customizable lookback length.
9️⃣ Highest % / Lowest % - Set the high and low percentile thresholds (e.g., 85 for high, 99 for low) that will be used to trigger over/under signals.
🔟 Show High / Low Percentile Line - Toggle the visual display of the percentile boundaries directly on the chart for clearer signal reference.
1️⃣1️⃣ Ticker Settings – Customize parameters for special chart types such as Renko, Heikin Ashi, Kagi, Line Break, and Point & Figure, adjusting reversal, number of lines, ATR length, etc.
1️⃣2️⃣ Timeframe – Enables using SuperTrend on a higher timeframe.
1️⃣3️⃣ Wait for Timeframe Closes -
✅ Enabled – Displays Vix_Fix smoothly with interruptions.
❌ Disabled – Displays Vix_Fix smoothly without interruptions.
☄️ If you find this indicator useful, leave a Boost to support its development!
Every feedback helps to continuously improve the tool, offering an even more effective trading experience. Share your thoughts in the comments! 🚀🔥

BBS – Bond Breadth Signal"When bonds scream, breadth collapses, and fear spikes — BBS listens."
🧠 BBS – Bond Breadth Signal
A reversal timing tool built on macro conviction, not price noise.
The Bond Breadth Signal (BBS) was developed to identify major market inflection points by combining four key market stress indicators:
1) 10-Year Yield ROC – Measures sharp moves in the bond market
2) Z-Score of the 10Y – Captures statistical extremes
3) NSHF (Net Highs–Lows) – Signals internal market strength or weakness
4) TLT ROC + VIX – Confirmations of flight to safety and volatility-driven fear
When all conditions align, BBS marks either a For-Sure Buy or For-Sure Sell — these are rare, high-confidence signals designed to cut through noise and focus on true market dislocations.
🔧 Features:
-Background color and signal arrows on confirmation days
-Signals remain visually active for 3 days for added clarity
-Fully adjustable thresholds and alert toggles
-Plot panel for yield, TLT, NSHF, VIX, and Z-score visuals
This tool isn’t designed to fire every day. It’s meant to wait for those moments when the market truly bends — not just wiggles.
Best used on major indices (SPY, QQQ, IWM) to assess macro turning points.

System 0530 - Stoch RSI Strategy with ATR filterStrategy Description: System 0530 - Multi-Timeframe Stochastic RSI with ATR Filter
Overview:
This strategy, "System 0530," is designed to identify trading opportunities by leveraging the Stochastic RSI indicator across two different timeframes: a shorter timeframe for initial signal triggers (assumed to be the chart's current timeframe, e.g., 5-minute) and a longer timeframe (15-minute) for signal confirmation. It incorporates an ATR (Average True Range) filter to help ensure trades are taken during periods of adequate market volatility and includes a cooldown mechanism to prevent rapid, successive signals in the same direction. Trade exits are primarily handled by reversing signals.
How It Works:
1. Signal Initiation (e.g., 5-Minute Timeframe):
Long Signal Wait: A potential long entry is considered when the 5-minute Stochastic RSI %K line crosses above its %D line, AND the %K value at the time of the cross is at or below a user-defined oversold level (default: 30).
Short Signal Wait: A potential short entry is considered when the 5-minute Stochastic RSI %K line crosses below its %D line, AND the %K value at the time of the cross is at or above a user-defined overbought level (default: 70). When these conditions are met, the strategy enters a "waiting state" for confirmation from the 15-minute timeframe.
2. Signal Confirmation (15-Minute Timeframe):
Once in a waiting state, the strategy looks for confirmation on the 15-minute Stochastic RSI within a user-defined number of 5-minute bars (wait_window_5min_bars, default: 5 bars).
Long Confirmation:
The 15-minute Stochastic RSI %K must be greater than or equal to its %D line.
The 15-minute Stochastic RSI %K value must be below a user-defined threshold (stoch_15min_long_entry_level, default: 40).
Short Confirmation:
The 15-minute Stochastic RSI %K must be less than or equal to its %D line.
The 15-minute Stochastic RSI %K value must be above a user-defined threshold (stoch_15min_short_entry_level, default: 60).
3. Filters:
ATR Volatility Filter: If enabled, trades are only confirmed if the current ATR value (converted to ticks) is above a user-defined minimum threshold (min_atr_value_ticks). This helps to avoid taking signals during periods of very low market volatility. If the ATR condition is not met, the strategy continues to wait for the condition to be met within the confirmation window, provided other conditions still hold.
Signal Cooldown Filter: If enabled, after a signal is generated, the strategy will wait for a minimum number of bars (min_bars_between_signals) before allowing another signal in the same direction. This aims to reduce overtrading.
4. Entry and Exit Logic:
Entry: A strategy.entry() order is placed when all trigger, confirmation, and filter conditions are met.
Exit: This strategy primarily uses reversing signals for exits. For example, if a long position is open, a confirmed short signal will close the long position and open a new short position. There are no explicit take profit or stop loss orders programmed into this version of the script.
Key User-Adjustable Parameters:
Stochastic RSI Parameters: RSI Length, Stochastic RSI Length, %K Smoothing, %D Smoothing.
Signal Trigger & Confirmation:
5-minute %K trigger levels for long and short.
15-minute %K confirmation thresholds for long and short.
Wait window (in 5-minute bars) for 15-minute confirmation.
Filters:
Enable/disable and configure the Signal Cooldown filter (minimum bars between signals).
Enable/disable and configure the ATR Volatility filter (ATR period, minimum ATR value in ticks).
Strategy Parameters:
Leverage Multiplier (Note: This primarily affects theoretical position sizing for backtesting calculations in TradingView and does not simulate actual leveraged trading risks).
Recommendations for Users:
Thorough Backtesting: Test this strategy extensively on historical data for the instruments and timeframes you intend to trade.
Parameter Optimization: Experiment with different parameter settings to find what works best for your trading style and chosen markets. The default values are starting points and may not be optimal for all conditions.
Understand the Logic: Ensure you understand how each component (Stochastic RSI on different timeframes, ATR filter, cooldown) interacts to generate signals.
Risk Management: Since this version does not include explicit stop-loss orders, ensure you have a clear risk management plan in place if trading this strategy live. You might consider manually adding stop-loss orders through your broker or using TradingView's separate strategy order settings for stop-loss if applicable.
Disclaimer:
This strategy description is for informational purposes only and does not constitute financial advice. Past performance is not indicative of future results. Trading involves significant risk of loss. Always do your own research and understand the risks before trading.

atr stop loss for double SMA v6Strategy Name
atr stop loss for double SMA v6
Credit: This v6 update is based on Daveatt’s “BEST ATR Stop Multiple Strategy.”
Core Logic
Entry: Go long when the 15-period SMA crosses above the 45-period SMA; go short on the inverse cross.
Stop-Loss: On entry, compute ATR(14)×2.0 and set a fixed stop at entry ± that amount. Stop remains static until hit.
Trend Tracking: Uses barssince() to ensure only one active long or short position; stop is only active while that trend persists.
Visualization
Plots fast/slow SMA lines in teal/orange.
On each entry bar, displays a label showing “ATR value” and “ATR×multiple” positioned at the 30-bar low (long) or high (short).
Draws an “×” at the stop-price level in green (long) or red (short) while the position is open.
Execution Settings
Initial Capital: $100 000, Size = 100 shares per trade.
Commission: 0.075% per trade.
Pyramiding: 1.
Calculations: Only on bar close (no intra-bar ticks).
Usage Notes
Static ATR stop adapts to volatility but does not trail.
Ideal for trending, liquid markets (stocks, futures, FX).
Adjust SMA lengths or ATR multiple for faster/slower signals.

Directional Strength IndexThis indicator is designed to detect the dominant market direction and quantify its strength by aggregating signals across six key timeframes: 1H, 4H, 1D, 3D, 1W, and 1M.
At its core, it uses a SMEMA 'the Simple Moving Average of an EMA' as the main trend reference. This hybrid smoothing method was chosen for its balance: the EMA ensures responsiveness to recent price moves, while the SMA dampens short-term volatility. This makes the SMEMA more stable than a raw EMA and more reactive than a simple SMA, especially in noisy or volatile environments.
For each timeframe, a score between -10 and +10 is calculated. This score reflects:
- the distance of the price from the SMEMA, using ATR as a dynamic threshold
- the number of price deviations above or below the SMEMA
- the slope of the SMEMA, which adjusts the score based on momentum
These six timeframe scores are then combined into a single Global Score, using weighted averages. Three weighting profiles are available depending on your trading horizon:
- Long Term: emphasizes weekly and monthly data
- Swing Trading: gives balanced importance to all timeframes
- Short Term: prioritizes 1H and 4H action
This multi-timeframe aggregation makes the indicator adaptable to different styles while maintaining a consistent logic.
The result is displayed in a table on the chart, showing:
- the trend direction per timeframe (up, down or neutral)
- the strength score per timeframe
- the overall trend direction and strength based on the selected profile
Optional deviation bands based on ATR multiples are also plotted to provide visual context for overextensions relative to the SMEMA.
This indicator is non-repainting and built for objective, trend-based decision making.

HARSI PRO v2 - Advanced Adaptive Heikin-Ashi RSI OscillatorThis script is a fully re-engineered and enhanced version of the original Heikin-Ashi RSI Oscillator created by JayRogers. While it preserves the foundational concept and visual structure of the original indicatorusing Heikin-Ashi-style candles to represent RSI movementit introduces a range of institutional-grade engines and real-time analytics modules.
The core idea behind HARSI is to visualize the internal structure of RSI behavior using candle representations. This gives traders a clearer sense of trend continuity, exhaustion, and momentum inflection. In this upgraded version, the system is extended far beyond basic visualization into a comprehensive diagnostic and context-tracking tool.
Core Enhancements and Features
1. Heikin-Ashi RSI Candles
The base HARSI logic transforms RSI values into open, high, low, and close components, which are plotted as Heikin-Ashi-style candles. The open values are smoothed with a user-controlled bias setting, and the high/low are calculated from zero-centered RSI values.
2. Smoothed RSI Histogram and Plot
A secondary RSI plot and histogram are available for traditional RSI interpretation, optionally smoothed using a custom midpoint EMA process.
3. Dynamic Stochastic RSI Ribbon
The indicator optionally includes a smoothed Stochastic RSI ribbon with directional fill to highlight acceleration and reversal zones.
4. Real-Time Meta-State Engine
This engine determines the current market environmentneutral, breakout, or reversalbased on multiple adaptive conditions including volatility compression, momentum thrust, volume behavior, and composite reversal scoring.
5. Adaptive Overbought/Oversold Zone Engine
Instead of using fixed RSI thresholds, this engine dynamically adjusts OB/OS boundaries based on recent RSI range and normalized price volatility. This makes the OB/OS levels context-sensitive and more accurate across different instruments and regimes.
6. Composite Reversal Score Engine
A real-time score between 0 and 5 is generated using four components:
* OB/OS proximity (zone score)
* RSI slope behavior
* Volume state (burst or exhaustion)
* Trend continuation penalty based on position versus trend bias
This score allows for objective filtering of reversal zones and breakout traps.
7. Kalman Velocity Filter
A Kalman-style adaptive smoothing filter is applied to RSI for calculating velocity and acceleration. This allows for real-time detection of stalls and thrusts in RSI behavior.
8. Predictive Breakout Estimator
Uses ATR compression and RSI thrusting conditions to detect likely breakout environments. This logic contributes to the Meta-State Engine and the Breakout Risk dashboard metric.
9. Volume Acceleration Model
Real-time detection of volume bursts and fades based on VWMA baselines. Volume exhaustion warnings are used to qualify or disqualify reversals and breakouts.
10. Trend Bias and Regime Detection
Uses RSI slope, HARSI body impulse, and normalized ATR to classify the current trend state and directional bias. This forms the basis for filtering false reversals during strong trends.
11. Dashboard with Tooltips
A clean, table displays six key metrics in real time:
* Meta State
* Reversal Score
* Trend Bias
* Volume State
* Volatility Regime
* Breakout Risk
Each cell includes a descriptive tooltip explaining why the value is being shown based on internal state calculations.
How It Works Internally
* The system calculates a zero-centered RSI and builds candle structures using high, low, and smoothed open/close values.
* Volatility normalization is used throughout the script, including ATR-based thresholds and dynamic scaling of OB/OS zones.
* Momentum is filtered through smoothed slope calculations and HARSI body size measurements.
* Volume activity is compared against VWMA using configurable multipliers to detect institutional-level activity or exhaustion.
* Each regime detection module contributes to a centralized metaState classifier that determines whether the environment is conducive to reversal, breakout, or neutral action.
* All major signal and context values are continuously updated in a dashboard table with logic-driven color coding and tooltips.
Based On and Credits
This script is based on the original Heikin-Ashi RSI Oscillator by JayRogers . All visual elements from the original version, including candle plotting and color configurations, have been retained and extended. Significant backend enhancements were added by AresIQ for the 2025 release. The script remains open-source under the original attribution license. Credit to JayRogers is preserved and required for any derivative versions.

Advanced Petroleum Market Model (APMM)Advanced Petroleum Market Model (APMM): A Multi-Factor Fundamental Analysis Framework for Oil Market Assessment
## 1. Introduction
The petroleum market represents one of the most complex and globally significant commodity markets, characterized by intricate supply-demand dynamics, geopolitical influences, and substantial price volatility (Hamilton, 2009). Traditional fundamental analysis approaches often struggle to synthesize the multitude of relevant indicators into actionable insights due to data heterogeneity, temporal misalignment, and subjective weighting schemes (Baumeister & Kilian, 2016).
The Advanced Petroleum Market Model addresses these limitations through a systematic, quantitative approach that integrates 16 verified fundamental indicators across five critical market dimensions. The model builds upon established financial engineering principles while incorporating petroleum-specific market dynamics and adaptive learning mechanisms.
## 2. Theoretical Framework
### 2.1 Market Efficiency and Information Integration
The model operates under the assumption of semi-strong market efficiency, where fundamental information is gradually incorporated into prices with varying degrees of lag (Fama, 1970). The petroleum market's unique characteristics, including storage costs, transportation constraints, and geopolitical risk premiums, create opportunities for fundamental analysis to provide predictive value (Kilian, 2009).
### 2.2 Multi-Factor Asset Pricing Theory
Drawing from Ross's (1976) Arbitrage Pricing Theory, the model treats petroleum prices as driven by multiple systematic risk factors. The five-factor decomposition (Supply, Inventory, Demand, Trade, Sentiment) represents economically meaningful sources of systematic risk in petroleum markets (Chen et al., 1986).
## 3. Methodology
### 3.1 Data Sources and Quality Framework
The model integrates 16 fundamental indicators sourced from verified TradingView economic data feeds:
Supply Indicators:
- US Oil Production (ECONOMICS:USCOP)
- US Oil Rigs Count (ECONOMICS:USCOR)
- API Crude Runs (ECONOMICS:USACR)
Inventory Indicators:
- US Crude Stock Changes (ECONOMICS:USCOSC)
- Cushing Stocks (ECONOMICS:USCCOS)
- API Crude Stocks (ECONOMICS:USCSC)
- API Gasoline Stocks (ECONOMICS:USGS)
- API Distillate Stocks (ECONOMICS:USDS)
Demand Indicators:
- Refinery Crude Runs (ECONOMICS:USRCR)
- Gasoline Production (ECONOMICS:USGPRO)
- Distillate Production (ECONOMICS:USDFP)
- Industrial Production Index (FRED:INDPRO)
Trade Indicators:
- US Crude Imports (ECONOMICS:USCOI)
- US Oil Exports (ECONOMICS:USOE)
- API Crude Imports (ECONOMICS:USCI)
- Dollar Index (TVC:DXY)
Sentiment Indicators:
- Oil Volatility Index (CBOE:OVX)
### 3.2 Data Quality Monitoring System
Following best practices in quantitative finance (Lopez de Prado, 2018), the model implements comprehensive data quality monitoring:
Data Quality Score = Σ(Individual Indicator Validity) / Total Indicators
Where validity is determined by:
- Non-null data availability
- Positive value validation
- Temporal consistency checks
### 3.3 Statistical Normalization Framework
#### 3.3.1 Z-Score Normalization
The model employs robust Z-score normalization as established by Sharpe (1994) for cross-indicator comparability:
Z_i,t = (X_i,t - μ_i) / σ_i
Where:
- X_i,t = Raw value of indicator i at time t
- μ_i = Sample mean of indicator i
- σ_i = Sample standard deviation of indicator i
Z-scores are capped at ±3 to mitigate outlier influence (Tukey, 1977).
#### 3.3.2 Percentile Rank Transformation
For intuitive interpretation, Z-scores are converted to percentile ranks following the methodology of Conover (1999):
Percentile_Rank = (Number of values < current_value) / Total_observations × 100
### 3.4 Exponential Smoothing Framework
Signal smoothing employs exponential weighted moving averages (Brown, 1963) with adaptive alpha parameter:
S_t = α × X_t + (1-α) × S_{t-1}
Where α = 2/(N+1) and N represents the smoothing period.
### 3.5 Dynamic Threshold Optimization
The model implements adaptive thresholds using Bollinger Band methodology (Bollinger, 1992):
Dynamic_Threshold = μ ± (k × σ)
Where k is the threshold multiplier adjusted for market volatility regime.
### 3.6 Composite Score Calculation
The fundamental score integrates component scores through weighted averaging:
Fundamental_Score = Σ(w_i × Score_i × Quality_i)
Where:
- w_i = Normalized component weight
- Score_i = Component fundamental score
- Quality_i = Data quality adjustment factor
## 4. Implementation Architecture
### 4.1 Adaptive Parameter Framework
The model incorporates regime-specific adjustments based on market volatility:
Volatility_Regime = σ_price / μ_price × 100
High volatility regimes (>25%) trigger enhanced weighting for inventory and sentiment components, reflecting increased market sensitivity to supply disruptions and psychological factors.
### 4.2 Data Synchronization Protocol
Given varying publication frequencies (daily, weekly, monthly), the model employs forward-fill synchronization to maintain temporal alignment across all indicators.
### 4.3 Quality-Adjusted Scoring
Component scores are adjusted for data quality to prevent degraded inputs from contaminating the composite signal:
Adjusted_Score = Raw_Score × Quality_Factor + 50 × (1 - Quality_Factor)
This formulation ensures that poor-quality data reverts toward neutral (50) rather than contributing noise.
## 5. Usage Guidelines and Best Practices
### 5.1 Configuration Recommendations
For Short-term Analysis (1-4 weeks):
- Lookback Period: 26 weeks
- Smoothing Length: 3-5 periods
- Confidence Period: 13 weeks
- Increase inventory and sentiment weights
For Medium-term Analysis (1-3 months):
- Lookback Period: 52 weeks
- Smoothing Length: 5-8 periods
- Confidence Period: 26 weeks
- Balanced component weights
For Long-term Analysis (3+ months):
- Lookback Period: 104 weeks
- Smoothing Length: 8-12 periods
- Confidence Period: 52 weeks
- Increase supply and demand weights
### 5.2 Signal Interpretation Framework
Bullish Signals (Score > 70):
- Fundamental conditions favor price appreciation
- Consider long positions or reduced short exposure
- Monitor for trend confirmation across multiple timeframes
Bearish Signals (Score < 30):
- Fundamental conditions suggest price weakness
- Consider short positions or reduced long exposure
- Evaluate downside protection strategies
Neutral Range (30-70):
- Mixed fundamental environment
- Favor range-bound or volatility strategies
- Wait for clearer directional signals
### 5.3 Risk Management Considerations
1. Data Quality Monitoring: Continuously monitor the data quality dashboard. Scores below 75% warrant increased caution.
2. Regime Awareness: Adjust position sizing based on volatility regime indicators. High volatility periods require reduced exposure.
3. Correlation Analysis: Monitor correlation with crude oil prices to validate model effectiveness.
4. Fundamental-Technical Divergence: Pay attention when fundamental signals diverge from technical indicators, as this may signal regime changes.
### 5.4 Alert System Optimization
Configure alerts conservatively to avoid false signals:
- Set alert threshold at 75+ for high-confidence signals
- Enable data quality warnings to maintain system integrity
- Use trend reversal alerts for early regime change detection
## 6. Model Validation and Performance Metrics
### 6.1 Statistical Validation
The model's statistical robustness is ensured through:
- Out-of-sample testing protocols
- Rolling window validation
- Bootstrap confidence intervals
- Regime-specific performance analysis
### 6.2 Economic Validation
Fundamental accuracy is validated against:
- Energy Information Administration (EIA) official reports
- International Energy Agency (IEA) market assessments
- Commercial inventory data verification
## 7. Limitations and Considerations
### 7.1 Model Limitations
1. Data Dependency: Model performance is contingent on data availability and quality from external sources.
2. US Market Focus: Primary data sources are US-centric, potentially limiting global applicability.
3. Lag Effects: Some fundamental indicators exhibit publication lags that may delay signal generation.
4. Regime Shifts: Structural market changes may require model recalibration.
### 7.2 Market Environment Considerations
The model is optimized for normal market conditions. During extreme events (e.g., geopolitical crises, pandemics), additional qualitative factors should be considered alongside quantitative signals.
## References
Baumeister, C., & Kilian, L. (2016). Forty years of oil price fluctuations: Why the price of oil may still surprise us. *Journal of Economic Perspectives*, 30(1), 139-160.
Bollinger, J. (1992). *Bollinger on Bollinger Bands*. McGraw-Hill.
Brown, R. G. (1963). *Smoothing, Forecasting and Prediction of Discrete Time Series*. Prentice-Hall.
Chen, N. F., Roll, R., & Ross, S. A. (1986). Economic forces and the stock market. *Journal of Business*, 59(3), 383-403.
Conover, W. J. (1999). *Practical Nonparametric Statistics* (3rd ed.). John Wiley & Sons.
Fama, E. F. (1970). Efficient capital markets: A review of theory and empirical work. *Journal of Finance*, 25(2), 383-417.
Hamilton, J. D. (2009). Understanding crude oil prices. *Energy Journal*, 30(2), 179-206.
Kilian, L. (2009). Not all oil price shocks are alike: Disentangling demand and supply shocks in the crude oil market. *American Economic Review*, 99(3), 1053-1069.
Lopez de Prado, M. (2018). *Advances in Financial Machine Learning*. John Wiley & Sons.
Ross, S. A. (1976). The arbitrage theory of capital asset pricing. *Journal of Economic Theory*, 13(3), 341-360.
Sharpe, W. F. (1994). The Sharpe ratio. *Journal of Portfolio Management*, 21(1), 49-58.
Tukey, J. W. (1977). *Exploratory Data Analysis*. Addison-Wesley.

Neural Adaptive VWAPNeural Adaptive VWAP with ML Features is an advanced trading indicator that enhances traditional Volume Weighted Average Price (VWAP) calculations through machine learning-inspired adaptive algorithms and predictive volume modeling.
🌟 Key Features:
🧠 Machine Learning-Inspired Adaptation
Dynamic weight adjustment system that learns from prediction errors
Multi-feature volume prediction using time-of-day patterns, price momentum, and volatility
Adaptive learning mechanism that improves accuracy over time
📊 Enhanced VWAP Calculation
Combines actual and predicted volume for forward-looking VWAP computation
Session-based reset with proper daily anchoring
Confidence bands based on rolling standard deviation for dynamic support/resistance
🎯 Advanced Signal Generation
Volume-confirmed crossover signals to reduce false entries
Color-coded candle visualization based on VWAP position
Multi-level strength indicators (strong/weak bullish/bearish zones)
⚙️ Intelligent Feature Engineering
Normalized volume analysis with statistical z-score
Time-series pattern recognition for intraday volume cycles
Price momentum and volatility integration
Sigmoid activation functions for realistic predictions
📈 How It Works:
The indicator employs a sophisticated feature engineering approach that extracts meaningful patterns from:
Volume Patterns: Normalized volume analysis and historical comparisons
Temporal Features: Time-of-day and minute-based cyclical patterns
Market Dynamics: Price momentum, volatility, and rate of change
Adaptive Learning: Error-based weight adjustment similar to neural network training
Unlike static VWAP indicators, this system continuously adapts its calculation methodology based on real-time market feedback, making it more responsive to changing market conditions while maintaining the reliability of traditional VWAP analysis.
🔧 Customizable Parameters:
VWAP Length (1-200 bars)
Volume Pattern Lookback (5-50 periods)
Learning Rate (0.001-0.1) for adaptation speed
Prediction Horizon (1-10 bars ahead)
Adaptation Period for weight updates
📊 Visual Elements:
Blue Line: Adaptive VWAP with predictive elements
Red/Green Bands: Dynamic confidence zones
Colored Candles: Position-based strength visualization
Signal Arrows: Volume-confirmed entry points
Info Table: Real-time performance metrics and weight distribution
🎯 Best Use Cases:
Intraday Trading: Enhanced execution timing with volume prediction
Institutional-Style Execution: Improved VWAP-based order placement
Trend Following: Adaptive trend identification with confidence zones
Support/Resistance Trading: Dynamic levels that adjust to market conditions

Liquidity Sweep Candlestick Pattern with MA Filter📌 Liquidity Sweep Candlestick Pattern with MA Filter
This custom indicator detects liquidity sweep candlestick patterns—price action events where the market briefly breaks a previous candle’s high or low to trap traders—paired with optional filters such as moving averages, color change candles, and strictness rules for better signal accuracy.
🔍 What is a Liquidity Sweep?
A liquidity sweep occurs when the price briefly breaks the high or low of a previous candle and then reverses direction. These events often occur around key support/resistance zones and are used by institutional traders to trap retail positions before moving the price in the intended direction.
🟢 Bullish Liquidity Sweep Criteria
The current candle is bullish (closes above its open).
The low of the current candle breaks the low of the previous candle.
The candle closes above the previous candle’s open.
Optionally, in Strict mode, it must also close above the previous candle’s high.
Optionally, it can be filtered to only show if the candle changed color from the previous one (e.g., red to green).
Can be filtered to only show when the price is above or below a moving average (if MA filter is enabled).
🔴 Bearish Liquidity Sweep Criteria
The current candle is bearish (closes below its open).
The high of the current candle breaks the high of the previous candle.
The candle closes below the previous candle’s open.
Optionally, in Strict mode, it must also close below the previous candle’s low.
Optionally, it can be filtered to only show if the candle changed color from the previous one (e.g., green to red).
Can be filtered to only show when the price is above or below a moving average (if MA filter is enabled).
⚙️ Features & Customization
✅ Signal Strictness
Choose between:
Less Strict (default): Basic wick break and close conditions.
Strict: Must close beyond the wick of the previous candle.
✅ Color Change Candles Only
Enable this to only show patterns when the candle color changes (e.g., from red to green or green to red). Helps filter fake-outs.
✅ Moving Average Filter (optional)
Supports several types of MAs: SMA, EMA, WMA, VWMA, RMA, HMA
Choose whether signals should only appear above or below the selected moving average.
✅ Custom Visuals
Show short (BS) or full (Bull Sweep / Bear Sweep) labels
Plot triangles or arrows to represent bullish and bearish sweeps
Customize label and shape colors
Optionally show/hide the moving average line
✅ Alerts
Includes alert options for:
Bullish sweep
Bearish sweep
Any sweep
📈 How to Use
Add the indicator to your chart.
Configure the strictness, color change, or MA filters based on your strategy.
Observe signals where price is likely to reverse after taking out liquidity.
Use with key support/resistance levels, order blocks, or volume zones for confluence.
⚠️ Note
This tool is for educational and strategy-building purposes. Always confirm signals with other indicators, context, and sound risk management.

QQQ Strategy v2 ESL | easy-peasy-x This is a strategy optimized for QQQ (and SPY) for the 1H timeframe. It significantly outperforms passive buy-and-hold approach. With settings adjustments, it can be used on various assets like stocks and cryptos and various timeframes, although the default out of the box settings favor QQQ 1H.
The strategy uses various triggers to take both long and short trades. These can be adjusted in settings. If you try a different asset, see what combination of triggers works best for you.
Some of the triggers employ LuxAlgo's Ultimate RSI - shoutout to him for great script, check it out here .
Other triggers are based on custom signed standard deviation - basically the idea is to trade Bollinger Bands expansions (long to the upside, short to the downside) and fade or stay out of contractions.
There are three key moving averages in the strategy - LONG MA, SHORT MA, BASIC MA. Long and Short MAs are guides to eyes on the chart and also act as possible trend filters (adjustable in settings). Basic MA acts as guide to eye and a possible trade trigger (adjustable in settings).
There are a few trend filters the strategy can use - moving average, signed standard deviation, ultimate RSI or none. The filters act as an additional condition on triggers, making the strategy take trades only if both triggers and trend filter allows. That way one can filter out trades with unfavorable risk/reward (for instance, don't long if price is under the MA200). Different trade filters can be used for long and short trades.
The strategy employs various stop loss types, the default of which is a trailing %-based stop loss type. ATR-based stop loss is also available. The default 1.5% trailing stop loss is suitable for leveraged trading.
Lastly, the strategy can trigger take profit orders if certain conditions are met, adjustable in settings. Also, it can hold onto winning trades and exit only after stop out (in which case, consecutive triggers to take other positions will be ignored until stop out).
Let me know if you like it and if you use it, what kind of tweaks would you like to see.
With kind regards,
easy-peasy-x

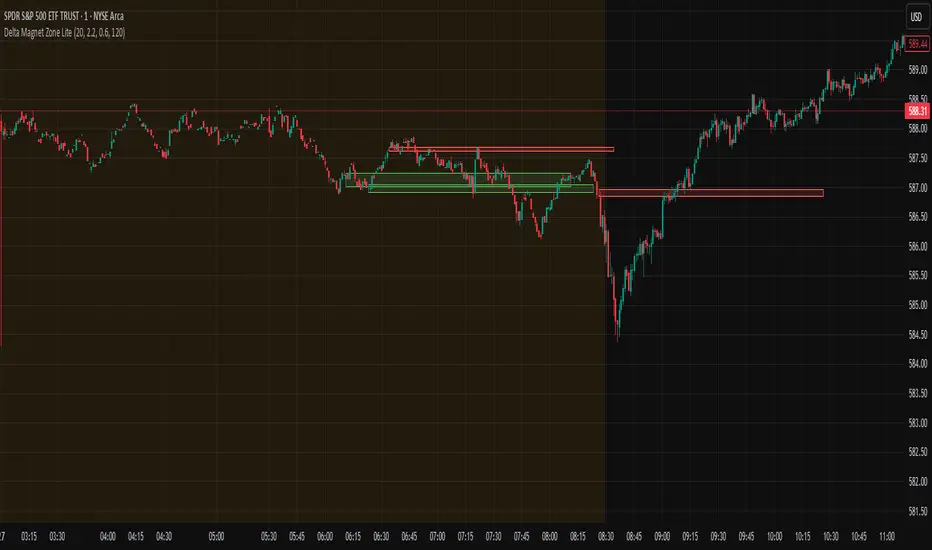
Delta Magnet Zone LiteDelta Magnet Zone Lite is exactly what it sounds like. It is areas where price cold potentially act as a magnet zone for price. Delta Magnet Zone Lite is a lightweight yet powerful visual tool that highlights potential liquidity traps and high-probability reversal zones based on volume spikes and wick imbalances. Designed for precision traders, this indicator visually marks key “magnet” zones where price may react, reverse, or consolidate due to prior aggressive buying or selling activity.
🔹 Core Logic:
Volume Spike Detection
Identifies candles with significantly higher volume than the moving average (customizable). These are likely areas of institutional interest or stop-hunt events.
Wick Ratio Analysis
Measures the size of the upper or lower wick relative to the total candle range. When combined with volume spikes, this helps detect:
Bullish Traps: Large lower wicks with strong buying volume
Bearish Traps: Large upper wicks with strong selling volume
Smart Zone Marking
When trap conditions are met, the script draws a semi-transparent colored box (green for bullish, red for bearish) that extends forward in time, highlighting a magnet zone—a price area likely to be retested or respected by future price action.
🛠 Customization Options:
Volume Spike Threshold
Adjust the multiplier for defining what qualifies as "high volume" relative to the average.
Wick Ratio Sensitivity
Fine-tune how extreme the wick size must be to qualify as a trap.
Zone Lifetime (Lookback)
Control how many bars each zone remains active on the chart.
Toggle Visibility
Turn bullish or bearish zones on/off independently for clean charting.
Ideal Use Cases:
Spotting hidden liquidity zones
Identifying exhaustion points in fast markets
Tracking institutional order imbalances
Enhancing confirmation for entry/exit signals
Whether you're trading intraday breakouts or swing-level reversals, Delta Magnet Zone Lite brings clarity to key reaction levels derived from raw price and volume behavior.