Buy on 5% dip strategy with time adjustment
This script is a strategy called "Buy on 5% Dip Strategy with Time Adjustment 📉💡," which detects a 5% drop in price and triggers a buy signal 🔔. It also automatically closes the position once the set profit target is reached 💰, and it has additional logic to close the position if the loss exceeds 14% after holding for 230 days ⏳.
Strategy Explanation
Buy Condition: A buy signal is triggered when the price drops 5% from the highest price reached 🔻.
Take Profit: The position is closed when the price hits a 1.22x target from the average entry price 📈.
Forced Sell Condition: If the position is held for more than 230 days and the loss exceeds 14%, the position is automatically closed 🚫.
Leverage & Capital Allocation: Leverage is adjustable ⚖️, and you can set the percentage of capital allocated to each trade 💸.
Time Limits: The strategy allows you to set a start and end time ⏰ for trading, making the strategy active only within that specific period.
Code Credits and References
Credits: This script utilizes ideas and code from @QuantNomad and jangdokang for the profit table and algorithm concepts 🔧.
Sources:
Monthly Performance Table Script by QuantNomad:
ZenAndTheArtOfTrading's Script:
Strategy Performance
This strategy provides risk management through take profit and forced sell conditions and includes a performance table 📊 to track monthly and yearly results. You can compare backtest results with real-time performance to evaluate the strategy's effectiveness.
The performance numbers shown in the backtest reflect what would have happened if you had used this strategy since the launch date of the SOXL (the Direxion Daily Semiconductor Bull 3x Shares ETF) 📅. These results are not hypothetical but based on actual performance from the day of the ETF’s launch 📈.
Caution ⚠️
No Guarantee of Future Results: The results are based on historical performance from the launch of the SOXL ETF, but past performance does not guarantee future results. It’s important to approach with caution when applying it to live trading 🔍.
Risk Management: Leverage and capital allocation settings are crucial for managing risk ⚠️. Make sure to adjust these according to your risk tolerance ⚖️.
Cari dalam skrip untuk "国泰黄金ETF联接C相关行业指数的最新政策"

BetaBeta , also known as the Beta coefficient, is a measure that compares the volatility of an individual underlying or portfolio to the volatility of the entire market, typically represented by a market index like the S&P 500 or an investible product such as the SPY ETF (SPDR S&P 500 ETF Trust). A Beta value provides insight into how an asset's returns are expected to respond to market swings.
Interpretation of Beta Values
Beta = 1: The asset's volatility is in line with the market. If the market rises or falls, the asset is expected to move correspondingly.
Beta > 1: The asset is more volatile than the market. If the market rises or falls, the asset's price is expected to rise or fall more significantly.
Beta < 1 but > 0: The asset is less volatile than the market. It still moves in the same direction as the market but with less magnitude.
Beta = 0: The asset's returns are not correlated with the market's returns.
Beta < 0: The asset moves in the opposite direction to the market.
Example
A beta of 1.20 relative to the S&P 500 Index or SPY implies that if the S&P's return increases by 1%, the portfolio is expected to increase by 12.0%.
A beta of -0.10 relative to the S&P 500 Index or SPY implies that if the S&P's return increases by 1%, the portfolio is expected to decrease by 0.1%. In practical terms, this implies that the portfolio is expected to be predominantly 'market neutral' .
Calculation & Default Values
The Beta of an asset is calculated by dividing the covariance of the asset's returns with the market's returns by the variance of the market's returns over a certain period (standard period: 1 years, 250 trading days). Hint: It's noteworthy to mention that Beta can also be derived through linear regression analysis, although this technique is not employed in this Beta Indicator.
Formula: Beta = Covariance(Asset Returns, Market Returns) / Variance(Market Returns)
Reference Market: Essentially any reference market index or product can be used. The default reference is the SPY (SPDR S&P 500 ETF Trust), primarily due to its investable nature and broad representation of the market. However, it's crucial to note that Beta can also be calculated by comparing specific underlyings, such as two different stocks or commodities, instead of comparing an asset to the broader market. This flexibility allows for a more tailored analysis of volatility and correlation, depending on the user's specific trading or investment focus.
Look-back Period: The standard look-back period is typically 1-5 years (250-1250 trading days), but this can be adjusted based on the user's preference and the specifics of the trading strategy. For robust estimations, use at least 250 trading days.
Option Delta: An optional feature in the Beta Indicator is the ability to select a specific Delta value if options are written on the underlying asset with Deltas less than 1, providing an estimation of the beta-weighted delta of the position. It involves multiplying the beta of the underlying asset by the delta of the option. This addition allows for a more precise assessment of the underlying asset's correspondence with the overall market in case you are an options trader. The default Delta value is set to 1, representing scenarios where no options on the underlying asset are being analyzed. This default setting aligns with analyzing the direct relationship between the asset itself and the market, without the layer of complexity introduced by options.
Calculation: Simple or Log Returns: In the calculation of Beta, users have the option to choose between using simple returns or log returns for both the asset and the market. The default setting is 'Simple Returns'.
Advantages of Using Beta
Risk Management: Beta provides a clear metric for understanding and managing the risk of a portfolio in relation to market movements.
Portfolio Diversification: By knowing the beta of various assets, investors can create a balanced portfolio that aligns with their risk tolerance and investment goals.
Performance Benchmarking: Beta allows investors to compare an asset's risk-adjusted performance against the market or other benchmarks.
Beta-Weighted Deltas for Options Traders
For options traders, understanding the beta-weighted delta is crucial. It involves multiplying the beta of the underlying asset by the delta of the option. This provides a more nuanced view of the option's risk relative to the overall market. However, it's important to note that the delta of an option is dynamic, changing with the asset's price, time to expiration, and other factors.

vol_premiaThis script shows the volatility risk premium for several instruments. The premium is simply "IV30 - RV20". Although Tradingview doesn't provide options prices, CBOE publishes 30-day implied volatilities for many instruments (most of which are VIX variations). CBOE calculates these in a standard way, weighting at- and out-of-the-money IVs for options that expire in 30 days, on average. For realized volatility, I used the standard deviation of log returns. Since there are twenty trading periods in 30 calendar days, IV30 can be compared to RV20. The "premium" is the difference, which reflects market participants' expectation for how much upcoming volatility will over- or under-shoot recent volatility.
The script loads pretty slow since there are lots of symbols, so feel free to delete the ones you don't care about. Hopefully the code is straightforward enough. I won't list the meaning of every symbols here, since I might change them later, but you can type them into tradingview for data, and read about their volatility index on CBOE's website. Some of the more well-known ones are:
ES: S&P futures, which I prefer to the SPX index). Its implied volatility is VIX.
USO: the oil ETF representing WTI future prices. Its IV is OVX.
GDX: the gold miner's ETF, which is usually more volatile than gold. Its IV is VXGDX.
FXI: a china ETF, whose volatility is VXFXI.
And so on. In addition to the premium, the "percentile" column shows where this premium ranks among the previous 252 trading days. 100 = the highest premium, 0 = the lowest premium.

Coppock Curve StrategyThis strategy makes use of a not widely known technical indicator called "Coppock Curve".
The indicator is derived by taking a weighted moving average of the rate-of-change (ROC) of a market index such as the S&P 500 or a trading equivalent such as the S&P 500 SPDR ETF. For more info: (www.investopedia.com)
This strategy uses $SPY Coppock curve as a proxy to generate buy signals on other ETF's and stocks.
Buy signals are generated when the Coppock Curve crosses above zero, and sell signals are generated when it crosses below.
An optional, trailing stop loss is available, with default settings to 100% so that it does not currently affect the buy and sell signals solely generated by the Coppock Curve. But you may find adding a Trailing stop loss may improve results on certain ETF's/Stocks.
You may also change the symbol for which signals are generated for, default is $SPY.
The published example shows using this strategy on a leverage ETF $TQQQ w/ starting capital of 10k, w/ 10k per trade. Try it on other stocks such as $AAPL, $AMZN $NFLX ect... I have found it to be an effective strategy that has a favorable risk to reward profile.
Any questions, please let me know!

Short in Bollinger Band Down trend (Weekly and Daily) // © PlanTradePlanMM
// 6/14/2020
// ---------------------------------------------------
// Name: Short in Bollinger Band Down trend (Weekly and Daily)
// ---------------------------------------------------
// Key Points in this study:
// 1. Short in BB Lower band, probability of price going down is more than 50%
// 2. Short at the top 1/4 of Lower band (EMA - Lower line), Stop is EMA, tartget is Lower line; it matches risk:/reward=1:3 naturally
//
// Draw Lines:
// BB Lower : is the Target (Black line)
// BB EMA : is the initial Stop (Black line)
// ShortLine : EMA - 1/4 of (Stop-target), which matches risk:/reward=1:3
// Prepare Zone : between EMA and ShortLine
// shortPrice : Blue dot line only showing when has Short position, Which shows entry price.
// StopPrice : Black dot line only showing when has Short position, Which shows updated stop price.
//
// Add SMA50 to filter the trend. Price <= SMA, allow to short
//
// What (Condition): in BB down trend band
// When (Price action): Price cross below ShortLine;
// How (Trading Plan): Short at ShortLine;
// Initial Stop is EMA;
// Initial Target is BB Lower Line;
// FollowUp: if price moves down first, and EMA is below Short Price. Move stop to EMA, At least "make even" in this trade;
// if Price touched Short Line again and goes down, new EMA will be the updated stop
//
// Exit: 1. Initial stop -- "Stop" when down first, Close above stop
// 2. Target reached -- "TR" when down quickly, Target reached
// 3. make even -- "ME" when small down and up, Exit at Entry Price
// 4. Small Winner -- "SM" when EMA below Entry price, Exit when Close above EMA
//
// --------------
// Because there are too many flags in up trend study already, I created this down trend script separately.
// Uptrend study is good for SPY, QQQ, and strong stocks.
// Downtrend Study is good for weak ETF, stock, and (-2x, -3x) ETFs, such as FAZ, UVXY, USO, XOP, AAL, CCL
// -----------------------------------------------------------------------------------------------------------------
// Back test Weekly and daily chart for SPY, QQQ, XOP, AAL, BA, MMM, FAZ, UVXY
// The best sample is FAZ Weekly chart.
// When SPY and QQQ are good in long term up trend, these (-2x, -3x) ETFs are always going down in long term.
// Some of them are not allowed to short. I used option Put/Put spread for the short entry.
//

Macro Momentum – 4-Theme, Vol Target, RebalanceMacro Momentum — 4-Theme, Vol Target, Rebalance
Purpose. A macro-aware strategy that blends four economic “themes”—Business Cycle, Trade/USD, Monetary Policy, and Risk Sentiment—into a single, smoothed Composite signal. It then:
gates entries/exits with hysteresis bands,
enforces optional regime filters (200-day bias), and
sizes the position via volatility targeting with caps for long/short exposure.
It’s designed to run on any chart (index, ETF, futures, single stocks) while reading external macro proxies on a chosen Signal Timeframe.
How it works (high level)
Build four theme signals from robust macro proxies:
Business Cycle: XLI/XLU and Copper/Gold momentum, confirmed by the chart’s price vs a long SMA (default 200D).
Trade / USD: DXY momentum (sign-flipped so a rising USD is bearish for risk assets).
Monetary Policy: 10Y–2Y curve slope momentum and 10Y yield trend (steepening & falling 10Y = risk-on; rising 10Y = risk-off).
Risk Sentiment: VIX momentum (bearish if higher) and HYG/IEF momentum (bullish if credit outperforms duration).
Normalize & de-noise.
Optional Winsorization (MAD or stdev) clamps outliers over a lookback window.
Optional Z-score → tanh mapping compresses to ~ for stable weighting.
Theme lines are SMA-smoothed; the final Composite is LSMA-smoothed (linreg).
Decide direction with hysteresis.
Enter/hold long when Composite ≥ Entry Band; enter/hold short when Composite ≤ −Entry Band.
Exit bands are tighter than entry bands to avoid whipsaws.
Apply regime & direction constraints.
Optional Long-only above 200MA (chart symbol) and/or Short-only below 200MA.
Global Direction control (Long / Short / Both) and Invert switch.
Size via volatility targeting.
Realized close-to-close vol is annualized (choose 9-5 or 24/7 market profile).
Target exposure = TargetVol / RealizedVol, capped by Max Long/Max Short multipliers.
Quantity is computed from equity; futures are rounded to whole contracts.
Rebalance cadence & execution.
Trades are placed on Weekly / Monthly / Quarterly rebalance bars or when the sign of exposure flips.
Optional ATR stop/TP for single-stock style risk management.
Inputs you’ll actually tweak
General
Signal Timeframe: Where macro is sampled (e.g., D/W).
Rebalance Frequency: Weekly / Monthly / Quarterly.
ROC & SMA lengths: Defaults for theme momentum and the 200D regime filter.
Normalization: Z-score (tanh) on/off.
Winsorization
Toggle, lookback, multiplier, MAD vs Stdev.
Risk / Sizing
Target Annualized Vol & Realized Vol Lookback.
Direction (Long/Short/Both) and Invert.
Max long/short exposure caps.
Advanced Thresholds
Theme/Composite smoothing lengths.
Entry/Exit bands (hysteresis).
Regime / Execution
Long-only above 200MA, Short-only below 200MA.
Stops/TP (optional)
ATR length and SL/TP multiples.
Theme Weights
Per-theme scalars so you can push/pull emphasis (e.g., overweight Policy during rate cycles).
Macro Proxies
Symbols for each theme (XLI, XLU, HG1!, GC1!, DXY, US10Y, US02Y, VIX, HYG, IEF). Swap to alternatives as needed (e.g., UUP for DXY).
Signals & logic (under the hood)
Business Cycle = ½ ROC(XLI/XLU) + ½ ROC(Copper/Gold), then confirmed by (price > 200SMA ? +1 : −1).
Trade / USD = −ROC(DXY).
Monetary Policy = 0.6·ROC(10Y–2Y) − 0.4·ROC(10Y).
Risk Sentiment = −0.6·ROC(VIX) + 0.4·ROC(HYG/IEF).
Each theme → (optional Winsor) → (robust z or scaled ROC) → tanh → SMA smoothing.
Composite = weighted average → LSMA smoothing → compare to bands → dir ∈ {−1,0,+1}.
Rebalance & flips. Orders fire on your chosen cadence or when the sign of exposure changes.
Position size. exposure = clamp(TargetVol / realizedVol, maxLong/Short) × dir.
Note: The script also exposes Gross Exposure (% equity) and Signed Exposure (× equity) as diagnostics. These can help you audit how vol-targeting and caps translate into sizing over time.
Visuals & alerts
Composite line + columns (color/intensity reflect direction & strength).
Entry/Exit bands with green/red fills for quick polarity reads.
Hidden plots for each Theme if you want to show them.
Optional rebalance labels (direction, gross & signed exposure, σ).
Background heatmap keyed to Composite.
Alerts
Enter/Inc LONG when Composite crosses up (and on rebalance bars).
Enter/Inc SHORT when Composite crosses down (and on rebalance bars).
Exit to FLAT when Composite returns toward neutral (and on rebalance bars).
Practical tips
Start higher timeframes. Daily signals with Monthly rebalance are a good baseline; weekly signals with quarterly rebalances are even cleaner.
Tune Entry/Exit bands before anything else. Wider bands = fewer trades and less noise.
Weights reflect regime. If policy dominates markets, raise Monetary Policy weight; if credit stress drives moves, raise Risk Sentiment.
Proxies are swappable. Use UUP for USD, or futures-continuous symbols that match your data plan.
Futures vs ETFs. Quantity auto-rounds for futures; ETFs accept fractional shares. Check contract multipliers when interpreting exposure.
Caveats
Macro proxies can repaint at the selected signal timeframe as higher-TF bars form; that’s intentional for macro sampling, but test live.
Vol targeting assumes reasonably stationary realized vol over the lookback; if markets regime-shift, revisit volLook and targetVol.
If you disable normalization/winsorization, themes can become spikier; expect more hysteresis band crossings.
What to change first (quick start)
Set Signal Timeframe = D, Rebalance = Monthly, Z-score on, Winsor on (MAD).
Entry/Exit bands: 0.25 / 0.12 (defaults), then nudge until trade count and turnover feel right.
TargetVol: try 10% for diversified indices; lower for single stocks, higher for vol-sell strategies.
Leave weights = 1.0 until you’ve inspected the four theme lines; then tilt deliberately.

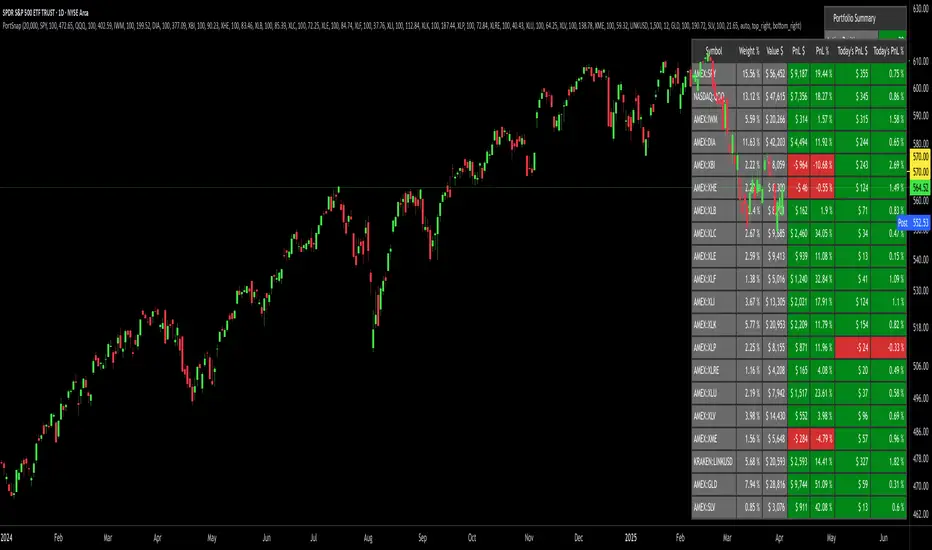
Normalized Portfolio TrackerThis script lets you create, visualize, and track a custom portfolio of up to 15 assets directly on TradingView.
It calculates a synthetic "portfolio index" by combining multiple tickers with user-defined weights, automatically normalizing them so the total allocation always equals 100%.
All assets are scaled to a common starting point, allowing you to compare your portfolio’s performance versus any benchmark like SPY, QQQ, or BTC.
🚀 Goal
This script helps traders and investors:
• Understand the combined performance of their portfolio.
• Normalize diverse assets into a single synthetic chart .
• Make portfolio-level insights without relying on external spreadsheets.
🎯 Use Cases
• Backtest your portfolio allocations directly on the chart.
• Compare your portfolio vs. benchmarks like SPY, QQQ, BTC.
• Track thematic baskets (commodities, EV supply chain, regional ETFs).
• Visualize how each component contributes to overall performance.
📊 Features
• Weighted Portfolio Performance : Combines selected assets into a synthetic value series.
• Base Price Alignment : Each asset is normalized to its starting price at the chosen date.
• Dynamic Portfolio Table : Displays symbols, normalized weights (%), equivalent shares (based on each asset’s start price, sums to 100 shares), and a total row that always sums to 100%.
• Multi-Asset Support : Works with stocks, ETFs, indices, crypto, or any TradingView-compatible symbol.
⚙️ Configuration
Flexible Portfolio Setup
• Add up to 15 assets with custom weight inputs.
• You can enter any arbitrary numbers (e.g. 30, 15, 55).
• The script automatically normalizes all weights so the total allocation always equals 100%.
Start Date Selection
• Choose any custom start date to normalize all assets.
• The portfolio value is then scaled relative to the main chart symbol, so you can directly compare portfolio performance against benchmarks like SPY or QQQ.
Chart Styles
• Candlestick chart
• Heikin Ashi chart
• Line chart
Custom Display
• Adjustable colors and line widths
• Optionally display asset list, normalized weights, and equivalent shares
⚙️ How It Works
• Fetch OHLC data for each asset.
• Normalizes weights internally so totals = 100%.
• Stores each asset’s base price at the selected start date.
• Calculates equivalent “shares” for each allocation.
• Builds a synthetic portfolio value series by summing weighted contributions.
• Renders as Candlestick, Heikin Ashi, or Line chart.
• Adds a portfolio info table for clarity.
⚠️ Notes
• This script is for visualization only . It does not place trades or auto-rebalance.
• Weight inputs are automatically normalized, so you don’t need to enter exact percentages.

Opening Range IndicatorComplete Trading Guide: Opening Range Breakout Strategy
What Are Opening Ranges?
Opening ranges capture the high and low prices during the first few minutes of market open. These levels often act as key support and resistance throughout the trading day because:
Heavy volume occurs at market open as overnight orders execute
Institutional activity is concentrated during opening minutes
Price discovery happens as market participants react to overnight news
Psychological levels are established that traders watch all day
Understanding the Three Timeframes
OR5 (5-Minute Range: 9:30-9:35 AM)
Most sensitive - captures immediate market reaction
Quick signals but higher false breakout rate
Best for scalping and momentum trading
Use for early entry when conviction is high
OR15 (15-Minute Range: 9:30-9:45 AM)
Balanced approach - most popular among day traders
Moderate sensitivity with better reliability
Good for swing trades lasting several hours
Primary timeframe for most strategies
OR30 (30-Minute Range: 9:30-10:00 AM)
Most reliable but slower signals
Lower false breakout rate
Best for position trades and trend following
Use when looking for major moves
Core Trading Strategies
Strategy 1: Basic Breakout
Setup:
Wait for price to break above OR15 high or below OR15 low
Enter on the breakout candle close
Stop loss: Opposite side of the range
Target: 2-3x the range size
Example:
OR15 range: $100.00 - $102.00 (Range = $2.00)
Long entry: Break above $102.00
Stop loss: $99.50 (below OR15 low)
Target: $104.00+ (2x range size)
Strategy 2: Multiple Confirmation
Setup:
Wait for OR5 break first (early signal)
Confirm with OR15 break in same direction
Enter on OR15 confirmation
Stop: Below OR30 if available, or OR15 opposite level
Why it works:
Multiple timeframe confirmation reduces false signals and increases probability of sustained moves.
Strategy 3: Failed Breakout Reversal
Setup:
Price breaks OR15 level but fails to hold
Wait for re-entry into the range
Enter reversal trade toward opposite OR level
Stop: Recent breakout high/low
Target: Opposite side of range + extension
Key insight: Failed breakouts often lead to strong moves in the opposite direction.
Advanced Techniques
Range Quality Assessment
High-Quality Ranges (Trade these):
Range size: 0.5% - 2% of stock price
Clean boundaries (not choppy)
Volume spike during range formation
Clear rejection at range levels
Low-Quality Ranges (Avoid these):
Very narrow ranges (<0.3% of stock price)
Extremely wide ranges (>3% of stock price)
Choppy, overlapping candles
Low volume during formation
Volume Confirmation
For Breakouts:
Look for volume spike (2x+ average) on breakout
Declining volume often signals false breakout
Rising volume during range formation shows interest
Market Context Filters
Best Conditions:
Trending market days (SPY/QQQ with clear direction)
Earnings reactions or news-driven moves
High-volume stocks with good liquidity
Volatility above average (VIX considerations)
Avoid Trading When:
Extremely low volume days
Major economic announcements pending
Holidays or half-days
Choppy, sideways market conditions
Risk Management Rules
Position Sizing
Conservative: Risk 0.5% of account per trade
Moderate: Risk 1% of account per trade
Aggressive: Risk 2% maximum per trade
Stop Loss Placement
Inside the range: Quick exit but higher stop-out rate
Outside opposite level: More room but larger risk
ATR-based: 1.5-2x Average True Range below entry
Profit Taking
Target 1: 1x range size (take 50% off)
Target 2: 2x range size (take 25% off)
Runner: Trail remaining 25% with moving stops
Specific Entry Techniques
Breakout Entry Methods
Method 1: Immediate Entry
Enter as soon as price closes above/below range
Fastest entry but highest false signal rate
Best for strong momentum situations
Method 2: Pullback Entry
Wait for breakout, then pullback to range level
Enter when price bounces off former resistance/support
Better risk/reward but may miss some moves
Method 3: Volume Confirmation
Wait for breakout + volume spike
Enter after volume confirmation candle
Reduces false signals significantly
Multiple Timeframe Entries
Aggressive: OR5 break → immediate entry
Conservative: OR5 + OR15 + OR30 all align → enter
Balanced: OR15 break with OR30 support → enter
Common Mistakes to Avoid
1. Trading Poor-Quality Ranges
❌ Don't trade ranges that are too narrow or too wide
✅ Focus on clean, well-defined ranges with good volume
2. Ignoring Volume
❌ Don't chase breakouts without volume confirmation
✅ Always check for volume spike on breakouts
3. Over-Trading
❌ Don't force trades when ranges are unclear
✅ Wait for high-probability setups only
4. Poor Risk Management
❌ Don't risk more than planned or use tight stops in volatile conditions
✅ Stick to predetermined risk levels
5. Fighting the Trend
❌ Don't fade breakouts in strongly trending markets
✅ Align trades with overall market direction
Daily Trading Routine
Pre-Market (8:00-9:30 AM)
Check overnight news and earnings
Review major indices (SPY, QQQ, IWM)
Identify potential opening range candidates
Set alerts for range breakouts
Market Open (9:30-10:00 AM)
Watch opening range formation
Note volume and price action quality
Mark key levels on charts
Prepare for breakout signals
Trading Session (10:00 AM - 4:00 PM)
Execute breakout strategies
Manage existing positions
Trail stops as profits develop
Look for additional setups
Post-Market Review
Analyze winning and losing trades
Review range quality vs. outcomes
Identify improvement areas
Prepare for next session
Best Stocks/ETFs for Opening Range Trading
Large Cap Stocks (Best for beginners):
AAPL, MSFT, GOOGL, AMZN, TSLA
High liquidity, predictable behavior
Good range formation most days
ETFs (Consistent patterns):
SPY, QQQ, IWM, XLF, XLE
Excellent liquidity
Clear range boundaries
Mid-Cap Growth (Advanced traders):
Stocks with good volume (1M+ shares daily)
Recent news catalysts
Clean technical patterns
Performance Optimization
Track These Metrics:
Win rate by range type (OR5 vs OR15 vs OR30)
Average R/R (risk vs reward ratio)
Best performing market conditions
Time of day performance
Continuous Improvement:
Keep detailed trade journal
Review failed breakouts for patterns
Adjust position sizing based on win rate
Refine entry timing based on backtesting
Final Tips for Success
Start small - Paper trade or use tiny positions initially
Focus on quality - Better to miss trades than take bad ones
Stay disciplined - Stick to your rules even during losing streaks
Adapt to conditions - What works in trending markets may fail in choppy conditions
Keep learning - Markets evolve, so should your approach
The opening range strategy is powerful because it captures natural market behavior, but like all strategies, it requires practice, discipline, and proper risk management to be profitable long-term.

FNGAdataCloseClose prices for FNGA ETF (Dec 2018–May 2025)
The Close prices for FNGA ETF (December 2018 – May 2025) represent the final trading price recorded at the end of each regular U.S. market session (4:00 p.m. Eastern Time) over the entire lifespan of this leveraged exchange-traded note. Initially issued under the ticker FNGU and later rebranded as FNGA in March 2025 before its redemption in May 2025, the product was designed to provide 3x daily leveraged exposure to the MicroSectors FANG+™ Index, which tracks a concentrated group of large-cap technology and tech-enabled growth leaders such as Apple, Amazon, Meta (Facebook), Netflix, and Alphabet (Google).
Close prices are widely regarded as the most important reference point in market data because they establish the official end-of-day valuation of a security. For leveraged products like FNGA, the closing price is especially critical, since it directly determines the reset value for the following trading session. This daily compounding effect means that FNGA’s closing levels often diverged significantly from the long-term performance of its underlying index, creating both opportunities and risks for traders.

FNGAdataLow“Low prices for FNGA ETF (Dec 2018–May 2025)
The Low prices for FNGA ETF (December 2018 – May 2025) capture the lowest trading price reached during each regular U.S. market session over the entire lifespan of this leveraged exchange-traded note. Initially launched under the ticker FNGU, and later rebranded as FNGA in March 2025 before its eventual redemption, the fund was structured to deliver 3x daily leveraged exposure to the MicroSectors FANG+™ Index. This index concentrated on a small basket of leading technology and tech-enabled growth companies such as Meta (Facebook), Amazon, Apple, Netflix, and Alphabet (Google), along with a few other innovators.
The Low price is particularly important in the study of FNGA because it highlights the intraday downside extremes of a highly volatile, leveraged product. Since FNGA was designed to reset leverage daily, its lows often reflected moments of amplified market stress, when declines in the underlying FANG+™ stocks were multiplied through the 3x leverage structure.

Market BreadthMarket breadth is a technical analysis technique that gauges the strength or weakness of moves in a major index.
Supported index ETF: SPY, NDX, DIA, IWM, OEF, MDY, IWB, IWV.
Supported sector index ETF: XLK, XLC, XLY, XLP, XLV, XLU, XLF, XLRE, XLE, XLB, XLI.

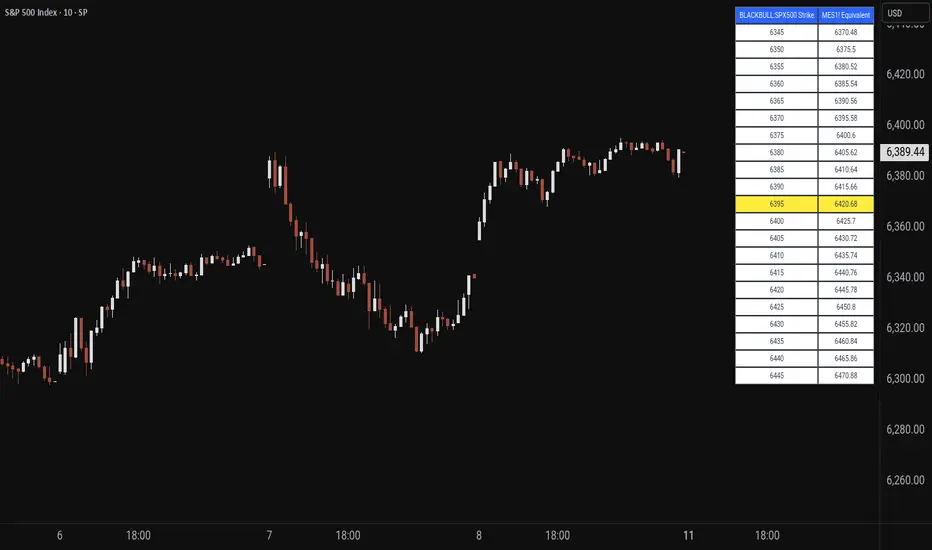
Price MapperPrice Mapper is a dynamic trading tool designed to map strike prices between two related financial instruments using real-time ratio calculations. The indicator displays a customizable table showing strike levels for your primary ticker alongside their equivalent mapped prices for a secondary instrument, making it invaluable for cross-market analysis, pairs trading, and hedging strategies. Whether you're comparing an ETF to its underlying futures, analyzing currency pairs, or exploring relationships between correlated assets, Price Mapper provides instant visual mapping of how price movements in one instrument translate to equivalent levels in another. The ratio calculation updates daily using 12:00 PM New York time closing prices, ensuring consistent reference points while maintaining relevance to current market conditions.
The tool automatically centers around the current market price and allows complete customization of display parameters including strike increments, number of price levels, decimal precision, and table positioning. Advanced color customization options let you highlight the current price level and adjust the appearance to match your trading setup. Price Mapper eliminates the mental math typically required when trading related instruments, instantly showing you equivalent entry and exit levels across different markets. This makes it particularly powerful for options traders working with ETFs and futures, forex traders analyzing currency correlations, or any trader looking to understand precise price relationships between connected financial instruments.
5DMA Optional HMA Entry📈 5DMA Optional HMA Entry Signal – Precision-Based Momentum Trigger
Category: Trend-Following / Reversal Timing / Entry Optimization
🔍 Overview:
The 5DMA Optional HMA Entry indicator is a refined price-action entry tool built for traders who rely on clean trend alignment and precise timing. This script identifies breakout-style entry points when price gains upward momentum relative to short-term moving averages — specifically the 5-day Simple Moving Average (5DMA) and an optional Hull Moving Average (HMA).
Whether you're swing trading stocks, scalping ETFs like UVXY or VXX, or looking for pullback recovery entries, this tool helps time your long entries with clarity and flexibility.
⚙️ Core Logic:
Primary Condition (Always On):
🔹 Close must be above the 5DMA – ensuring upward short-term momentum is confirmed.
Optional Condition (Toggled by User):
🔹 Close above the HMA – adds slope-responsive trend filtering for smoother setups. Enable or disable via checkbox.
Bonus Entry Filter (Optional):
🔹 Green Candle Wick Breakout – optional pattern logic that detects bullish momentum when the high pierces above both MAs, with a green body.
Reset Mechanism:
🔁 Signal resets only after price closes back below all active MAs (5DMA and HMA if enabled), reducing noise and avoiding repeated signals during chop.
🧠 Why This Works:
This indicator captures the kind of setups that professional traders look for:
Momentum crossovers without chasing late.
Mean reversion snapbacks that align with fresh bullish moves.
Avoids premature entries by requiring clear structure above moving averages.
Optional HMA filter allows adaptability: turn it off during choppy markets or range conditions, and on during trending environments.
🔔 Features:
✅ Adjustable HMA Length
✅ Enable/Disable HMA Filter
✅ Optional Green Wick Breakout Detection
✅ Visual “Buy” label plotted below qualifying bars
✅ Real-time Alert Conditions for automated trading or manual alerts
🎯 Use Cases:
VIX-based ETFs (e.g., UVXY, VXX): Catch early breakouts aligned with volatility spikes.
Growth Stocks: Time pullback entries during bullish runs.
Futures/Indices: Combine with macro levels for intraday scalps or swing setups.
Overlay on Trend Filters: Combine with RSI, MACD, or VWAP for confirmation.
🛠️ Recommended Settings:
For smooth setups in volatile names, use:
HMA Length: 20
Keep green wick filter ON
For fast momentum trades, disable the HMA filter to act on 5DMA alone.
⭐ Final Thoughts:
This script is built to serve both systematic traders and discretionary scalpers who want actionable signals without noise or lag. The toggleable HMA feature lets you adjust sensitivity depending on market conditions — a key edge in adapting to volatility cycles.
Perfect for those who value clean, non-repainting entries rooted in logical structure.

DCA Investment Tracker Pro [tradeviZion]DCA Investment Tracker Pro: Educational DCA Analysis Tool
An educational indicator that helps analyze Dollar-Cost Averaging strategies by comparing actual performance with historical data calculations.
---
💡 Why I Created This Indicator
As someone who practices Dollar-Cost Averaging, I was frustrated with constantly switching between spreadsheets, calculators, and charts just to understand how my investments were really performing. I wanted to see everything in one place - my actual performance, what I should expect based on historical data, and most importantly, visualize where my strategy could take me over the long term .
What really motivated me was watching friends and family underestimate the incredible power of consistent investing. When Napoleon Bonaparte first learned about compound interest, he reportedly exclaimed "I wonder it has not swallowed the world" - and he was right! Yet most people can't visualize how their $500 monthly contributions today could become substantial wealth decades later.
Traditional DCA tracking tools exist, but they share similar limitations:
Require manual data entry and complex spreadsheets
Use fixed assumptions that don't reflect real market behavior
Can't show future projections overlaid on actual price charts
Lose the visual context of what's happening in the market
Make compound growth feel abstract rather than tangible
I wanted to create something different - a tool that automatically analyzes real market history, detects volatility periods, and shows you both current performance AND educational projections based on historical patterns right on your TradingView charts. As Warren Buffett said: "Someone's sitting in the shade today because someone planted a tree a long time ago." This tool helps you visualize your financial tree growing over time.
This isn't just another calculator - it's a visualization tool that makes the magic of compound growth impossible to ignore.
---
🎯 What This Indicator Does
This educational indicator provides DCA analysis tools. Users can input investment scenarios to study:
Theoretical Performance: Educational calculations based on historical return data
Comparative Analysis: Study differences between actual and theoretical scenarios
Historical Projections: Theoretical projections for educational analysis (not predictions)
Performance Metrics: CAGR, ROI, and other analytical metrics for study
Historical Analysis: Calculates historical return data for reference purposes
---
🚀 Key Features
Volatility-Adjusted Historical Return Calculation
Analyzes 3-20 years of actual price data for any symbol
Automatically detects high-volatility stocks (meme stocks, growth stocks)
Uses median returns for volatile stocks, standard CAGR for stable stocks
Provides conservative estimates when extreme outlier years are detected
Smart fallback to manual percentages when data insufficient
Customizable Performance Dashboard
Educational DCA performance analysis with compound growth calculations
Customizable table sizing (Tiny to Huge text options)
9 positioning options (Top/Middle/Bottom + Left/Center/Right)
Theme-adaptive colors (automatically adjusts to dark/light mode)
Multiple display layout options
Future Projection System
Visual future growth projections
Timeframe-aware calculations (Daily/Weekly/Monthly charts)
1-30 year projection options
Shows projected portfolio value and total investment amounts
Investment Insights
Performance vs benchmark comparison
ROI from initial investment tracking
Monthly average return analysis
Investment milestone alerts (25%, 50%, 100% gains)
Contribution tracking and next milestone indicators
---
📊 Step-by-Step Setup Guide
1. Investment Settings 💰
Initial Investment: Enter your starting lump sum (e.g., $60,000)
Monthly Contribution: Set your regular DCA amount (e.g., $500/month)
Return Calculation: Choose "Auto (Stock History)" for real data or "Manual" for fixed %
Historical Period: Select 3-20 years for auto calculations (default: 10 years)
Start Year: When you began investing (e.g., 2020)
Current Portfolio Value: Your actual portfolio worth today (e.g., $150,000)
2. Display Settings 📊
Table Sizes: Choose from Tiny, Small, Normal, Large, or Huge
Table Positions: 9 options - Top/Middle/Bottom + Left/Center/Right
Visibility Toggles: Show/hide Main Table and Stats Table independently
3. Future Projection 🔮
Enable Projections: Toggle on to see future growth visualization
Projection Years: Set 1-30 years ahead for analysis
Live Example - NASDAQ:META Analysis:
Settings shown: $60K initial + $500/month + Auto calculation + 10-year history + 2020 start + $150K current value
---
🔬 Pine Script Code Examples
Core DCA Calculations:
// Calculate total invested over time
months_elapsed = (year - start_year) * 12 + month - 1
total_invested = initial_investment + (monthly_contribution * months_elapsed)
// Compound growth formula for initial investment
theoretical_initial_growth = initial_investment * math.pow(1 + annual_return, years_elapsed)
// Future Value of Annuity for monthly contributions
monthly_rate = annual_return / 12
fv_contributions = monthly_contribution * ((math.pow(1 + monthly_rate, months_elapsed) - 1) / monthly_rate)
// Total expected value
theoretical_total = theoretical_initial_growth + fv_contributions
Volatility Detection Logic:
// Detect extreme years for volatility adjustment
extreme_years = 0
for i = 1 to historical_years
yearly_return = ((price_current / price_i_years_ago) - 1) * 100
if yearly_return > 100 or yearly_return < -50
extreme_years += 1
// Use median approach for high volatility stocks
high_volatility = (extreme_years / historical_years) > 0.2
calculated_return = high_volatility ? median_of_returns : standard_cagr
Performance Metrics:
// Calculate key performance indicators
absolute_gain = actual_value - total_invested
total_return_pct = (absolute_gain / total_invested) * 100
roi_initial = ((actual_value - initial_investment) / initial_investment) * 100
cagr = (math.pow(actual_value / initial_investment, 1 / years_elapsed) - 1) * 100
---
📊 Real-World Examples
See the indicator in action across different investment types:
Stable Index Investments:
AMEX:SPY (SPDR S&P 500) - Shows steady compound growth with standard CAGR calculations
Classic DCA success story: $60K initial + $500/month starting 2020. The indicator shows SPY's historical 10%+ returns, demonstrating how consistent broad market investing builds wealth over time. Notice the smooth theoretical growth line vs actual performance tracking.
MIL:VUAA (Vanguard S&P 500 UCITS) - Shows both data limitation and solution approaches
Data limitation example: VUAA shows "Manual (Auto Failed)" and "No Data" when default 10-year historical setting exceeds available data. The indicator gracefully falls back to manual percentage input while maintaining all DCA calculations and projections.
MIL:VUAA (Vanguard S&P 500 UCITS) - European ETF with successful 5-year auto calculation
Solution demonstration: By adjusting historical period to 5 years (matching available data), VUAA auto calculation works perfectly. Shows how users can optimize settings for newer assets. European market exposure with EUR denomination, demonstrating DCA effectiveness across different markets and currencies.
NYSE:BRK.B (Berkshire Hathaway) - Quality value investment with Warren Buffett's proven track record
Value investing approach: Berkshire Hathaway's legendary performance through DCA lens. The indicator demonstrates how quality companies compound wealth over decades. Lower volatility than tech stocks = standard CAGR calculations used.
High-Volatility Growth Stocks:
NASDAQ:NVDA (NVIDIA Corporation) - Demonstrates volatility-adjusted calculations for extreme price swings
High-volatility example: NVIDIA's explosive AI boom creates extreme years that trigger volatility detection. The indicator automatically switches to "Median (High Vol): 50%" calculations for conservative projections, protecting against unrealistic future estimates based on outlier performance periods.
NASDAQ:TSLA (Tesla) - Shows how 10-year analysis can stabilize volatile tech stocks
Stable long-term growth: Despite Tesla's reputation for volatility, the 10-year historical analysis (34.8% CAGR) shows consistent enough performance that volatility detection doesn't trigger. Demonstrates how longer timeframes can smooth out extreme periods for more reliable projections.
NASDAQ:META (Meta Platforms) - Shows stable tech stock analysis using standard CAGR calculations
Tech stock with stable growth: Despite being a tech stock and experiencing the 2022 crash, META's 10-year history shows consistent enough performance (23.98% CAGR) that volatility detection doesn't trigger. The indicator uses standard CAGR calculations, demonstrating how not all tech stocks require conservative median adjustments.
Notice how the indicator automatically detects high-volatility periods and switches to median-based calculations for more conservative projections, while stable investments use standard CAGR methods.
---
📈 Performance Metrics Explained
Current Portfolio Value: Your actual investment worth today
Expected Value: What you should have based on historical returns (Auto) or your target return (Manual)
Total Invested: Your actual money invested (initial + all monthly contributions)
Total Gains/Loss: Absolute dollar difference between current value and total invested
Total Return %: Percentage gain/loss on your total invested amount
ROI from Initial Investment: How your starting lump sum has performed
CAGR: Compound Annual Growth Rate of your initial investment (Note: This shows initial investment performance, not full DCA strategy)
vs Benchmark: How you're performing compared to the expected returns
---
⚠️ Important Notes & Limitations
Data Requirements: Auto mode requires sufficient historical data (minimum 3 years recommended)
CAGR Limitation: CAGR calculation is based on initial investment growth only, not the complete DCA strategy
Projection Accuracy: Future projections are theoretical and based on historical returns - actual results may vary
Timeframe Support: Works ONLY on Daily (1D), Weekly (1W), and Monthly (1M) charts - no other timeframes supported
Update Frequency: Update "Current Portfolio Value" regularly for accurate tracking
---
📚 Educational Use & Disclaimer
This analysis tool can be applied to various stock and ETF charts for educational study of DCA mathematical concepts and historical performance patterns.
Study Examples: Can be used with symbols like AMEX:SPY , NASDAQ:QQQ , AMEX:VTI , NASDAQ:AAPL , NASDAQ:MSFT , NASDAQ:GOOGL , NASDAQ:AMZN , NASDAQ:TSLA , NASDAQ:NVDA for learning purposes.
EDUCATIONAL DISCLAIMER: This indicator is a study tool for analyzing Dollar-Cost Averaging strategies. It does not provide investment advice, trading signals, or guarantees. All calculations are theoretical examples for educational purposes only. Past performance does not predict future results. Users should conduct their own research and consult qualified financial professionals before making any investment decisions.
---
© 2025 TradeVizion. All rights reserved.

Turn around Tuesday on Steroids Strategy█ STRATEGY DESCRIPTION
The "Turn around Tuesday on Steroids Strategy" is a mean-reversion strategy designed to identify potential price reversals at the start of the trading week. It enters a long position when specific conditions are met and exits when the price shows strength by exceeding the previous bar's high. This strategy is optimized for ETFs, stocks, and other instruments on the daily timeframe.
█ WHAT IS THE STARTING DAY?
The Starting Day determines the first day of the trading week for the strategy. It can be set to either Sunday or Monday, depending on the instrument being traded. For ETFs and stocks, Monday is recommended. For other instruments, Sunday is recommended.
█ SIGNAL GENERATION
1. LONG ENTRY
A Buy Signal is triggered when:
The current day is the first day of the trading week (either Sunday or Monday, depending on the Starting Day setting).
The close price is lower than the previous day's close (`close < close `).
The previous day's close is also lower than the close two days ago (`close < close `).
The signal occurs within the specified time window (between `Start Time` and `End Time`).
If the MA Filter is enabled, the close price must also be above the 200-period Simple Moving Average (SMA).
2. EXIT CONDITION
A Sell Signal is generated when the current closing price exceeds the high of the previous bar (`close > high `). This indicates that the price has shown strength, potentially confirming the reversal and prompting the strategy to exit the position.
█ ADDITIONAL SETTINGS
Starting Day: Determines the first day of the trading week. Options are Sunday or Monday. Default is Sunday.
Use MA Filter: Enables or disables the 200-period SMA filter for long entries. Default is disabled.
Start Time and End Time: The time window during which the strategy is allowed to execute trades.
█ PERFORMANCE OVERVIEW
This strategy is designed for markets with frequent weekly reversals.
It performs best in volatile conditions where price movements are significant at the start of the trading week.
Backtesting results should be analysed to optimize the Starting Day and MA Filter settings for specific instruments.

S&P 500 E-Mini TrackerThis script generates a reference price for the S&P 500 ETF - SPY based on the current price of the ES contract, which is an E-Mini Futures contract representing the S&P 500 index. The indicator plots this reference price on the chart, providing a unique view of the relationship between these two popular markets.
Advantages:
Identifies divergence between the ES and SPY prices, indicating potential trading opportunities or shifts in market sentiment.
Confirms trends by showing the correlation between the ES and SPY prices.
Eliminates the need for multiple charts, allowing traders to focus on a single screen and make more informed decisions.
Customizable Parameters:
Color Scheme: Choose from various color options to customize the appearance of the indicator.
Line Style: Select from different line styles to change the visual representation of the reference price.
Divisor: Set the dividing factor to adjust the ratio at which the reference price is calculated. (Default value: 10). It is recommended to keep it at 10 for SPY.
To use it with other Stocks/ ETFs, use simple ratio math to calculate the divisor and you can customize the indicator to scale accordingly.
By using this indicator, traders can gain a deeper understanding of the relationship between the E-Mini and SPY markets, making it easier to identify trading opportunities and confirm trends.

Portfolio SnapShot v0.3Here is a Tradingview Pinescript that I call "Portfolio Snapshot". It is based on two other separate scripts that I combined, modified and simplified - shoutout to RedKTrader (Portfolio Tracker - Table Version) and FriendOfTheTrend (Portfolio Tracker For Stocks & Crypto) for their inspiration and code. I was using both of these scripts, and decided to combine the two and increase the number of stocks to 20. I was looking for an easy way to track my entire portfolio (scattered across 5 accounts) PnL on a total and stock basis. PnL - that's it, very simple by design. The features are:
1) Track PnL across multiple accounts, from inception and current day.
2) PnL is reported in two tables, at the portfolio level and individual stock level
3) Both tables can be turned on/off and placed anywhere on the chart.
4) Input up to 20 assets (stocks, crypto, ETFs)
The user has to manually calculate total shares and average basis for stocks in multiple accounts, and then inputs this in the user input dialog. I update mine as each trade is made, or you can just update once a week or so.
I've pre-loaded it with the major indices and sector ETFs, plus URA, GLD, SLV. 100 shares of each, and prices are based on the close Jan 2 2024. So if you don't want to track your portfolio, you can use it to track other things you find interesting, such as annual performance of each sector.
RSI Sector analysis
Screening tool that produces a table with the various sectors and their RSI values. The values are shown in 3 rows, each with a user-defined length, and can be averaged out and displayed as a single value. The chart is color coded as well. Each ETF representing a sector can be looked at individually, with the top holdings in each preprogrammed, but users can define their own if they wish. The left most ticker is the "benchmark"; SPY is the benchmark for the various sectors, and the ETF is the benchmark for the tickers within.
Symbols are color coded: light blue text indicates that a symbol has greater RSI values in all three timeframes than the benchmark (the leftmost symbol). Orange text indicates that a symbol has a lower RSI value for all three timeframes. In the first row, light blue text indicates the largest RSI increase from the third row to the first row. Orange text indicates the largest RSI decrease from the third row to the first row.
A blue highlight indicates that the value is the highest among the tickers, excluding the benchmark, and an orange highlight indicates that the value is the lowest among the tickers, also excluding the benchmark. A blue highlight on the ticker indicates that it has the highest average value of the 3 rows, and a orange highlight on the ticker indicates that it has the lowest average value of the 3 rows.

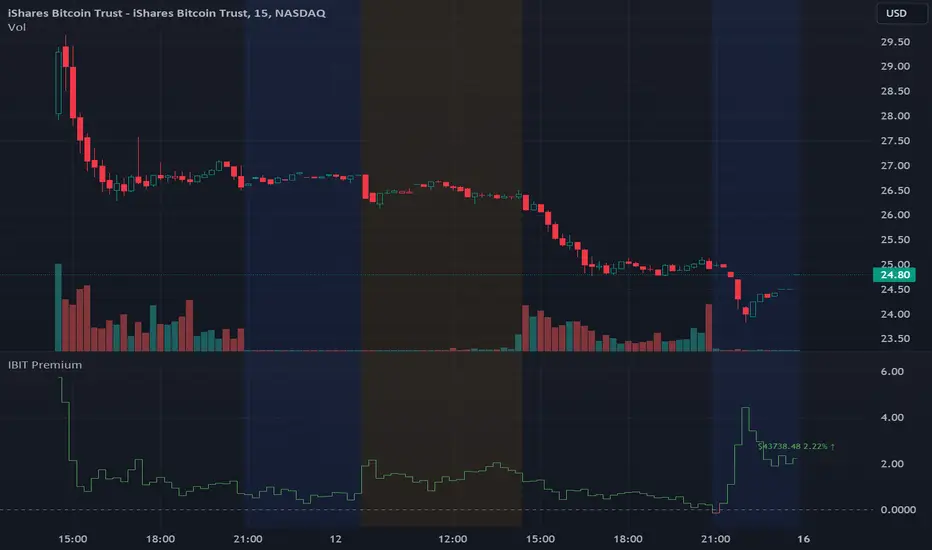
IBIT Premium to CoinbaseThe BTC ETF premium indicator for TradingView is a specialized tool designed to measure and visualize the premium or discount of the iShares Bitcoin Trust (IBIT), an investment vehicle that holds Bitcoin, relative to the actual price of Bitcoin on the Coinbase exchange. This indicator can be particularly insightful for traders interested in the BTC securities market and those analyzing the demand for Bitcoin as reflected by institutional investment products.
#### Description:
The BTC ETF premium indicator in TradingView leverages an advanced Pine Script algorithm to calculate the premium (or discount) percentage of IBIT compared to the spot price of Bitcoin (BTC/USD) on Coinbase. The premium is a critical insight that reflects market sentiment and potentially arbitrage opportunities between the trust's share price and the underlying cryptocurrency asset.
Here's how the indicator works:
1. **Calculation Methodology:**
- **Implied Bitcoin Price of IBIT:** We determine the implied price of Bitcoin within IBIT by dividing the IBIT closing price by the known ratio of Bitcoin per share.
- **IBIT Premium to Coinbase:** The percentage premium is then calculated as:
$$\text{IBIT Premium} = \frac{(\text{Implied Bitcoin Price of IBIT } - \text{Actual Bitcoin Price on Coinbase})}{\text{Actual Bitcoin Price on Coinbase}} \times 100$$
- This calculation is performed using the closing prices on a per-minute basis to ensure timely and accurate analysis.
2. **Visualization:** The indicator plots the premium as a step line chart, making it easy to visualize changes over time. A dynamic label accompanies the plot, displaying the implied Bitcoin price, the actual percentage premium or discount, and whether the premium is trending up or down compared to the previous day's value.
3. **Usage Scenario:** Traders can use this indicator to monitor the live premium 24/7 and analyze how it behaves during different market conditions, including when the equity market, where IBIT is traded, is closed.
#### Additional Features:
- **Color-Coding:** The premium is color-coded in green when positive (premium) and in red when negative (discount), aiding quick visual assessment.
- **Zero-Line Reference:** A horizontal line is drawn at zero to easily identify when IBIT is trading at par with the spot price of Bitcoin.
- **Real-Time Label Updates:** The label updates in real time with the latest premium/discount information and includes an arrow to signify the trend direction.
#### Access and Usage:
The indicator can be favorited or added to your TradingView charts. You are also welcome to use the source code as a foundation for further customization to suit your trading strategies.
#### Notes:
Please consider that the IBIT has specific trading hours, and the indicator can show live changes even when its market is closed, which might lead to discrepancies from official static data. For best performance, use this indicator alongside the IBIT candlestick chart on TradingView.
GBTC Premium to CoinbaseThe BTC ETF premium indicator for TradingView is a specialized tool designed to measure and visualize the premium or discount of the Grayscale Bitcoin Trust (GBTC), an investment vehicle that holds Bitcoin, relative to the actual price of Bitcoin on the Coinbase exchange. This indicator can be particularly insightful for traders interested in the BTC securities market and those analyzing the demand for Bitcoin as reflected by institutional investment products.
#### Description:
The BTC ETF premium indicator in TradingView leverages an advanced Pine Script algorithm to calculate the premium (or discount) percentage of GBTC compared to the spot price of Bitcoin (BTC/USD) on Coinbase. The premium is a critical insight that reflects market sentiment and potentially arbitrage opportunities between the trust's share price and the underlying cryptocurrency asset.
Here's how the indicator works:
1. **Calculation Methodology:**
- **Implied Bitcoin Price of GBTC:** We determine the implied price of Bitcoin within GBTC by dividing the GBTC closing price by the known ratio of Bitcoin per share.
- **GBTC Premium to Coinbase:** The percentage premium is then calculated as:
$$\text{GBTC Premium} = \frac{(\text{Implied Bitcoin Price of GBTC} - \text{Actual Bitcoin Price on Coinbase})}{\text{Actual Bitcoin Price on Coinbase}} \times 100$$
- This calculation is performed using the closing prices on a per-minute basis to ensure timely and accurate analysis.
2. **Visualization:** The indicator plots the premium as a step line chart, making it easy to visualize changes over time. A dynamic label accompanies the plot, displaying the implied Bitcoin price, the actual percentage premium or discount, and whether the premium is trending up or down compared to the previous day's value.
3. **Usage Scenario:** Traders can use this indicator to monitor the live premium 24/7 and analyze how it behaves during different market conditions, including when the equity market, where GBTC is traded, is closed.
#### Additional Features:
- **Color-Coding:** The premium is color-coded in green when positive (premium) and in red when negative (discount), aiding quick visual assessment.
- **Zero-Line Reference:** A horizontal line is drawn at zero to easily identify when GBTC is trading at par with the spot price of Bitcoin.
- **Real-Time Label Updates:** The label updates in real time with the latest premium/discount information and includes an arrow to signify the trend direction.
#### Access and Usage:
The indicator can be favorited or added to your TradingView charts. You are also welcome to use the source code as a foundation for further customization to suit your trading strategies.
#### Notes:
Please consider that the GBTC has specific trading hours, and the indicator can show live changes even when its market is closed, which might lead to discrepancies from official static data. For best performance, use this indicator alongside the GBTC candlestick chart on TradingView.

Leveraged Share Decay Tracker [SS]Releasing this utility tool for leveraged share traders and investors.
It is very difficult to track the amount of decay and efficiency that is associated with leveraged shares and since not all leveraged shares are created equally, I developed this tool to help investors/traders ascertain:
1. The general risk, in $$, per share associated with investing in a particular leveraged ETF
2. The ability of a leveraged share to match what it purports to do (i.e. if it is a 3X Bull share, is it actually returning consistently 3X the underlying or is there a large variance?)
3. The general decay at various timepoints expressed in $$$
How to use:
You need to be opened on the chart of the underlying. In the example above, the chart is on DIA, the leveraged share being tracked is UDOW (3X bull share of the DOW).
Once you are on the chart of the underlying, you then put in the leveraged share of interest. The indicator will perform two major assessments:
1. An analysis of the standard error between the underlying and the leveraged share. This is accomplished through linear regression, but instead of creating a linreg equation, it simply uses the results to ascertain the degree of error associated at various time points (the time points are 10, 20, 30, 40, 50, 100, 252).
2. An analysis of the variance of returns. The indicator requires you to put in the leverage amount. So if the leverage amount is 3% (i.e. SPXL or UPRO is 3 X SPY), be sure that you are putting that factor in the settings. It will then modify the underlying to match the leverage amount, and perform an assessment of variance over 10, 20, 30, 40, 50, 100, 252 days to ensure stability. This will verify whether the leveraged ETF is actually consistently performing how it purports to perform.
Here are some examples, and some tales of caution so you can see, for yourself, how not all leveraged shares are created equal.
SPY and SPXL:
SPY and UPRO:
XBI and LABU (3 x bull share):
XBI and LABD (3 x bear share):
SOX and SOXL:
AAPL and AAPU:
It is VERY pivotal you remember to check and adjust the Leveraged % factor.
For example, AAPU is leveraged 1.5%. You can see above it tracks this well. However, if you accidently leave it at 3%, you will get an erroneous result:
You can also see how some can fail to track the quoted leveraged amount, but still produce relatively lower risk decay.
And, as a final example, let's take a look at the worst leveraged share of life, BOIL:
Trainwreck that one. Stay far away from it!
The chart:
The chart will show you the drift (money value over time) and the variance (% variance between the expected and actual returns) over time. From here, you can ascertain the general length you feel comfortable holding a leveraged share. In general, for most stable shares, <= 50 trading days tends to be the sweet spot, but always check the chart.
There are also options to plot the variances and the drifts so you can see them visually.
And that is the indicator! Kind of boring, but there are absolutely 0 resources out there for doing this job, so hopefully you see the use for it!
Safe trades everyone!

Share CalculatorThis is a simple grid box that will calculate the number of total shares you can trade on two different stocks based on a principal amount you enter in the settings. The indicator updates throughout the trading day as price changes. The 25% column tells you the number of shares you can "scale into" the trade, 1/4 at a time, up to the total number of shares below.
The reason I built this indicator, is that I trade on a platform that isn't as flexible as some other platforms in terms of entering monetary amounts I want to trade in a stock. I have to enter the number of shares I want to purchase. Additionally, in some of the accounts I trade, I need to monitor both the Bull ETF and the Bear ETF, so it's helpful to have them side by side.
I was tired of going back and forth to excel and my trading platform! To use this, simply update the principal amount you have to trade, and update the Ticker symbols you want to use. Colors and grid placement are customizable.

Daily SPY PlanThe Daily SPY Plan indicator is a technical analysis tool designed to provide traders with a visual representation of price levels and take profit points for the SPY (S&P 500 ETF) on a daily timeframe. This indicator utilizes the Average True Range (ATR) to calculate projected price levels and take profit points, aiding traders in identifying potential breakout and profit-taking opportunities.
Indicator Description:
The indicator is written in Pine Script, specifically for use on the TradingView platform. It plots several levels on the price chart, each representing a potential breakout or take profit point. The levels are determined based on a fraction of the ATR added or subtracted from the closing price. The fractions used are 0.25, 0.5, 0.75, 1.0, 1.25, and 1.5 times the ATR.
The indicator distinguishes between breakout levels and take profit levels using different colors. Breakout levels, which indicate potential entry or exit points, are displayed in green, while take profit levels are shown in gray.
Key Features and Use:
ATR Calculation: The indicator calculates the Average True Range (ATR) using a specified length (default value of 14). ATR is a measure of market volatility and represents the average range between the high and low prices over a specific period.
Projected Price Levels: The indicator plots several projected price levels above and below the closing price. These levels are calculated by adding or subtracting a fraction of the ATR from the closing price. Traders can use these levels as potential breakout points or areas to set stop-loss orders.
Take Profit Points: The indicator also plots take profit points at specific levels above and below the closing price. These levels are designed to help traders identify potential areas to secure profits or partially exit their positions.
Visual Representation: The indicator utilizes step-like lines to plot the projected price levels and take profit points, providing a clear visual representation on the price chart. Traders can easily identify the relevant levels and incorporate them into their trading strategies.
Customizability: The indicator allows traders to customize the ATR length and choose whether to display Fibonacci levels (although there are no Fibonacci calculations in the provided code). These customization options enable traders to adapt the indicator to their preferred trading style and timeframe.
Limitations and Considerations:
Complementary Analysis: The Daily SPY Plan indicator should be used as a complementary tool alongside other technical analysis techniques and indicators. It provides price levels and take profit points based on ATR calculations, but it doesn't incorporate additional market factors or trading strategies.
Timeframe Suitability: The indicator is specifically designed for the daily timeframe of the SPY. Traders should consider adjusting the parameters and adapting the indicator if using it on different timeframes or instruments.
Risk Management: While the indicator suggests potential breakout and take profit points, it does not provide explicit stop-loss levels or risk management parameters. Traders should incorporate appropriate risk management techniques to protect their capital.
Conclusion:
The Daily SPY Plan indicator is a valuable technical analysis tool for traders focusing on the SPY ETF and the daily timeframe. By utilizing the ATR, it helps traders identify potential breakout levels and take profit points. However, traders should remember that this indicator is just one piece of the puzzle and should be used in conjunction with other technical analysis tools and risk management strategies to make informed trading decisions.
