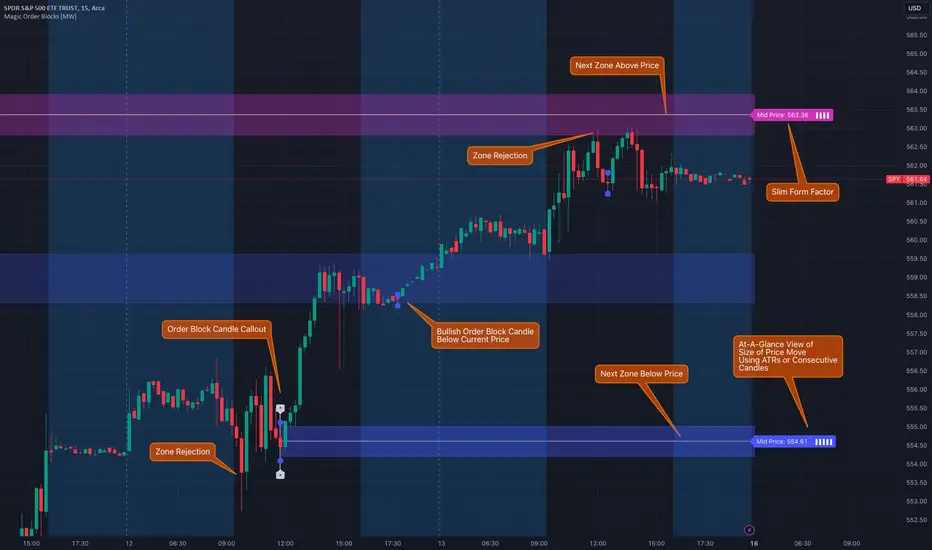
Magic Order Blocks [MW]Add a slim design, minimalist view of the most relevant higher and lower order blocks to your chart. Use our novel method of filtering that uses both the the number of consecutive bullish or bearish candles that follow the order block, and the number of ATRs that the asset’s price changed following the order block. View just the order blocks above and below the current price, or view the backgrounds for each and every one. And, if you're up to it, dig into a comprehensive view of the data for each order block candle.
Settings:
General Settings
Minimum # of Consecutive Bars Following Order Block
Show Bullish Order Blocks Below / Hide Last Bullish Block
Show Bearish Order Blocks Above / Hide Last Bearish Block
Use ATR Filter - Select # of ATRs Below
Closest Order Block is Followed by This Many ATRs
Preferences
Right Offset of Indicator Label
Show Mid-Line from Recent Order Block Indicator Label
Use ATRs Instead of Consecutive Candles in Label Indicator
Show Timestamp of Recent Order Block
Show Large Order Block Detail Labels
Show Small Order Block Labels
Background Settings
Show Background for Recent Order Block Indicator Label
# of Backgrounds to Show Before Now
Show All Bullish Order Block Backgrounds
Show All Bearish Order Block Backgrounds
Calculations
This indicator creates a matrix of each order block that is followed by the user-specified number of consecutive bullish or bearish candles. The data can be further filtered by the number of ATRs that the price moves after the order block - also user-defined. The most recent bearish order block above the current price takes arrays from the initial filtered matrix of arrays, filters once more by the “mid-price” of the order block (the average between the order block candle high and low) and selects the last element from this order block matrix. The same follows for the latest bearish order block above the current price.
How to Use
An order block refers to a price range or zone on a chart where large institutional orders have been placed, causing a significant shift in market direction. These zones are crucial because they often indicate areas of strong buying or selling interest, which can lead to future support or resistance levels. Traders use order blocks to identify potential points of market reversal or continuation.
The Magic Order Blocks default view shows the most recent overhead bearish order block above the current price, and the most recent bullish order block below. These can presumably act as support or resistance levels, because they reflect the last price where a significant price move occurred. “Significant” meaning that the order block candle was followed by many consecutive bullish or bearish candles. Based on the user-defined settings, it can also mean that price moved multiples of the asset's average true range (ATR). More consecutive candles means that the duration of the move lasted a long time. A higher ATR move indicates that the price moved impulsively in one direction.
The default view also shows a label to the right of the current price that provides the price level, the time stamp of the order block (optional), and a sequence of bars that show the significance of the level. By default, these bars represent the number of ATRs that price rose or fell following the order block, but they can be toggled to show the number of consecutive bullish or bearish candles that followed the order block.
Although the default view provides the zones that are most relevant to the current price, past order block candles can also be identified visually with labels as well with translucent backgrounds color-coded for bullish or bearish bias. Overlapping backgrounds can identify an area that has been repeatedly been an area of support or resistance.
A detailed view of each order block can also be viewed the includes the following data points:
Bar Index
Timestamp
Consecutive Accumulated Volume
Consecutive Bars
Price Change over Consecutive Bars
Price/Volume Ratio Over Consecutive Bars
Mid Price of Order Block
High Price of Order Block
Low Price of Order Block
ATRs over Consecutive Bars
- Other Usage Notes and Limitations:
The calculations used only provide an estimated relationship or a close approximation, and are not exact.
It's important for traders to be aware of the limitations of any indicator and to use them as part of a broader, well-rounded trading strategy that includes risk management, fundamental analysis, and other tools that can help with reducing false signals, determining trend direction, and providing additional confirmation for a trade decision. Diversifying strategies and not relying solely on one type of indicator or analysis can help mitigate some of these risks.
Things to keep in mind. Longer timeframes don’t necessarily have a as many consecutive candle drops or gains as with shorter timeframes, so be sure to adjust your settings when moving to 1 hour, 1 day, or 1 week timeframes from 1 minute, 5 minute, or 15 minute timeframes.
Cari dalam skrip untuk "国泰黄金ETF联接C相关行业指数的最新政策"
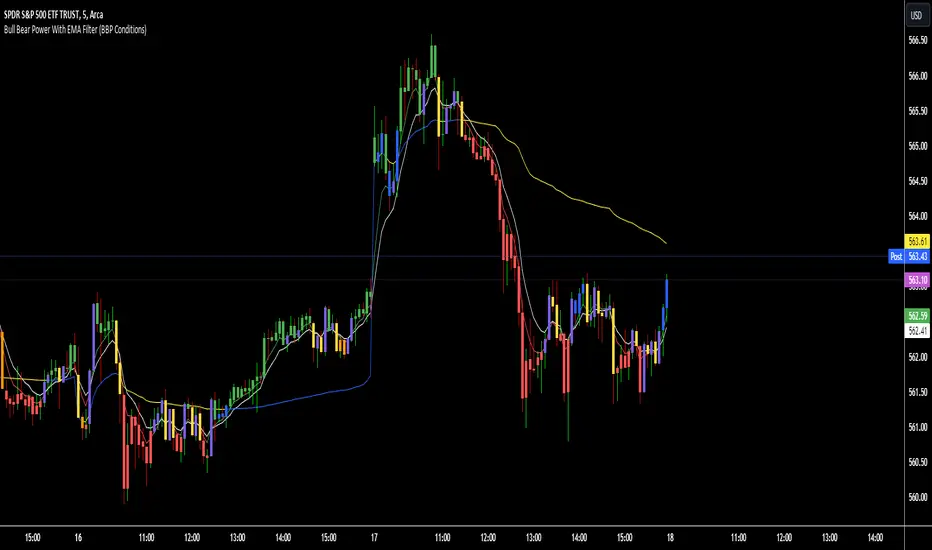
Bull Bear Power With EMA FilterDescription of Indicator:
This Pine Script indicator colors price bars based on the open price in relation to custom moving averages (EMA/SMA), Bull/Bear Power (BBPower), and an optional VWAP filter. The bar colors help identify bullish and bearish conditions with added visual cues for price positioning relative to VWAP.
Key Features:
Customizable Moving Averages (EMA/SMA):
The user can select between EMA or SMA for both short-term and long-term moving averages.
Default moving averages are set to 5 (short-term) and 9 (long-term) but can be adjusted by the user.
Bullish Condition (Blue or Purple Bars):
A bar is colored blue if the following conditions are met:
The open price is above both the short-term and long-term moving averages.
The short-term moving average (MA 1) is above the long-term moving average (MA 2).
BBPower (open price minus the 13-period EMA) is positive, indicating bullish strength.
If the VWAP filter is enabled and the price opens below VWAP, the bullish bars will turn purple.
Bearish Condition (Yellow or Orange Bars):
A bar is colored yellow if the following conditions are met:
The open price is below both the short-term and long-term moving averages.
The short-term moving average (MA 1) is below the long-term moving average (MA 2).
BBPower is negative or zero, indicating bearish market conditions.
If the VWAP filter is enabled and the price opens above VWAP, the bearish bars will turn orange.
VWAP Filter (Optional):
An optional filter allows the user to add VWAP (Volume-Weighted Average Price) to the bar coloring logic.
When the VWAP filter is enabled, it provides additional information about price positioning relative to VWAP, turning bullish bars purple and bearish bars orange depending on whether the price opens above or below VWAP.
Usage:
Bullish Trend: Look for blue or purple bars to identify potential bullish momentum.
Bearish Trend: Look for yellow or orange bars to spot bearish conditions in the market.
The indicator allows users to customize the length and type of moving averages (EMA or SMA), as well as decide whether to apply the VWAP filter.
This indicator provides traders with clear visual signals to quickly assess the strength of bullish or bearish conditions based on the price's position relative to custom moving averages, BBPower, and VWAP, helping with trend identification and potential trade setups.
Hull MA with Alerts and LabelsThis script is designed to help traders visually track market trends using various types of moving averages (MAs) and to receive alerts when certain conditions are met. Here’s a detailed breakdown of how the script works:
1. User Inputs and Customization:
MA Length: Traders can define the length of the moving average (default is 100).
Confirmation Candles: The trader can specify how many candles must confirm a trend before the script triggers a signal (default is 1).
MA Variation: The trader can choose between different moving average types: Simple Moving Average (SMA), Exponential Moving Average (EMA), Weighted Moving Average (WMA), or Hull Moving Average (HMA).
Source: Traders select the price source for the moving average calculation (e.g., close price).
Ribbon Transparency: Allows control over the transparency level of the ribbon plotted between the moving averages.
Bullish/Bearish Ribbon Colors: The user can choose the colors for bullish and bearish trends.
2. Moving Average Calculations:
The script provides multiple options for calculating moving averages:
SMA (Simple Moving Average)
EMA (Exponential Moving Average)
WMA (Weighted Moving Average)
HMA (Hull Moving Average)
For the Hull Moving Average (HMA), it uses a specific formula that smoothens the movement and reduces lag, which is helpful for more reactive trend detection.
3. Plotting Moving Averages and Trend Ribbon:
The script calculates two key moving averages:
MHULL: The main moving average, selected based on the user’s chosen MA variation and source.
SHULL: A shifted version of the MHULL to help compare trends (shifted by 2 bars).
These two moving averages are plotted on the chart for visualization. MHULL is plotted in green (or another color if changed), while SHULL is plotted in red. A ribbon is drawn between MHULL and SHULL to indicate trends visually. The ribbon changes color depending on whether the trend is bullish (MHULL > SHULL) or bearish (MHULL < SHULL). The ribbon’s transparency can be adjusted for visual clarity.
4. Trend Detection:
Bullish Trend: The script checks if the price has closed above MHULL for the defined number of confirmation candles. If confirmed, a bullish trend is detected.
Bearish Trend: Similarly, the script checks if the price has closed below SHULL for the confirmation period, indicating a bearish trend.
The script tracks whether the market is in a bullish or bearish trend and prevents repeated signals by remembering the current trend state.
5. Alerts and Labels:
Bullish Alerts and Labels: When a confirmed bullish trend is detected (i.e., price closes above MHULL for the entire confirmation period and MHULL > SHULL), the script triggers an alert notifying the trader of the bullish condition. A "BULLISH" label is placed on the chart near the low of the candle where the trend was confirmed.
Bearish Alerts and Labels: If a confirmed bearish trend is detected (i.e., price closes below SHULL for the confirmation period and MHULL < SHULL), the script triggers an alert for the bearish condition. A "BEARISH" label is placed on the chart near the high of the candle where the trend was confirmed.
These alerts and labels help traders act quickly on trend changes and align their trading strategy with market conditions.
6. Practical Use for Traders:
For traders, this script offers:
Customizability : It allows traders to define the length and type of moving averages, choose price sources, and control how signals are confirmed.
Visual Trend Representation : The plotted MA lines and colored ribbons help traders easily see market direction.
Early Warnings : With alerts and labels, the script gives traders early signals when trends are shifting, allowing them to adjust positions accordingly.
Trend Confirmation : The script waits for a user-defined number of confirmation candles before signaling a new trend, reducing false signals.
Overall, the script helps traders automate their strategy by tracking moving averages and alerting them when key trend conditions are met.

Dynamic ConfluenceThe Dynamic MA Confluence Indicator is a powerful tool designed to simplify your trading experience by automatically identifying the most influential moving average (MA) lengths on your chart. Whether you're using Simple Moving Averages (SMA) or Exponential Moving Averages (EMA), this indicator helps you pinpoint the MA length that holds the greatest confluence, allowing you to make informed trading decisions with ease.
How It Works:
This indicator analyzes a wide range of moving averages, from short-term to long-term, to determine which ones are closest to each other. By setting a "Proximity Percentage," you can control how close these MAs need to be to be considered as having confluence. The indicator then calculates the average of these close MAs to establish a dynamic support or resistance level on your chart.
Why Use This Indicator?
Automatic Optimization: Unsure of which MA length to apply? The indicator automatically highlights the MA length with the most confluence, giving you a clear edge in identifying significant market levels.
Adaptability: Choose between SMA and EMA to suit your trading strategy and market conditions.
Enhanced Decision-Making: By focusing on the MA length with the greatest influence, you can better anticipate market movements and adjust your strategies accordingly.
Customizable Sensitivity: Adjust the Proximity Percentage to fine-tune the indicator's sensitivity, ensuring it aligns with your trading preferences.
Key Feature:
Current Key Confluence MA Length: Displayed in an optional table, this feature shows the MA length that currently has the most impact on the confluence level, providing you with actionable insights at a glance.
Whether you're a seasoned trader or just starting, the Dynamic MA Confluence Indicator offers a streamlined approach to understanding market dynamics, helping you trade smarter and with more confidence. This presentation text is designed to clearly communicate the purpose, functionality, and benefits of the indicator, making it easy for users to understand its value and how it can enhance their trading strategies.
The Dynamic MA Confluence Indicator is a tool designed to assist traders in analyzing market trends. It should not be considered as financial advice or a guarantee of future performance. Trading involves significant risk, and it is possible to lose more than your initial investment. Users should conduct their own research and consider their financial situation before making trading decisions. Always consult with a financial advisor if you are unsure about any trading strategies or decisions. This disclaimer is intended to remind users of the inherent risks in trading and the importance of conducting their own due diligence.

Dynamic Jurik RSX w/ Fisher Transform█ Introduction
The Dynamic Jurik RSX with Fisher Transform is a powerful and adaptive momentum indicator designed for traders who seek a non-laggy view of price movements. This script is based on the classic Jurik RSX (Relative Strength Index). It also includes features such as the dynamic overbought and oversold limits, the Inverse Fisher Transform, trend display, slope calculations, and the ability to color extremes for better clarity.
█ Key Features:
• RSX: The Relative Strength Index (RSX) in this script is based on Jurik’s RSX, which is smoother than the traditional RSI and aims to reduce noise and lag. This script calculates the RSX using an exponential smoothing technique and adaptive adjustments.
• Inverse Fisher Transform: This script can optionally apply the Inverse Fisher Transform to the RSX, which helps to normalize the RSX values, compressing them between -1 and 1. The inverse transformation makes it easier to spot extreme values (overbought and oversold conditions) by enhancing the visual clarity of those extremes. It also smooths the curve over a user-defined period in hopes of providing a more consistent signal.
• Dynamic Limits: The dynamic overbought and oversold limits are calculated based on the RSX's recent high and low values. The limits adjust dynamically depending on market conditions, making them more relevant to current price action.
• Slope Display: The slope of the RSX is calculated as the rate of change between the current and previous RSX value. The slope is displayed as dots when the slope exceeds the threshold designated by the user, providing visual cues for momentum shifts.
• Trend Coloring: Optionally, the user can also enable a trend-based display. It is simply based on current value of RSX versus the previous one. If RSX is rising then the trend is bullish, if not, then the trend is bearish.
• Coloring Extremes: Users can configure the RSX to color the chart when prices enter extreme conditions, such as overbought or oversold zones, providing visual cues for market reversals.
█ Attached Chart Notes:
• Top Panel: Enabled dynamic limits, Trend display, standard Jurik RSX with 20 lookback period, and Slope display.
• Middle Panel: Enabled dynamic limits, Extremes display, and standard Jurik RSX with 20 lookback period.
• Bottom Panel: Enabled dynamic limits, Trend display, Inverse Fisher Transform with 14 lookback period and 9 smoothing period. and Slope display.
█ Credits:
Special thanks to Everget for providing the original script. The script was also slightly modified based on updates from outside sources.
█ Disclaimer:
This script is for educational purposes only and should not be considered financial advice. Always conduct your own research and consult a professional before making any trading decisions.

Sinc MAKaiser Windowed Sinc Moving Average Indicator
The Kaiser Windowed Sinc Moving Average is an advanced technical indicator that combines the sinc function with the Kaiser window to create a highly customizable finite impulse response (FIR) filter for financial time series analysis.
Sinc Function: The Ideal Low-Pass Filter
At the core of this indicator is the sinc function, which represents the impulse response of an ideal low-pass filter. In signal processing and technical analysis, the sinc function is crucial because it allows for the creation of filters with precise frequency cutoff characteristics. When applied to financial data, this means the ability to separate long-term trends from short-term fluctuations with remarkable accuracy.
The primary advantage of using a sinc-based filter is the independent control over two critical parameters: the cutoff frequency and the number of samples used. The cutoff frequency, analogous to the "length" in traditional moving averages, determines which price movements are considered significant (low frequency) and which are treated as noise (high frequency). By adjusting the cutoff, analysts can fine-tune the filter to respond to specific market cycles or timeframes of interest.
The number of samples used in the filter doesn't affect the cutoff frequency but instead influences the filter's accuracy and steepness. Increasing the sample size results in a better approximation of the ideal low-pass filter, leading to sharper transitions between passed and attenuated frequencies. This allows for more precise trend identification and noise reduction without changing the fundamental frequency response characteristics.
Kaiser Window: Optimizing the Sinc Filter
While the sinc function provides excellent frequency domain characteristics, it has infinite length in the time domain, which is impractical for real-world applications. This is where the Kaiser window comes into play. By applying the Kaiser window to the sinc function, we create a finite-length filter that approximates the ideal response while minimizing unwanted oscillations (known as the Gibbs phenomenon) in the frequency domain.
The Kaiser window introduces an additional parameter, alpha, which controls the trade-off between the main-lobe width and side-lobe levels in the frequency response. This parameter allows users to fine-tune the filter's behavior, balancing between sharp cutoffs and minimal ripple effects.
Customizable Parameters
The Kaiser Windowed Sinc Moving Average offers several key parameters for customization:
Cutoff: Controls the filter's cutoff frequency, determining the divide between trends and noise.
Length: Sets the number of samples used in the FIR filter calculation, affecting the filter's accuracy and computational complexity.
Alpha: Influences the shape of the Kaiser window, allowing for fine-tuning of the filter's frequency response characteristics.
Centered and Non-Centered Modes
The indicator provides two operational modes:
Non-Centered (Real-time) Mode: Uses half of the windowed sinc function, suitable for real-time analysis and current market conditions.
Centered Mode: Utilizes the full windowed sinc function, resulting in a zero-phase filter. This mode introduces a delay but offers the most accurate trend identification for historical analysis.
Visualization Features
To enhance the analytical value of the indicator, several visualization options are included:
Gradient Coloring: Offers a range of color schemes to represent trend direction and strength.
Glow Effect: An optional visual enhancement for improved line visibility.
Background Fill: Highlights the area between the moving average and price, aiding in trend visualization.
Applications in Technical Analysis
The Kaiser Windowed Sinc Moving Average is particularly useful for precise trend identification, cycle analysis, and noise reduction in financial time series. Its ability to create custom low-pass filters with independent control over cutoff and filter accuracy makes it a powerful tool for analyzing various market conditions and timeframes.
Compared to traditional moving averages, this indicator offers superior frequency response characteristics and reduced lag in trend identification when properly tuned. It provides greater flexibility in filter design, allowing analysts to create moving averages tailored to specific trading strategies or market behaviors.
Conclusion
The Kaiser Windowed Sinc Moving Average represents an advanced approach to price smoothing and trend identification in technical analysis. By making the ideal low-pass filter characteristics of the sinc function practically applicable through Kaiser windowing, this indicator provides traders and analysts with a sophisticated tool for examining price trends and cycles.
Its implementation in Pine Script contributes to the TradingView community by making advanced signal processing techniques accessible for experimentation and further development in technical analysis. This indicator serves not only as a practical tool for market analysis but also as an educational resource for those interested in the intersection of signal processing and financial markets.
Related script:

Larry Connors 3 Day High/Low StrategyThe Larry Connors 3 Day High/Low Strategy is a short-term mean-reversion trading strategy that is designed to identify potential buying opportunities when a security is oversold. This strategy is based on the principles developed by Larry Connors, a well-known trading system developer and author.
Key Strategy Elements:
1. Trend Confirmation: The strategy first confirms that the security is in a long-term uptrend by ensuring that the closing price is above the 200-day moving average (condition1). This rule helps filter trades to align with the longer-term trend.
2. Short-Term Pullback: The strategy looks for a short-term pullback by ensuring that the closing price is below the 5-day moving average (condition2). This identifies potential entry points when the price temporarily moves against the longer-term trend.
3. Three Consecutive Lower Highs and Lows:
• The high and low two days ago are lower than those of the day before (condition3).
• The high and low yesterday are lower than those of two days ago (condition4).
• Today’s high and low are lower than yesterday’s (condition5).
These conditions are used to identify a sequence of declining highs and lows, signaling a short-term pullback or oversold condition in the context of an overall uptrend.
4. Entry and Exit Signals:
• Buy Signal: A buy order is triggered when all the above conditions are met (buyCondition).
• Sell Signal: A sell order is executed when the closing price is above the 5-day moving average (sellCondition), indicating that the pullback might be ending.
Risks of the Strategy
1. Mean Reversion Failure: This strategy relies on the assumption that prices will revert to the mean after a short-term pullback. In strong downtrends or during market crashes, prices may continue to decline, leading to significant losses.
2. Whipsaws and False Signals: The strategy may generate false signals, especially in choppy or sideways markets where the price does not follow a clear trend. This can lead to frequent small losses that can add up over time.
3. Dependence on Historical Patterns: The strategy is based on historical price patterns, which do not always predict future price movements accurately. Sudden market news or economic changes can disrupt the pattern.
4. Lack of Risk Management: The strategy as written does not include stop losses or position sizing rules, which can expose traders to larger-than-expected losses if conditions change rapidly.
About Larry Connors
Larry Connors is a renowned trader, author, and founder of Connors Research and TradingMarkets.com. He is widely recognized for his development of quantitative trading strategies, especially those focusing on short-term mean reversion techniques. Connors has authored several books on trading, including “Short-Term Trading Strategies That Work” and “Street Smarts,” co-authored with Linda Raschke. His strategies are known for their systematic, rules-based approach and have been widely used by traders and investment professionals.
Connors’ research often emphasizes the importance of trading with the trend, managing risk, and using statistically validated techniques to improve trading outcomes. His work has been influential in the field of quantitative trading, providing accessible strategies for traders at various skill levels.
References
1. Connors, L., & Raschke, L. (1995). Street Smarts: High Probability Short-Term Trading Strategies.
2. Connors, L. (2009). Short-Term Trading Strategies That Work.
3. Fama, E. F., & French, K. R. (1988). Permanent and Temporary Components of Stock Prices. Journal of Political Economy, 96(2), 246-273.
This strategy and its variations are popular among traders looking to capitalize on short-term price movements while aligning with longer-term trends. However, like all trading strategies, it requires rigorous backtesting and risk management to ensure its effectiveness under different market conditions.

Averaging Down Strategy1. Averaging Down:
Definition: "Averaging Down" is a strategy in which an investor buys more shares of a declining asset, thus lowering the average purchase price. The main idea is that, by averaging down, the investor can recover faster when the price eventually rebounds.
Risk Considerations: This strategy assumes that the asset will recover in value. If the price continues to decline, however, the investor may suffer larger losses. Academic research highlights the psychological bias of loss aversion that often leads investors to engage in averaging down, despite the increased risk (Barberis & Huang, 2001).
2. RSI (Relative Strength Index):
Definition: The RSI is a momentum oscillator that measures the speed and change of price movements. It ranges from 0 to 100 and is commonly used to identify overbought or oversold conditions. A reading below 30 (or in this case, 35) typically indicates an oversold condition, which might suggest a potential buying opportunity (Wilder, 1978).
Risk Considerations: RSI-based strategies can produce many false signals in range-bound or choppy markets, where prices do not exhibit strong trends. This can lead to multiple losing trades and an overall negative performance (Gencay, 1998).
3. Combination of RSI and Price Movement:
Approach: The combination of RSI for entry signals and price movement (previous day's high) for exit signals aims to capture short-term market reversals. This hybrid approach attempts to balance momentum with price confirmation.
Risk Considerations: While this combination can work well in trending markets, it may struggle in volatile or sideways markets. Additionally, a significant risk of averaging down is that the trader may continue adding to a losing position, which can exacerbate losses if the price keeps falling.
Risk Warnings:
Increased Losses Through Averaging Down:
Averaging down involves buying more of a falling asset, which can increase exposure to downside risk. Studies have shown that this approach can lead to larger losses when markets continue to decline, especially during prolonged bear markets (Statman, 2004).
A key risk is that this strategy may lead to significant capital drawdowns if the price of the asset does not recover as expected. In the worst-case scenario, this can result in a total loss of the invested capital.
False Signals with RSI:
RSI-based strategies are prone to generating false signals, particularly in markets that do not exhibit strong trends. For example, Gencay (1998) found that while RSI can be effective in certain conditions, it often fails in choppy or range-bound markets, leading to frequent stop-outs and drawdowns.
Psychological Bias:
Behavioral finance research suggests that the "Averaging Down" strategy may be influenced by loss aversion, a bias where investors prefer to avoid losses rather than achieve gains (Kahneman & Tversky, 1979). This can lead to poor decision-making, as investors continue to add to losing positions in the hope of a recovery.
Empirical Studies:
Gencay (1998): The study "The Predictability of Security Returns with Simple Technical Trading Rules" found that technical indicators like RSI can provide predictive value in certain markets, particularly in volatile environments. However, they are less reliable in markets that lack clear trends.
Barberis & Huang (2001): Their research on behavioral biases, including loss aversion, explains why investors are often tempted to average down despite the risks, as they attempt to avoid realizing losses.
Statman (2004): In "The Diversification Puzzle," Statman discusses how strategies like averaging down can increase risk exposure without necessarily improving long-term returns, especially if the underlying asset continues to perform poorly.
Conclusion:
The "Averaging Down Strategy with RSI" combines elements of technical analysis with a psychologically-driven averaging down approach. While the strategy may offer opportunities in trending or oversold markets, it carries significant risks, particularly in volatile or declining markets. Traders should be cautious when using this strategy, ensuring they manage risk effectively and avoid overexposure to a losing position.

Support Resistance UltimateThe "Support Resistance ULTIMATE" indicator is a comprehensive tool for traders on the TradingView platform, designed to identify key support and resistance levels using two primary techniques: pivot points and volume data. This indicator provides flexibility and customization, allowing traders to adapt it to their specific trading strategies.
KEY FEATURES
Pivot-Based Levels:
This feature calculates support and resistance levels using pivot points, which are derived from the high, low, and close prices of previous trading periods. Pivot points are crucial for forecasting potential market turning points.
Users can customize the pivot calculation by selecting the source type (either 'Close' or 'High/Low') and adjusting the lookback periods for both the left and right sides of the pivot calculation. This flexibility allows traders to adapt the indicator to different market conditions and timeframes.
Volume-Based Levels:
This option focuses on identifying support and resistance levels based on volume data, specifically the Point of Control (POC). The POC represents the price level with the highest traded volume during a specific time period, reflecting a consensus value among market participants.
The indicator includes a rolling POC calculation, allowing traders to dynamically assess areas of significant trading interest that may serve as support or resistance zones.
ADVANTAGES
Customization and Flexibility:
Traders can choose between pivot-based and volume-based levels or use both simultaneously, depending on their analysis needs. This dual approach provides a comprehensive view of market dynamics, accommodating various trading styles.
The indicator offers customizable color settings for support and resistance lines, enhancing chart readability and allowing traders to personalize their visual analysis.
Enhanced Market Insights:
By utilizing pivot points, traders can identify potential reversal or consolidation points, aiding in the prediction of market trends and the establishment of strategic entry and exit points.
Volume-based levels provide insights into market sentiment and participation, highlighting areas of strong support or resistance based on trading volume. This can improve risk management and trade execution by identifying high-probability trading zones.
Importance Scoring:
The indicator calculates the importance of each level based on the number of touches and the duration it holds. This scoring system helps traders assess the strength of support and resistance levels, with thicker lines indicating more significant levels.
This indicator is intended for educational and informational purposes only and should not be considered financial advice. Trading involves significant risk, and you should consult with a financial advisor before making any trading decisions. The performance of this indicator is not guaranteed, and past results do not predict future performance. Use at your own risk.

Kaiser Window MAKaiser Window Moving Average Indicator
The Kaiser Window Moving Average is a technical indicator that implements the Kaiser window function in the context of a moving average. This indicator serves as an example of applying the Kaiser window and the modified Bessel function of the first kind in technical analysis, providing an open-source implementation of these functions in the TradingView Pine Script ecosystem.
Key Components
Kaiser Window Implementation
This indicator incorporates the Kaiser window, a parameterized window function with certain frequency response characteristics. By making this implementation available in Pine Script, it allows for exploration and experimentation with the Kaiser window in the context of financial time series analysis.
Modified Bessel Function of the First Kind
The indicator includes an implementation of the modified Bessel function of the first kind, which is integral to the Kaiser window calculation. This mathematical function is now accessible within TradingView, potentially useful for other custom indicators or studies.
Customizable Alpha Parameter
The indicator features an adjustable alpha parameter, which directly influences the shape of the Kaiser window. This parameter allows for experimentation with the indicator's behavior:
Lower alpha values: The indicator's behavior approaches that of a Simple Moving Average (SMA)
Moderate alpha values: The behavior becomes more similar to a Weighted Moving Average (WMA)
Higher alpha values: Increases the weight of more recent data points
In signal processing terms, the alpha parameter affects the trade-off between main-lobe width and side lobe level in the frequency domain.
Centered and Non-Centered Modes
The indicator offers two operational modes:
Non-Centered (Real-time) Mode: Uses half of the Kaiser window, starting from the peak. This mode operates similarly to traditional moving averages, suitable for real-time analysis.
Centered Mode: Utilizes the full Kaiser window, resulting in a phase-correct filter. This mode introduces a delay equal to half the window size, with the plot automatically offset to align with the correct time points.
Visualization Options
The indicator includes several visualization features to aid in analysis:
Gradient Coloring: Offers three gradient options:
• Three-color gradient: Includes a neutral color
• Two-color gradient: Traditional up/down color scheme
• Solid color: For a uniform appearance
Glow Effect: An optional visual enhancement for the moving average line.
Background Fill: An option to fill the area between the moving average and the price.
Use Cases
The Kaiser Window Moving Average can be applied similarly to other moving averages. Its primary value lies in providing an example implementation of the Kaiser window and modified Bessel function in TradingView. It serves as a starting point for traders and analysts interested in exploring these mathematical concepts in the context of technical analysis.
Conclusion
The Kaiser Window Moving Average indicator demonstrates the application of the Kaiser window function in a moving average calculation. By providing open-source implementations of the Kaiser window and the modified Bessel function of the first kind, this indicator contributes to the expansion of available mathematical tools in the TradingView Pine Script environment, potentially facilitating further experimentation and development in technical analysis.

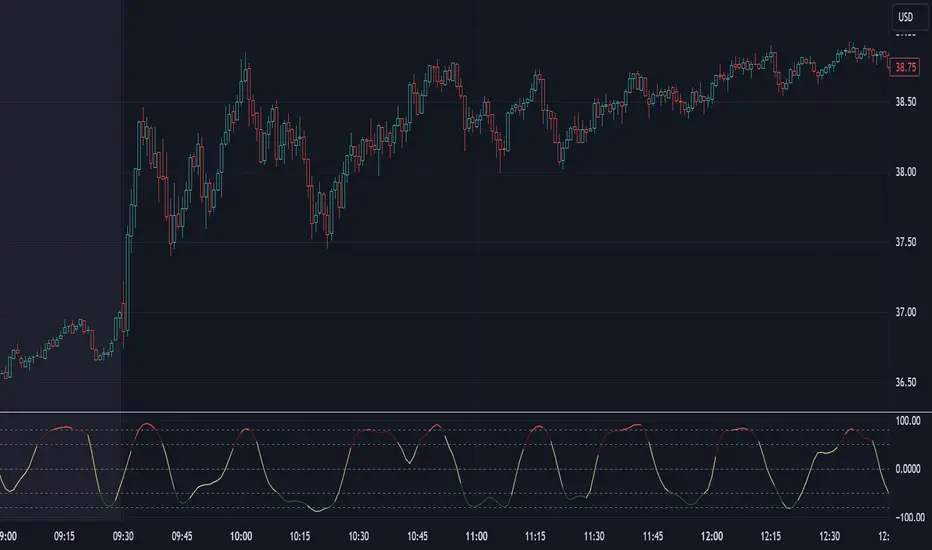
Composite Momentum█ Introduction
The Composite Momentum Indicator is a tool we came across that we found to be useful at detecting implied tops and bottoms within quick market cycles. Its approach to analyzing momentum through a combination of moving averages and summation techniques makes it a useful addition to the range of available indicators on TradingView.
█ How It Works
This indicator operates by calculating the difference between two moving averages—one fast and one slow, which can be customized by the user. The difference between these two averages is then expressed as a percentage of the fast moving average, forming the core momentum value which is then smoothed with an Exponential Moving Average is applied. The smoothed momentum is then compared across periods to identify directional changes in direction
Furthermore, the script calculates the absolute differences between consecutive momentum values. These differences are used to determine periods of momentum acceleration or deceleration, aiming to establish potential reversals.
In addition to tracking momentum changes, the indicator sums positive and negative momentum changes separately over a user-defined period. This summation is intended to provide a clearer picture of the prevailing market bias—whether it’s leaning towards strength or weakness.
Finally, the summed-up values are normalized to a percentage scale. This normalization helps in identifying potential tops and bottoms by comparing the relative strength of the momentum within a given cycle.
█ Usage
This indicator is primarily useful for traders who focus on detecting quick cycle tops and bottoms. It provides a view of momentum shifts that can signal these extremes, though it’s important to use it in conjunction with other tools and market analysis techniques. Given its ability to highlight potential reversals, it may be of interest to those who seek to understand short-term market dynamics.
█ Disclaimer
This script was discovered without any information about its author or original intent but was nonetheless ported from its original format that is available publicly. It’s provided here for educational purposes and should not be considered a guaranteed method for market analysis. Users are encouraged to test and understand the indicator thoroughly before applying it in real trading scenarios.
Honey Badger and Dip and Rip Days**Definitions**
A Honey Badger Day is defined as a day where the market dips below a certain threshold but then closes above it. Specifically:
- The day's low is less than or equal to the lower of either the opening price or the previous day's closing price.
- The day's closing price is greater than or equal to this same lower threshold.
Dip and Rip Day:A Dip and Rip Day is characterized by a more pronounced dip followed by a stronger recovery. The criteria are:
- The day's low is below 0.11% of the lower of the day's opening price or the previous day's closing price.
- The day's closing price is at least 0.405% higher than its opening price.
- The day's closing price is at least 0.792% higher than its low.
- The day's closing price is at least 0.405% higher than the previous day's closing price.
Both patterns indicate a day where the market experiences a dip but then recovers, with the Dip and Rip pattern showing a more dramatic movement in both directions.

MM Day Trader LevelsAs an intraday trader, there are certain key levels that I care about for short-term price action on every single chart. When I first began day trading, each morning I would painstakingly mark those key levels off on the charts I planned to trade each day. Depending on the number of charts I was watching, this would take up quite a bit of my time that I felt would have been much better spent doing other things. It also meant that those levels would often be left behind, and on later days I might be trading a symbol and get confused when a line appeared and I'd be paying attention to it only to later discover that it wasn't from prior day, but from some other day in the past when I had marked it off.
I looked all over TradingView to find indicators that did this automatically for me, and I found a lot of them. One by one I tried them, and inevitably I would always find that something was wrong with them. Often they didn't have all of the levels I wanted (so I would have to combine multiple indicators), but more often I found that the levels would be incorrect, or they would be buggy and not appear consistently, or they would not appear at the right time, or they would not work on futures! The list of problems went on and on. And the biggest issue I found was that nobody knew how to get session volume profile in an indicator.
So, over the course of a few years I figured out how to solve all of those problems and now I'm thrilled to present this free indicator for everyone like me who trades intraday and wants a clean consistent way to see the prior day levels that they care about automatically on every single chart (even futures). The levels the indicator provides are:
Yesterday High & Low
Value Area High & Low & Point of Control
Today's Open
Yesterday's Close (aka "Settlement" on futures)
Premarket High & Low (non-futures only)
Overnight High & Low (futures only)
These levels are extremely important, and I expect price to be reactive to them, so each level has a shaded background behind it so that the levels stand out against other lines you may have on your chart. I try to keep configuration as simple as possible, but there are configuration options that allow you to:
Hide any of the levels
Change the color for the levels
Shade the value area (or not)
Change the label text, size, type (basic label or plain text) and location (how far to the right of last candle to place the label
Adjust session volume profile value area volume & number of rows
The biggest advantage to this indicator over others on TradingView is how it handles session volume profile. When it comes to futures, TradingView does differentiate between regular trading hours and "electronic" trading hours on the charts, but their timeframes for those sessions are unusual, and they do not provide any programmatic way to differentiate between them. So, I created a whole new library for dealing with futures sessions that is fully integrated into both my Session Volume Profile library and this indicator, allowing me to bring you the best and only custom indicator available on TradingView that provides you with true regular session volume profile information across every type of symbol, including futures.
I'm incredibly proud of everything I've been able to provide with this indicator, and even more thrilled to say that I'm proud of how the indicator has been implemented. Once again releasing this indicator and all associated code for free and open source. I encourage you to take a look at the source code to see how it all works, take advantage of the free underlying libraries I created to make all of this possible: Session Library and Session Volume Profile Library.

Landry Light with Moving AverageLandry Light with Moving Average
Overview:
This Pine Script, titled "Landry Light with Moving Average", visualizes the relationship between price action and a chosen moving average (MA) over time. It helps users easily identify periods where the price stays consistently above or below the moving average, which can be a useful indicator of bullish or bearish trends.
Key Features:
Moving Average Type Selection:
The script allows users to choose between two types of moving averages:
Exponential Moving Average (EMA)
Simple Moving Average (SMA)
This is done via a user input option, enabling traders to tailor the indicator to their preferred analysis method.
Moving Average Length:
Users can set the length of the moving average (default is 21 periods). This allows customization based on the trader's time frame, whether short-term or long-term analysis.
Dynamic Moving Average Color:
The moving average line changes color based on the relationship between the price and the MA:
Green: Price is consistently above the MA (bullish condition).
Red: Price is consistently below the MA (bearish condition).
Blue: Price is crossing or close to the MA (neutral or indecisive condition).
Cumulative Days Above/Below MA:
The script tracks and displays the number of consecutive days the price remains above or below the moving average:
Cumulative Days Above: Shown as a green histogram above the zero line.
Cumulative Days Below: Shown as a red histogram below the zero line.
This feature helps users identify sustained trends or potential reversals.
Real-time Labels:
The script generates dynamic labels that display the count of cumulative days the price has stayed above or below the moving average.
These labels are positioned near the moving average on the chart, providing an easy reference for traders.
How Users Can Benefit:
Trend Identification:
By visually representing how long the price stays above or below a key moving average, traders can identify strong bullish or bearish trends. This can inform entry and exit points.
Visualizing Market Sentiment:
The colored moving average line and histogram help traders quickly assess market sentiment. A prolonged green MA line suggests a strong uptrend, while a prolonged red line indicates a downtrend.
Adaptability:
With customizable moving average types and lengths, the indicator can be tailored to fit various trading strategies, whether for day trading, swing trading, or long-term investing.
Reversal Signals:
A shift from cumulative days above to cumulative days below (or vice versa) can serve as an early signal of a potential market reversal, allowing traders to adjust their positions accordingly.
Simplified Decision-Making:
The combination of visual cues (colors, histograms, and labels) simplifies decision-making, allowing traders to focus on trend strength rather than complex calculations.
Usage:
To use this script:
Add the Indicator to Your Chart:
Select the desired moving average type and length.
The script will plot the moving average, colored by the trend, and display cumulative days above or below it.
Interpret the Signals:
Use the histogram and labels to gauge the strength of the trend.
Monitor color changes in the moving average for potential trend reversals.
Incorporate into Your Strategy:
Combine this indicator with other tools (e.g., volume analysis, RSI) to confirm signals and refine your trading strategy.
This indicator is particularly useful for traders who follow the "Landry Light" concept, emphasizing the importance of price staying above or below a moving average to determine trend strength.

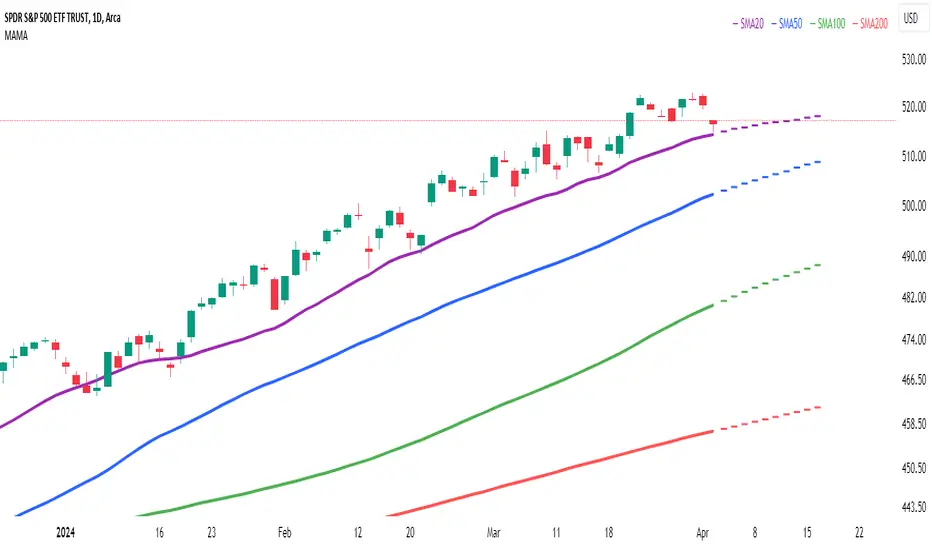
Multi Adaptive Moving Average (MAMA)The Multi Adaptive Moving Average (MAMA) indicator is an advanced tool for technical analysis, designed to provide traders with a detailed understanding of market trends and potential future price movements. This indicator utilizes multiple Simple Moving Averages (SMAs) and forecasting techniques to enhance decision-making processes.
Simple Moving Averages (SMAs):
Short MA (20-period): This moving average is highly responsive to price changes, making it ideal for capturing short-term trends. It helps traders identify quick market shifts and potential entry or exit points.
Mid MA (50-period): This average strikes a balance between short- and long-term trends, offering insights into the market's intermediate direction. It aids in confirming the sustainability of short-term trends.
Long MA (100-period): By smoothing out price data over a longer period, this moving average is useful for identifying long-term trends and filtering out short-term volatility.
Very Long MA (200-period): Often considered a critical indicator for determining the overall market trend, this average helps confirm the direction and strength of long-term movements.
Forecasting:
Flat Forecast: This approach assumes that prices will remain constant in the near future, which is particularly useful in markets trading sideways without a clear trend direction.
Linear Regression Forecast: This method uses historical data to project future price movements, offering a dynamic forecast based on existing trends. It helps traders anticipate potential price changes and plan their strategies accordingly.
Advantages:
Comprehensive Trend Analysis: By incorporating four different SMAs, the indicator provides a layered view of market trends across various timeframes. This enables traders to identify potential trend reversals and continuations with greater accuracy.
Predictive Insights: The forecasting feature offers traders a forward-looking perspective, enabling them to anticipate market movements and adjust their trading strategies proactively. This can be especially advantageous in volatile markets.
Customization: The MAMA indicator is highly customizable, allowing traders to adjust parameters such as the source of price data and the inclusion of the current unclosed candle. This flexibility ensures that the indicator can be tailored to fit different trading styles and market conditions.
Visual Clarity: The use of distinct colors for each SMA and their forecasts enhances visual interpretation, making it easier for traders to quickly assess market conditions and make informed decisions. The inclusion of a legend further aids in distinguishing between the different moving averages and their respective forecasts.
How to Use:
Trend Confirmation: Use the alignment of the SMAs to confirm market trends. For example, when the Short MA crosses above the Mid and Long MAs, it may indicate a bullish trend, while the opposite could suggest a bearish trend.
Entry and Exit Points: Look for crossovers between the SMAs as potential signals for entering or exiting trades. The forecasts can help in timing these decisions by providing an expectation of future price movements.
Risk Management: Utilize the Very Long MA to set stop-loss and take-profit levels, as it reflects the long-term trend and can help in avoiding trades against the prevailing market direction.
The MAMA indicator is intended to support technical analysis and should not be used as the sole basis for making trading decisions. Financial markets are inherently uncertain, and past performance does not guarantee future results. Traders should use this tool in conjunction with other analytical methods and consider their risk tolerance and investment objectives. It is advisable to conduct thorough research and consult with a financial advisor before making significant trading decisions. Always be aware of the risks involved in trading and invest only what you can afford to lose.
HMA Z-Score Probability Indicator by Erika BarkerThis indicator is a modified version of SteverSteves's original work, enhanced by Erika Barker. It visually represents asset price movements in terms of standard deviations from a Hull Moving Average (HMA), commonly known as a Z-Score.
Key Features:
Z-Score Calculation: Measures how many standard deviations the current price is from its HMA.
Hull Moving Average (HMA): This moving average provides a more responsive baseline for Z-Score calculations.
Flexible Display: Offers both area and candlestick visualization options for the Z-Score.
Probability Zones: Color-coded areas showing the statistical likelihood of prices based on their Z-Score.
Dynamic Price Level Labels: Displays actual price levels corresponding to Z-Score values.
Z-Table: An optional table showing the probability of occurrence for different Z-Score ranges.
Standard Deviation Lines: Horizontal lines at each standard deviation level for easy reference.
How It Works:
The indicator calculates the Z-Score by comparing the current price to its HMA and dividing by the standard deviation. This Z-Score is then plotted on a separate pane below the main chart.
Green areas/candles: Indicate prices above the HMA (positive Z-Score)
Red areas/candles: Indicate prices below the HMA (negative Z-Score)
Color-coded zones:
Green: Within 1 standard deviation (high probability)
Yellow: Between 1 and 2 standard deviations (medium probability)
Red: Beyond 2 standard deviations (low probability)
The HMA line (white) shows the trend of the Z-Score itself, offering insight into whether the asset is becoming more or less volatile over time.
Customization Options:
Adjust lookback periods for Z-Score and HMA calculations
Toggle between area and candlestick display
Show/hide probability fills, Z-Table, HMA line, and standard deviation bands
Customize text color and decimal rounding for price levels
Interpretation:
This indicator helps traders identify potential overbought or oversold conditions based on statistical probabilities. Extreme Z-Score values (beyond ±2 or ±3) often suggest a higher likelihood of mean reversion, while consistent Z-Scores in one direction may indicate a strong trend.
By combining the Z-Score with the HMA and probability zones, traders can gain a nuanced understanding of price movements relative to recent trends and their statistical significance.

Day, Week, or Hour Coloring
This is a simple Script that dynamically colors the chart bars based on the day of the week, week of the month, or hour of the day. Users can toggle between these three modes using the Color Mode input, allowing for flexible visual representation of time periods directly on the chart.
Key Features:
Color Modes:
Day Mode: Colors the bars according to the day of the week, with each day assigned a unique color.
Week Mode: Colors the bars based on the week of the month, providing a different color for each week.
Hour Mode: Colors the bars according to the hour of the day, with distinct colors assigned to each hour.
How It Works:
Day Mode:
The script assigns a unique color to each day of the week (e.g., Monday is red, Tuesday is green).
Week Mode:
The script calculates the week of the month by considering the first day of the month and adjusts the day count to determine the correct week.
Each week is assigned a specific color (e.g., Week 1 is red, Week 2 is green).
Hour Mode:
The script assigns a unique color to each hour of the day (e.g., 0:00 is blue, 1:00 is green).
Selected Color Application:
The script evaluates the selected Color Mode and applies the corresponding color to the bars on the chart using the barcolor() function.
This indicator is useful for traders who want to visually distinguish time periods on their charts, aiding in pattern recognition and time-based analysis.

5-9-20-100 Day EMAIndicator Name: "5-9-20-100 Day EMA"
Purpose: This indicator plots four key EMAs (5, 9, 20, and 100-day) on a daily chart, providing a clear visualization of both short-term and long-term trends. The EMAs serve as critical triggers for identifying potential entry and exit points based on price interactions with these moving averages.
Technical Details:
Version: Pine Script v5
EMAs Used:
5-Day EMA (Lime): Captures the most recent price trends, useful for identifying short-term momentum.
9-Day EMA (Yellow): Offers a slightly broader view, often used to confirm the short-term trend.
20-Day EMA (Orange): Represents a medium-term trend, commonly used as a signal for trend reversals.
100-Day EMA (Red): Indicates the long-term trend, often serving as strong support or resistance levels.
Trigger Points:
Crossovers: Price crossing above or below these EMAs can trigger potential buy or sell signals.
Convergence/Divergence: The interaction between the EMAs, such as a faster EMA crossing a slower one, can signal trend reversals or continuations.
Utility: This indicator is ideal for traders who rely on EMA crossovers and the relationship between different EMAs to make informed trading decisions.

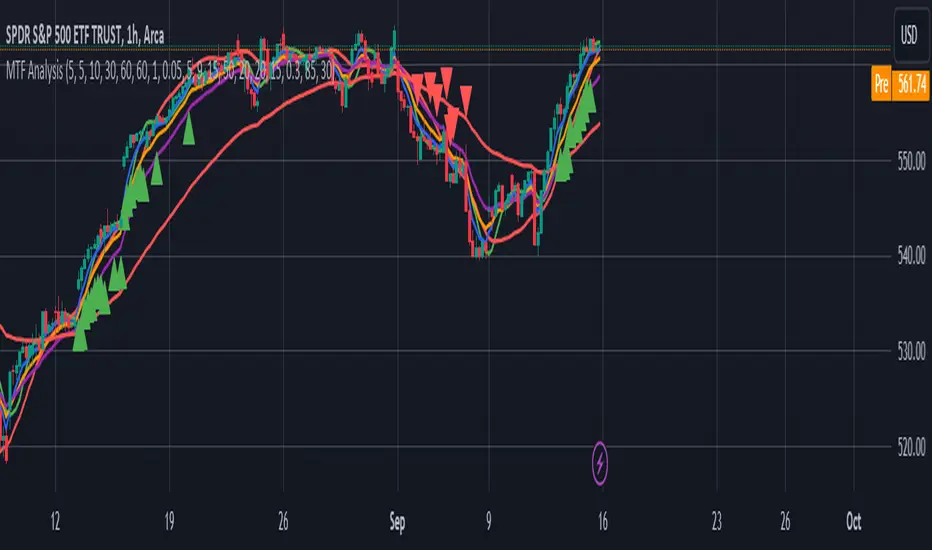
MTF AnalysisMTF Analysis - Multi-Timeframe TradingView Script
Overview: The "MTF Analysis" script provides a comprehensive approach to analyzing price trends across daily, weekly, and monthly timeframes using linear regression channels. It helps traders identify strong and weak bullish or bearish conditions based on the relationship between the current price and regression lines derived from multiple timeframes.
Key Features:
User-Defined Inputs:
Regression Lengths: Customize regression lengths for daily, weekly, and monthly timeframes.
Smoothing Length: Apply smoothing to regression lines.
Near-Zero Threshold: Filter out signals near a defined slope threshold for more refined analysis.
Daily Time Frame Filter: Optional filter to consider daily regression slope in signal generation.
Regression Line Calculation:
The script calculates linear regression lines for each timeframe (daily, weekly, monthly) and applies a smoothing function to refine the signals.
Signal Conditions:
Strong Bullish/Bearish: Signals generated when the price is consistently above/below weekly and monthly regression lines, with the option to apply the daily timeframe filter.
Weak Bullish/Bearish: Signals generated when the price is above/below the monthly regression line alone.
Visual Indicators:
The script plots regression lines on the chart with different colors for easy identification.
It also displays arrows on the chart to indicate strong or weak bullish/bearish signals.
Alerts:
Custom alerts for each signal condition help traders stay informed of potential trading opportunities.
This script is highly customizable, allowing traders to tailor it to their specific trading style and preferences.
This summary can be used to introduce the script to other traders or for publication on platforms like TradingView.
Market Internals: VolumeThe indicator plots the total volume of the NYSE and NASDAQ exchanges and identifies periods with significant asymmetry between Up Volume and Down Volume. It can be used as an additional tool to confirm broad market sentiment.
Chart shows Total Volume (TVOL) bars for SPY daily chart. Green bars for UVOL>>DVOL, Red for DVOL>>UVOL. Neutral bars are gray. Blue line shows median TVOL.
Rationale:
Up Volume (UVOL) and Down Volume (DVOL) represent the total volume of stocks that have increased or decreased in price, respectively, compared to the previous session's closing price. The magnitude of the price change is irrelevant.
When UVOL is significantly higher than DVOL, it indicates a prevailing buying sentiment in the broad market. Conversely, when DVOL is higher, it signals prevailing selling sentiment.
Occasionally, the UVOL/DVOL (VOLD) ratio may be misaligned with the movement of the S&P index. The picture below illustrates an example of a day when the S&P declined, yet the UVOL was twice larger than DVOL. Such a divergence can suggest that the S&P was pulled down by a decline in a few large-cap stocks, while the broader market remained positive. In this case, the divergence led to a continuation of the rally.
Thus, VOLD, when combined with volume analysis, can be an effective tool for confirming market trends.
Parameters:
VOLD Ratio – minimum ratio of UVOL/DVOL or DVOL/UVOL. Indicator will color code volume columns when condition is true (“green” means buying; “red” selling).
Median Length – number of periods to calculate median TVOL.
Show Divergencies – indicator marks divergencies between price and volume sentiments on the main chart. Only works for SPY chart.
Users can also choose which exchanges (NASDAQ/NYSE) to use for volume calculation.
Notes:
Volume is shown in millions of contracts
Indicator should be used on the daily or higher timeframes. It won't work properly on the intraday charts
Disclaimer
This indicator should not be used as a standalone tool to make trading decisions but only in conjunction with other technical analysis methods.

Yield Curve InversionThe Yield Curve Inversion indicator is a tool designed to help traders and analysts visualize and interpret the dynamics between the US 10-year and 2-year Treasury yields. This indicator is particularly useful for identifying yield curve inversions, often seen as a precursor to economic recessions.
Features and Interpretations
Display Modes: Choose between "Spread Mode" to visualize the yield spread indicating normal (green) or inverted (red) curves, or "Both Yields Mode" to view both yields.
Yield Spread: A plotted difference between 10-year and 2-year yields, with a zero line marking inversion. A negative spread suggests potential economic downturns.
Color Coding: Green for a normal yield curve (10Y > 2Y) and red for an inverted curve (2Y > 10Y).
Legend: Provides quick reference to yield curve states for easier interpretation.
This indicator is for educational and informational purposes only. It should not be considered financial advice or a recommendation to buy or sell any financial instruments. Users should conduct their own research and consult with a financial advisor before making investment decisions. The creator of this indicator is not responsible for any financial losses incurred through its use.

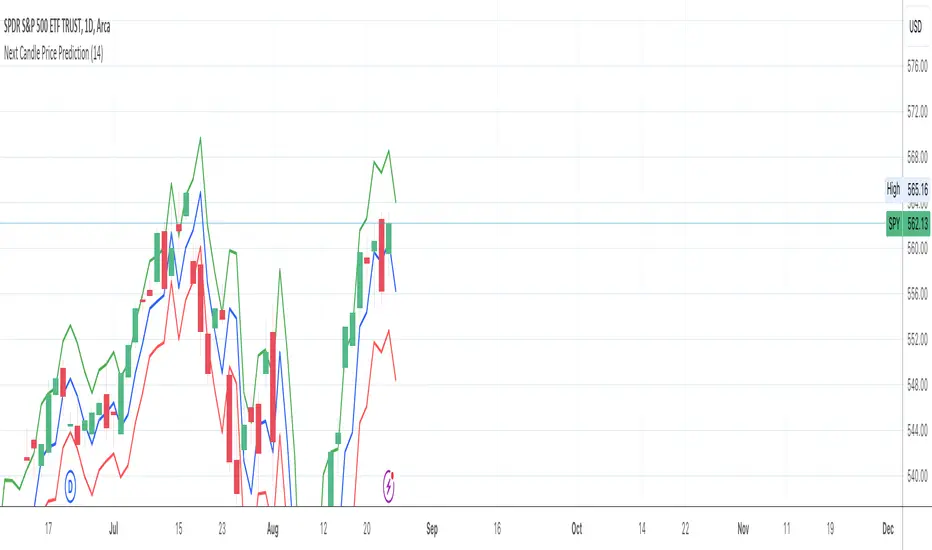
Next Candle Price Prediction FAJnext candle price prediction
Previous Day Data:
prevHigh, prevLow, and prevClose are calculated to capture the high, low, and close of the previous day. This is used to understand the previous day's price range and sentiment.
ATR Calculation:
The Average True Range (ATR) is a measure of volatility. We use it to estimate how much the price might move up or down from the previous close.
Predicted High and Low:
Using the previous close plus and minus the ATR value gives a range where the price might reach.
Predicted Target Price:
The script calculates a simple midpoint of the previous day's range to predict the target price for the next candle. This midpoint serves as a basic prediction, assuming price might oscillate within the previous day's range.
Plotting:
The script plots the predicted high, low, and target price as well as the previous day's high, low, and close for context.
Prometheus NFP LevelsThis script is a tool to mark the high and low of the most recent first Friday of the month. The significance of that day is that’s when the Bureau of Labor Statistics reports the Non Farm Payrolls (NFP) for the month prior. This number includes how many jobs were added that month, the unemployment rate, and labor force participation rate to name a few.
It is always on the first Friday of the new month, and markets tend to care about it quite a bit.
This script also allows a user to get the high and low of a specific date, the default date is the last Federal Open Market Committee day (FOMC). On this day the Federal Reserve announces the Federal Funds Interest Rate, as well as giving guidance on things like bond buying programs, to name a few.
Markets care about these days a lot, that is why we decided to make this script. Prometheus plans to update the default custom date with the most recent FOMC date as they come around.
Here we see the FOMC level high in blue, and low in yellow as well as the NFP high and low in green and red. The white boxes highlight areas where the market reacted to the levels.
On this chart we see a different asset still has interactions with the levels.
We chose to have the user input the date the way we did, not as a timestamp, for this code:
ts_start = timestamp(event_year, event_month, event_day, 9, 30)
ts_end = timestamp(event_year, event_month, event_day+1, 0, 0)
Adding one to the inputted date gives us a simple way to define the time range.
Prometheus encourages users to use indicators as tools along with their own discretion. No indicator is 100% accurate. We encourage comments about requested features and criticism.
