utilsLibrary "utils"
TODO: add library description here
method getType(this)
Namespace types: series int, simple int, input int, const int
Parameters:
this (int) : int 待检测对象
Returns: string 类型名称
method getType(this)
Namespace types: series float, simple float, input float, const float
Parameters:
this (float) : float 待检测对象
Returns: string 类型名称
method getType(this)
Namespace types: series color, simple color, input color, const color
Parameters:
this (color) : color 待检测对象
Returns: string 类型名称
method getType(this)
Namespace types: series string, simple string, input string, const string
Parameters:
this (string) : string 待检测对象
Returns: string 类型名称
method getType(this)
Namespace types: series bool, simple bool, input bool, const bool
Parameters:
this (bool) : bool 待检测对象
Returns: string 类型名称
Cari dalam skrip untuk "国泰黄金ETF联接C跟踪指数市盈率、跟踪指数市盈率百分位、指数估值水平"

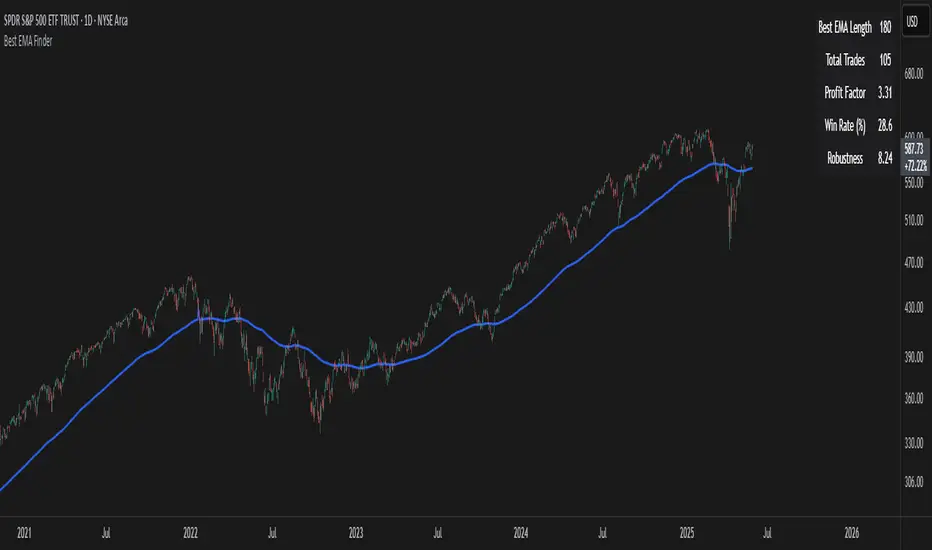
Best EMA FinderThis script, Best EMA Finder, is based on the same original logic as the Best SMA Finder I published previously. Although it was not the initial goal of the project, several users asked for an EMA version, so here it is.
The script scans a wide range of Exponential Moving Average (EMA) lengths, from 10 to 500, and identifies the one that historically delivered the most robust performance on the current chart. The choice to stop at 500 is deliberate: beyond that point, EMA curves tend to flatten and converge, adding processing time without meaningful differences in signals or outcomes.
Each EMA is evaluated using a custom robustness score:
Profit Factor × log(Number of Trades) × sqrt(Win Rate)
Only EMA lengths that exceed a user-defined minimum number of trades are considered valid. Among these, the one with the highest robustness score is selected and displayed on the chart.
A table summarizes the results:
- Best EMA length
- Total number of trades
- Profit Factor
- Win Rate
- Robustness Score
You can adjust:
- Strategy type: Long Only or Buy & Sell
- Minimum number of trades required
- Table visibility
This script is designed for analysis and optimization only. It does not execute trades or handle position sizing. Only one open trade per direction is considered at a time.
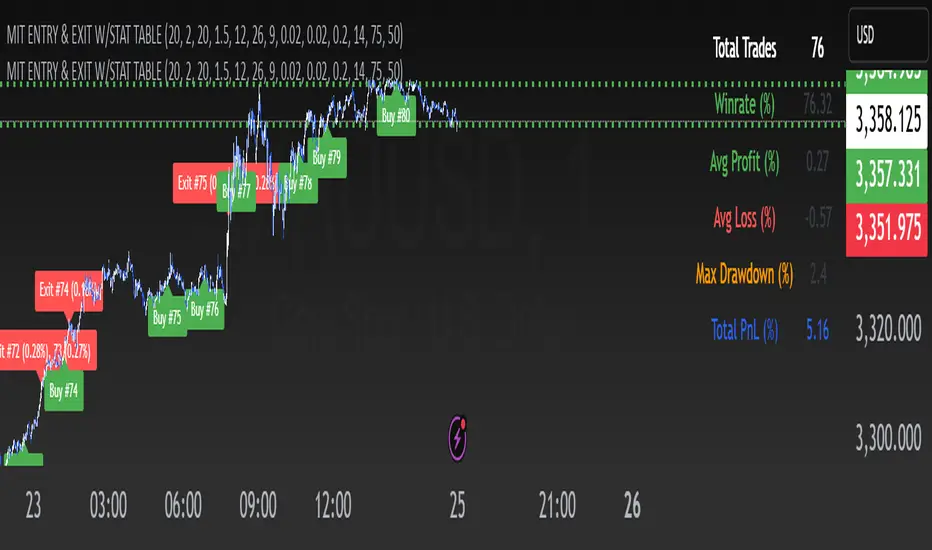
NY Opening Range Breakout - MA StopCore Concept
This strategy trades breakouts from the New York opening range (9:30-9:45 AM NY time) on intraday timeframes, designed for scalping and day trading.
Setup Requirements
Timeframe: Works on any timeframe under 15 minutes (1m, 2m, 3m, 5m, 10m)
Session: New York market hours
Range Period: 9:30-9:45 AM NY time (15-minute opening range)
Entry Rules
Long Entries:
Wait for a candle to close above the opening range high
Enter long on the next candle (before 12:00 PM NY time)
Must be above moving average if using MA-based take profit
Short Entries:
Wait for a candle to close below the opening range low
Enter short on the next candle (before 12:00 PM NY time)
Must be below moving average if using MA-based take profit
Risk Management
Stop Loss:
Long trades: Opening range low
Short trades: Opening range high
Take Profit Options:
Fixed Risk Reward: 1.5x the range size (customizable ratio)
Moving Average: Exit when price crosses back through MA
Both: Whichever comes first
Key Features
Trade Direction Options:
Long Only
Short Only
Both directions
Moving Average Filter:
Prevents entries that would immediately hit stop loss
Uses EMA/SMA/WMA/VWMA with customizable length
Acts as dynamic support/resistance
Time Restrictions:
No entries after 12:00 PM NY time (customizable cutoff)
One trade per direction per day
Daily reset of all variables
Visual Elements
Red/green lines showing opening range
Purple line for moving average
Entry and breakout signals with shapes
Take profit and stop loss levels plotted
Information table with current status
Strategy Logic Flow
Morning: Capture 9:30-9:45 range high/low
Wait: Monitor for breakout (previous candle close outside range)
Filter: Check MA condition if using MA-based exits
Enter: Trade on next candle after breakout
Manage: Exit at fixed TP, MA cross, or stop loss
Reset: Start fresh next trading day
This is a momentum-based breakout strategy that capitalizes on early market volatility while using the opening range as natural support/resistance levels.

TrueTrend MaxRThe TrueTrend MaxR indicator is designed to identify the most consistent exponential price trend over extended periods. It uses statistical analysis on log-transformed prices to find the trendline that best fits historical price action, and highlights the most frequently tested or traded level within that trend channel.
For optimal results, especially on high timeframes such as weekly or monthly, it is recommended to use this indicator on charts set to logarithmic scale. This ensures proper visual alignment with the exponential nature of long-term price movements.
How it works
The indicator tests 50 different lookback periods, ranging from 300 to 1280 bars. For each period, it:
- Applies a linear regression on the natural logarithm of the price
- Computes the slope and intercept of the trendline
- Calculates the unbiased standard deviation from the regression line
- Measures the correlation strength using Pearson's R coefficient
The period with the highest Pearson R value is selected, meaning the trendline drawn corresponds to the log-scale trend with the best statistical fit.
Trendline and deviation bands
Once the optimal period is identified, the indicator plots:
- A main log-scale trendline
- Upper and lower bands, based on a user-defined multiple of the standard deviation
These bands help visualize how far price deviates from its core trend, and define the range of typical fluctuations.
Point of Control (POC)
Inside the trend channel, the space between upper and lower bands is divided into 15 logarithmic levels. The script evaluates how often price has interacted with each level, using one of two selectable methods:
- Touches: Counts the number of candles crossing each level
- Volume: Weighs each touch by the traded volume at that candle
The level with the highest cumulative interaction is considered the dynamic Point of Control (POC), and is plotted as a line.
Annualized performance and confidence display
When used on daily or weekly timeframes, the script also calculates the annualized return (CAGR) based on the detected trend, and displays:
- A performance estimate in percentage terms
- A textual label describing the confidence level based on the Pearson R value
Why this indicator is useful
- Automatically detects the most statistically consistent exponential trendline
- Designed for log-scale analysis, suited to long-term investment charts
- Highlights key price levels frequently visited or traded within the trend
- Provides objective, data-based trend and volatility insights
- Displays annualized growth rate and correlation strength for quick evaluation
Notes
- All calculations are performed only on the last bar
- No future data is used, and the script does not repaint
- Works on any instrument or timeframe, with optimal use on higher timeframes and logarithmic scaling

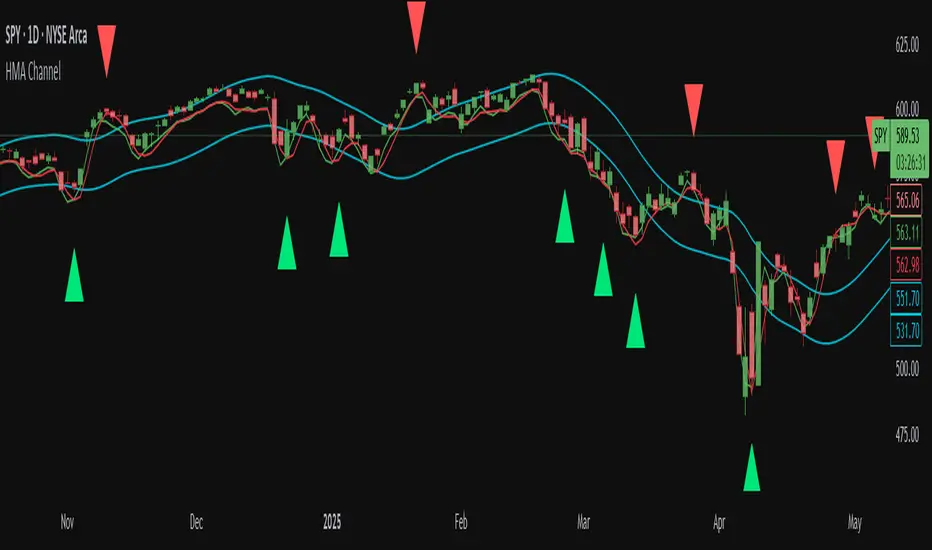
Hull MA Channel with Filtered CrossoversI've created an indicator that let's you create a HMA channel with 2 displaced HMA (A/B). As well as a HMA crossover set (C/D).
Here's how it works:
The HMA crossovers from C and D will not signal unless they are outside of the channel of A and B. As a matter of fact, NO buy signal whatsoever will occur above the channel and NO sell signal will occur below the channel.
The crossover HMA pair (C/D) can have their lengths adjusted to the 0.00 decimal point for VERY fine tuning of the crossovers.
(edit-it doesn't fine tune to the .00. This must not be a feature that is able to be utilized. I tried) The length adjustment still works to the nearest whole number. The .00 are mute :(
In keeping with that same logic, you can adjust the displacement of the channel independently to the 0.00 decimal, again for VERY fine tuning.
This is great for reversals while eliminating noise from false signals, keeping the chart nice and clean. Should be used in combination with other indicators for the best confirmations.
EMA 9/21 Cross + Volume FilterThis indicator plots fast (9-period) and slow (21-period) EMAs and highlights bullish or bearish crossovers only when volume exceeds its 20-period average, filtering out low-participation whipsaws. It places “UP”/“DN” triangles on qualifying crosses and includes built-in alertcondition() triggers plus a single alert() call, so one “Any alert() function call” alert delivers real-time push, e-mail, or webhook notifications. Adjustable inputs: EMA lengths, volume-SMA length, and a toggle to show/hide signal labels. Ideal for trend-following scalps or swing entries on any timeframe and ticker.

5 DMA (Close Above) Buy5 DMA (Close Above) Buy
This indicator identifies momentum-based breakout signals when a green candle closes above the 5-day Simple Moving Average (5DMA) for the first time after price was previously below it.
🔹 Signal Logic:
The script plots a green arrow below the candle when a bullish candle (close > open) closes above the 5DMA
Signals are only shown once per trend leg
The signal resets only after price closes back below the 5DMA
🔔 Built-in Alerts:
Use the included alert condition: "Buy Alert" to be notified in real time whenever a valid signal occurs.
This tool is ideal for traders seeking simple price-action confirmations to catch early trend continuation after pullbacks.
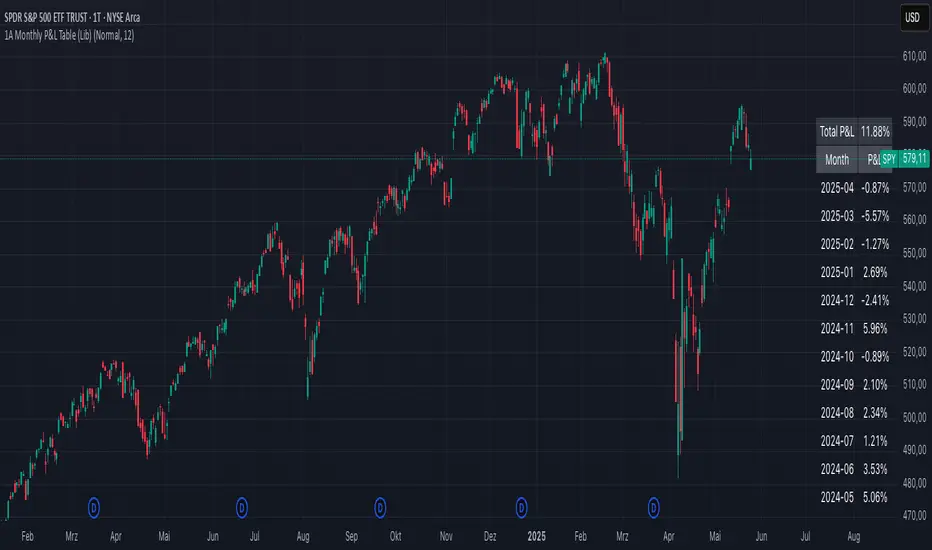
1A Monthly P&L Table - Using Library1A Monthly P&L Table: Track Your Performance Month-by-Month
Overview:
The 1A Monthly P&L Table is a straightforward yet powerful indicator designed to give you an immediate overview of your asset's (or strategy's) percentage performance on a monthly basis. Displayed conveniently in the bottom-right corner of your chart, this tool helps you quickly assess historical gains and losses, making it easier to analyze trends in performance over time.
Key Features:
Monthly Performance at a Glance: Clearly see the percentage change for each past month.
Cumulative P&L: A running total of the displayed monthly P&L is provided, giving you a quick sum of performance over the selected period.
Customizable Display:
Months to Display: Choose how many past months you want to see in the table (from 1 to 60 months).
Text Size: Adjust the text size (Tiny, Small, Normal, Large, Huge) to fit your viewing preferences.
Text Color: Customize the color of the text for better visibility against your chart background.
Intraday & Daily Compatibility: The table is optimized to display on daily and intraday timeframes, ensuring it's relevant for various trading styles. (Note: For very long-term analysis on weekly/monthly charts, you might consider other tools, as this focuses on granular monthly P&L.)
How It Works:
The indicator calculates the percentage change from the close of the previous month to the close of the current month. For the very first month displayed, it calculates the P&L from the opening price of the chart's first bar to the close of that month. This data is then neatly organized into a table, updated on the last bar of the day or session.
Ideal For:
Traders and investors who want a quick, visual summary of monthly performance.
Analyzing seasonal trends or consistent periods of profitability/drawdown.
Supplementing backtesting results with a clear month-by-month breakdown.
Settings:
Text Color: Changes the color of all text within the table.
Text Size: Controls the font size of the table content.
Months to Display: Determines the number of recent months included in the table.
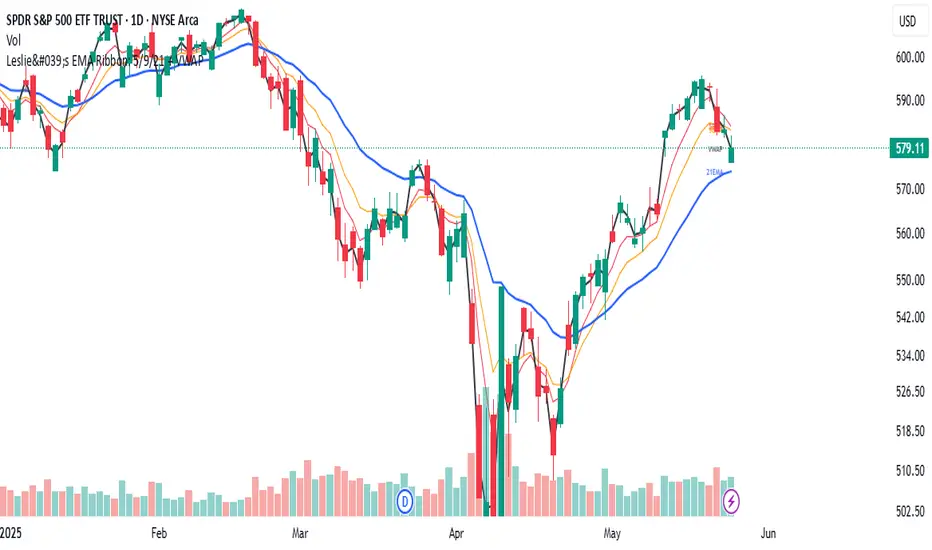
Leslie's EMA Ribbon: 5/9/21 + VWAPEMA + VWAP Crossover Indicator with Alerts
This script blends three Exponential Moving Averages (5, 9, 21) with VWAP to identify momentum shifts and volume-confirmed trend signals. It’s optimized for the Daily timeframe, but also adaptable to shorter-term trading.
🔍 Why this combination?
EMAs provide fast and reliable trend signals:
- 5/9 EMA crossover → short-term shifts (more frequent)
- 9/21 EMA crossover → swing confirmation (less noise)
- VWAP adds volume context used by institutions for fair value tracking.
- 9EMA crossing VWAP confirms price action supported by volume.
Together, these tools offer a multi-layered view of market momentum — combining speed, confirmation, and conviction.
⚙️ Features:
Clean plots with dynamic labels on latest bar
Adjustable line weights for clarity
Alerts included for all crossovers:
- 5EMA / 9EMA
- 9EMA / 21EMA
- 9EMA / VWAP
✅ How to Use:
- Best on the Daily timeframe
- Use 5/9 as early signals, 9/21 for trend filtering, and 9/VWAP for volume-backed setups
- Turn on alerts to stay informed of key shifts without staring at charts
VWAP & Breakout Volume ConfirmHow the TradingView Indicator Works (Explained Simply)
VWAP Line (Orange)
It plots the Volume Weighted Average Price for the day.
Price above VWAP = bullish zone
Price below VWAP = bearish zone
Volume Spike Detection (Red Triangle)
It calculates the average volume over the last 20 candles.
If the current volume is 1.5× that average, it plots a red triangle under the candle.
Helps confirm if a move has real momentum or not.
Breakout Confirmation (Green Label ‘BO’)
Checks if price breaks above the last 10-bar high (for upside breakout) or below the last 10-bar low (for downside breakout).
If a breakout happens and the volume spike is present, it plots a green “BO” label above the candle.
This tells you the breakout is strong and likely to follow through.

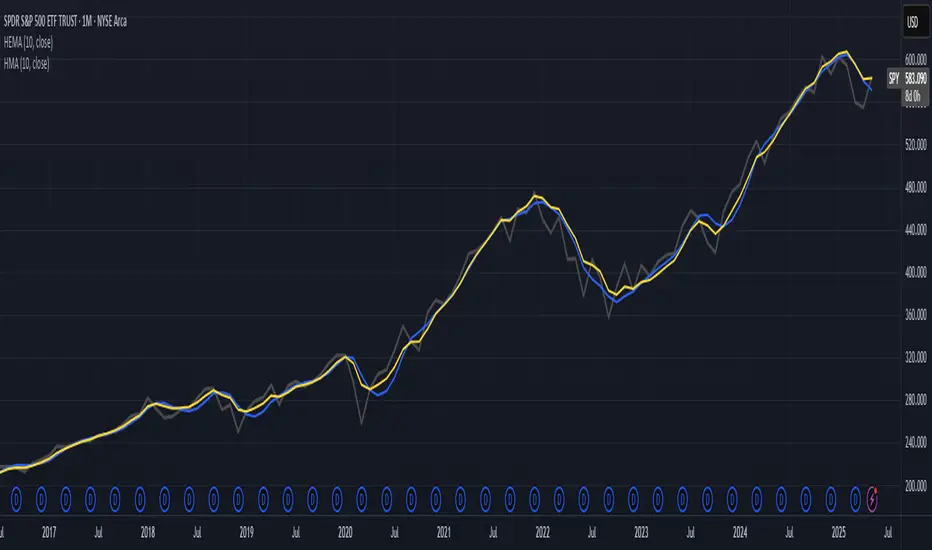
Hull-Exponential Moving Average (HEMA)The Hull Exponential Moving Average (HEMA) is an experimental technical indicator that uses a sequence of Exponential Moving Averages (EMAs) with the same logic as HMA - except with EMAs and not WMAs. It aims to create a responsive yet smooth trend indicator than HMA.
HEMA applies a multi-stage EMA process. Initial EMAs are calculated using alphas derived from logarithmic relationships and the input period. Their outputs are then combined in a de-lagging step, which itself uses a logarithmically derived ratio. A final EMA smoothing pass is then applied to this de-lagged series. This creates a moving average that responds quickly to genuine price changes while maintaining effective noise filtering. The specific alpha calculations and the de-lagging formula contribute to its balance between responsiveness and smoothness.
▶️ **Core Concepts**
Logarithmically-derived alphas: Alpha values for the three EMA stages are derived using natural logarithms and specific formulas related to the input period **N**.
Three-stage EMA process: The calculation involves:
An initial EMA (using **αS**) on the source data.
A second EMA (using **αF**) also on the source data.
A de-lagging step that combines the outputs of the first two EMAs using a specific ratio **r**.
A final EMA (using **αFin**) applied to the de-lagged series.
Specific de-lagging formula: Utilizes a constant ratio **r = ln(2.0) / (1.0 + ln(2.0))** to combine the outputs of the first two EMAs, aiming to reduce lag.
Optimized final smoothing: The alpha for the final EMA (**αFin**) is calculated based on the square root of the period **N**.
Warmup compensation: The internal EMA calculations include a warmup mechanism to provide more accurate values from the initial bars. This involves tracking decay factors (**eS**, **eF**, **eFin**) and applying a compensation factor **1.0 / (1.0 - e_decay)** during the warmup period. A shared warmup duration is determined by the smallest alpha among the three stages.
HEMA achieves its characteristics through this multi-stage EMA process, where the specific alpha calculations and the de-lagging step are key to its responsiveness and smoothness.
▶️ **Common Settings and Parameters**
Period (**N**): Default: 10 | Base lookback period for all alpha calculations | When to Adjust: Increase for longer-term trends and more smoothness, decrease for shorter-term signals and more responsiveness
Source: Default: Close | Data point used for calculation | When to Adjust: Change to HL2, HLC3, or OHLC4 for different price representations
Pro Tip: The HEMA's behavior is sensitive to the **Period** setting due to the non-linear relationships in its alpha calculations. Experiment with values around your typical MA periods. Small changes in **N** can have a noticeable impact, especially for smaller **N** values.
▶️ **Calculation and Mathematical Foundation**
Simplified explanation:
HEMA calculates its value through a sequence of three Exponential Moving Averages (EMAs) with specially derived smoothing factors (alphas).
Two initial EMAs are calculated from the source price, using alphas **αS** and **αF**.
The outputs of these two EMAs are combined into a "de-lagged" series.
This de-lagged series is then smoothed by a third EMA, using alpha **αFin**, to produce the final HEMA value.
All internal EMAs use a warmup compensation mechanism for improved accuracy on early bars.
Technical formula (let **N** be the input period):
1. Alpha for the first EMA (slow component related):
αS = 3.0 / (2.0 * N - 1.0)
2. Lambda for **αS** (intermediate value):
λS = -ln(1.0 - αS)
Note: **αS** must be less than 1, which implies 2N-1 > 3 or N > 2 for **λS** to be well-defined without NaN from ln of non-positive number. The code uses nz() for robustness but the formula implies this constraint.
3. De-lagging ratio **r**:
r = ln(2.0) / (1.0 + ln(2.0))
(This is a constant, approximately 0.409365)
4. Alpha for the second EMA (fast component related):
αF = 1.0 - exp(-λS / r)
5. Alpha for the final EMA smoothing:
αFin = 2.0 / (sqrt(N) / 2.0 + 1.0)
6. Applying the stages:
**OutputS = EMA_internal(source, αS, eS_state, emaS_state)**
**OutputF = EMA_internal(source, αF, eF_state, emaF_state)**
8. Calculate the de-lagged series:
DeLag = (OutputF / (1.0 - r)) - (r * OutputS / (1.0 - r))
9. Calculate the final HEMA:
HEMA = EMA_internal(DeLag, αFin, eFin_state, emaFin_state)
🔍 Technical Note: The HEMA implementation uses a shared warmup period controlled by **aMin** (the minimum of **αS**, **αF**, **αFin**). During this period, each internal EMA stage still tracks its own decay factor (**eS**, **eF**, **eFin**) to apply the correct compensation. The **nz()** function is used in the code to handle potential NaN values from alpha calculations if **N** is very small (e.g., **N=1** would make **αS=3**, **1-αS = -2**, **ln(-2)** is NaN).
▶️ **Interpretation Details**
HEMA provides several key insights for traders:
When price crosses above HEMA, it often signals the beginning of an uptrend
When price crosses below HEMA, it often signals the beginning of a downtrend
The slope of HEMA provides insight into trend strength and momentum
HEMA creates smooth dynamic support and resistance levels during trends
Multiple HEMA lines with different periods can identify potential reversal zones
HEMA is particularly effective for trend following strategies where both responsiveness and noise reduction are important. It provides earlier signals than traditional EMAs while exhibiting less whipsaw than standard HMA in choppy market conditions. The indicator excels at identifying the underlying trend direction while filtering out minor price fluctuations.
▶️ **Limitations and Considerations**
Experimental nature: As an experimental indicator, HEMA may behave differently from established HMA in certain market conditions
Lag characteristics: While designed to reduce lag, HEMA may exhibit slightly more lag than HMA in some scenarios due to the long tail of EMA
Mathematical complexity: The multi-stage calculation with specialized alpha parameters makes the behavior less intuitive to understand
Parameter sensitivity: Performance can vary significantly with different period settings
Complementary tools: Works best when combined with volume analysis or momentum indicators for confirmation
▶️ **References**
Hull, A. (2005). "Hull Moving Average," Technical Analysis of Stocks & Commodities .
RetryClaude can make mistakes. Please double-check responses.
RSI Divergences (Regular, Hidden, Exaggerated)RSI Divergences (Regular, Hidden, Exaggerated)
This indicator detects and visually highlights all major types of RSI divergences on your chart: Regular, Hidden, and Exaggerated divergences, both bullish and bearish.
Key Features:
Calculates RSI based on a user-defined length and timeframe that automatically matches your chart's timeframe.
Identifies pivot highs and lows on both price and RSI using customizable pivot left/right bars.
Detects divergences when RSI and price movements disagree, signaling potential trend reversals or continuation.
Differentiates between three types of divergences:
Regular Divergence: Classic signal for possible trend reversal.
Hidden Divergence: Often indicates trend continuation.
Exaggerated Divergence: A less common form signaling momentum changes.
Draws clear colored lines and labels on the RSI pane for each divergence, using green for bullish and red for bearish signals.
Includes RSI overbought (70) and oversold (30) bands with gradient fills to help visualize RSI zones.
Efficient use of arrays to track pivots and manage plotting history for smooth performance.
Usage:
Ideal for traders looking to leverage RSI divergences for better timing entries and exits in trending and range-bound markets. The script is fully customizable and works seamlessly across different timeframes

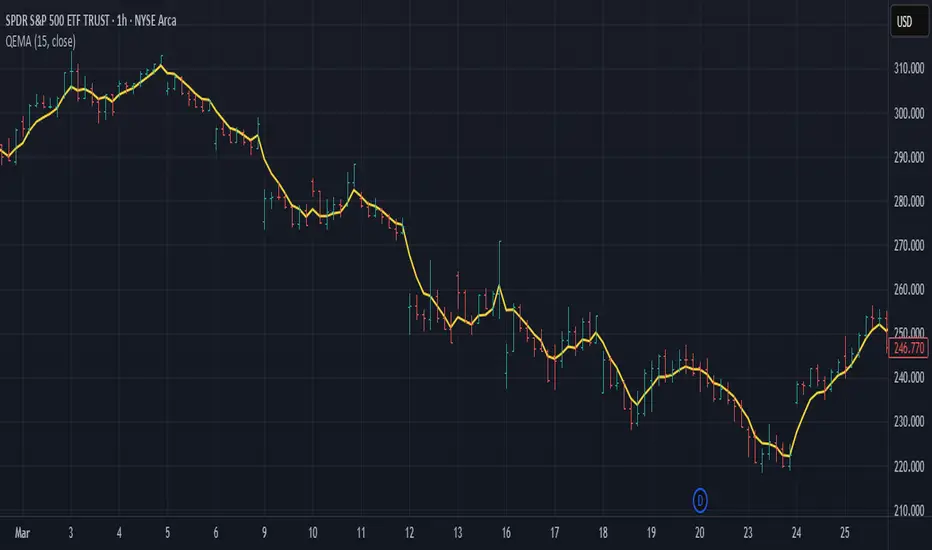
Quadruple EMA (QEMA)The Quadruple Exponential Moving Average (QEMA) is an advanced technical indicator that extends the concept of lag reduction beyond TEMA (Triple Exponential Moving Average) to a fourth order. By applying a sophisticated four-stage EMA cascade with optimized coefficient distribution, QEMA provides the ultimate evolution in EMA-based lag reduction techniques.
Unlike traditional compund moving averages like DEMA and TEMA, QEMA implements a progressive smoothing system that strategically distributes alphas across four EMA stages and combines them with balanced coefficients (4, -6, 4, -1). This approach creates an indicator that responds extremely quickly to price changes while still maintaining sufficient smoothness to be useful for trading decisions. QEMA is particularly valuable for traders who need the absolute minimum lag possible in trend identification.
▶️ **Core Concepts**
Fourth-order processing: Extends the EMA cascade to four stages for maximum possible lag reduction while maintaining a useful signal
Progressive alpha system: Uses mathematically derived ratio-based alpha progression to balance responsiveness across all four EMA stages
Optimized coefficients: Employs calculated weights (4, -6, 4, -1) to effectively eliminate lag while preserving compound signal stability
Numerical stability control: Implements initialization and alpha distribution to ensure consistent results from the first calculation bar
QEMA achieves its exceptional lag reduction by combining four progressive EMAs with mathematically optimized coefficients. The formula is designed to maximize responsiveness while minimizing the overshoot problems that typically occur with aggressive lag reduction techniques. The implementation uses a ratio-based alpha progression that ensures each EMA stage contributes appropriately to the final result.
▶️ **Common Settings and Parameters**
Period: Default: 15| Base smoothing period | When to Adjust: Decrease for extremely fast signals, increase for more stable output
Alpha: Default: auto | Direct control of base smoothing factor | When to Adjust: Manual setting allows precise tuning beyond standard period settings
Source: Default: Close | Data point used for calculation | When to Adjust: Change to HL2 or HLC3 for more balanced price representation
Pro Tip: Professional traders often use QEMA with longer periods than other moving averages (e.g., QEMA(20) instead of EMA(10)) since its extreme lag reduction provides earlier signals even with longer periods.
▶️ **Calculation and Mathematical Foundation**
Simplified explanation:
QEMA works by calculating four EMAs in sequence, with each EMA taking the previous one as input. It then combines these EMAs using balancing weights (4, -6, 4, -1) to create a moving average with extremely minimal lag and high level of smoothness. The alpha factors for each EMA are progressively adjusted using a mathematical ratio to ensure balanced responsiveness across all stages.
Technical formula:
QEMA = 4 × EMA₁ - 6 × EMA₂ + 4 × EMA₃ - EMA₄
Where:
EMA₁ = EMA(source, α₁)
EMA₂ = EMA(EMA₁, α₂)
EMA₃ = EMA(EMA₂, α₃)
EMA₄ = EMA(EMA₃, α₄)
α₁ = 2/(period + 1) is the base smoothing factor
r = (1/α₁)^(1/3) is the derived ratio
α₂ = α₁ × r, α₃ = α₂ × r, α₄ = α₃ × r are the progressive alphas
Mathematical Rationale for the Alpha Cascade:
The QEMA indicator employs a specific geometric progression for its smoothing factors (alphas) across the four EMA stages. This design is intentional and aims to optimize the filter's performance. The ratio between alphas is **r = (1/α₁)^(1/3)** - derived from the cube root of the reciprocal of the base alpha.
For typical smoothing (α₁ < 1), this results in a sequence of increasing alpha values (α₁ < α₂ < α₃ < α₄), meaning that subsequent EMAs in the cascade are progressively faster (less smoothed). This specific progression, when combined with the QEMA coefficients (4, -6, 4, -1), is chosen for the following reasons:
1. Optimized Frequency Response:
Using the same alpha for all EMA stages (as in a naive multi-EMA approach) can lead to an uneven frequency response, potentially causing over-shooting of certain frequencies or creating undesirable resonance. The geometric progression of alphas in QEMA helps to create a more balanced and controlled filter response across a wider range of movement frequencies. Each stage's contribution to the overall filtering characteristic is more harmonized.
2. Minimized Phase Lag:
A key goal of QEMA is extreme lag reduction. The specific alpha cascade, particularly the relationship defined by **r**, is designed to minimize the cumulative phase lag introduced by the four smoothing stages, while still providing effective noise reduction. Faster subsequent EMAs contribute to this reduced lag.
🔍 Technical Note: The ratio-based alpha progression is crucial for balanced response. The ratio r is calculated as the cube root of 1/α₁, ensuring that the combined effect of all four EMAs creates a mathematically optimal response curve. All EMAs are initialized with the first source value rather than using progressive initialization, eliminating warm-up artifacts and providing consistent results from the first bar.
▶️ **Interpretation Details**
QEMA provides several key insights for traders:
When price crosses above QEMA, it signals the beginning of an uptrend with minimal delay
When price crosses below QEMA, it signals the beginning of a downtrend with minimal delay
The slope of QEMA provides immediate insight into trend direction and momentum
QEMA responds to price reversals significantly faster than other moving averages
Multiple QEMA lines with different periods can identify immediate support/resistance levels
QEMA is particularly valuable in fast-moving markets and for short-term trading strategies where speed of signal generation is critical. It excels at capturing the very beginning of trends and identifying reversals earlier than any other EMA-derived indicator. This makes it especially useful for breakout trading and scalping strategies where getting in early is essential.
▶️ **Limitations and Considerations**
Market conditions: Can generate excessive signals in choppy, sideways markets due to its extreme responsiveness
Overshooting: The aggressive lag reduction can create some overshooting during sharp reversals
Calculation complexity: Requires four separate EMA calculations plus coefficient application, making it computationally more intensive
Parameter sensitivity: Small changes in the base alpha or period can significantly alter behavior
Complementary tools: Should be used with momentum indicators or volatility filters to confirm signals and reduce false positives
▶️ **References**
Mulloy, P. (1994). "Smoothing Data with Less Lag," Technical Analysis of Stocks & Commodities .
Ehlers, J. (2001). Rocket Science for Traders . John Wiley & Sons.
Full Day Midpoint Line with Dynamic StdDev Bands (ETH & RTH)A Pine Script indicator designed to plot a midpoint line based on the high and low prices of a user-defined trading session (typically Extended Trading Hours, ETH) and to add dynamic standard deviation (StdDev) bands around this midpoint.
Session Midpoint Line:
The midpoint is calculated as the average of the session's highest high and lowest low during the defined ETH period (e.g., 4:00 AM to 8:00 PM).
This line represents a central tendency or "fair value" for the session, similar to a pivot point or volume-weighted average price (VWAP) anchor.
Interpretation:
Prices above the midpoint suggest bullish sentiment, while prices below indicate bearish sentiment.
The midpoint can act as a dynamic support/resistance level, where price may revert to or react at this level during the session.
Dynamic StdDev Bands:
The bands are calculated by adding/subtracting a multiple of the standard deviation of the midpoint values (tracked in an array) from the midpoint.
The standard deviation is dynamically computed based on the historical midpoint values within the session, making the bands adaptive to volatility.
Interpretation:
The upper and lower bands represent potential overbought (upper) and oversold (lower) zones.
Prices approaching or crossing the bands may indicate stretched conditions, potentially signaling reversals or breakouts.
Trend Identification:
Use the midpoint as a reference for the session’s trend. Persistent price action above the midpoint suggests bullishness, while below indicates bearishness.
Combine with other indicators (e.g., moving averages, RSI) to confirm trend direction.
Support/Resistance Trading:
Treat the midpoint as a dynamic pivot point. Price rejections or consolidations near the midpoint can be entry points for mean-reversion trades.
The StdDev bands can act as secondary support/resistance levels. For example, price reaching the upper band may signal a potential short entry if accompanied by reversal signals.
Breakout/Breakdown Strategies:
A strong move beyond the upper or lower band may indicate a breakout (bullish above upper, bearish below lower). Confirm with volume or momentum indicators to avoid false breakouts.
The dynamic nature of the bands makes them useful for identifying significant price extensions.
Volatility Assessment:
Wider bands indicate higher volatility, suggesting larger price swings and potentially riskier trades.
Narrow bands suggest consolidation, which may precede a breakout. Traders can prepare for volatility expansions in such scenarios.
The "Full Day Midpoint Line with Dynamic StdDev Bands" is a versatile and visually intuitive indicator well-suited for day traders focusing on session-specific price action. Its dynamic midpoint and volatility-adjusted bands provide valuable insights into support, resistance, and potential reversals or breakouts.

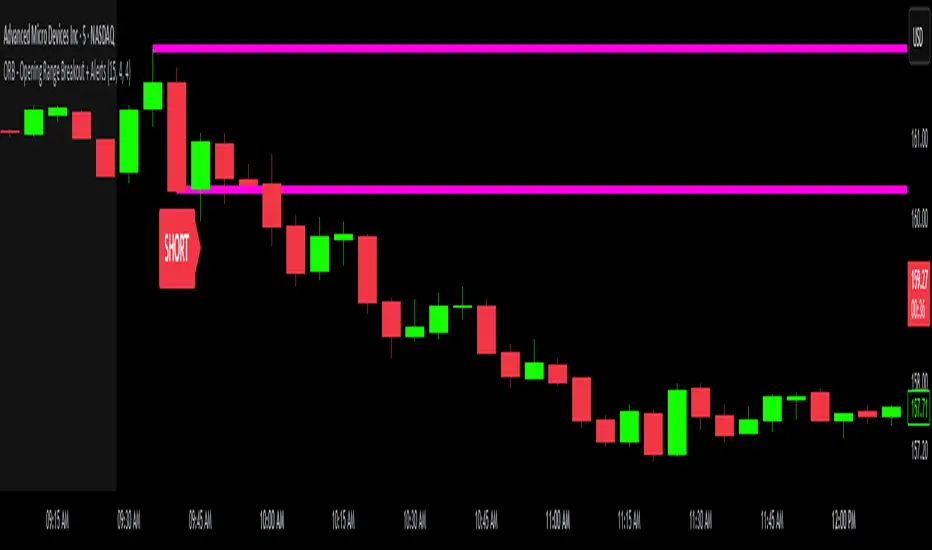
ORB - Opening Range Breakout + AlertsThe only ORB indicator you'll ever need.
- Flexible Range: Tailor the opening range (e.g., 5m, 15m, 30m) to your trading style.
- Key Levels: Auto-plots striking pink/purple support/resistance lines post-range for clear trade setups.
- Breakout Alerts: Reliable LONG/SHORT signals on 5m chart for confirmed breakouts; enable/disable as needed.
- Personalized Design: Customize line color and thickness for optimal visibility.
A friendly reminder that no tool or indicator guarantees success. Integrate this into a robust trading plan.
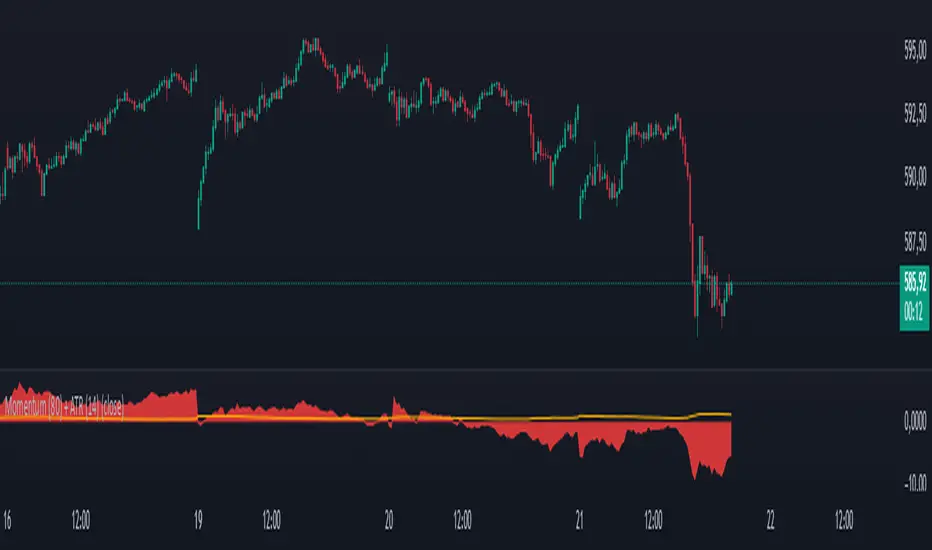
Momentum (80) + ATR (14)his indicator combines two essential technical analysis tools in a single panel for enhanced market insight:
🔹 Momentum (80 periods): Measures the difference between the current price and the price 80 bars ago. Displayed as a semi-transparent filled area, it helps to visually identify shifts in price momentum over a longer timeframe.
🔸 ATR (Average True Range, 14 periods): Shown as a fine orange line, the ATR represents average market volatility over 14 periods, highlighting phases of calm or increased price fluctuations.
By viewing both momentum and volatility simultaneously, traders can better assess trend strength and market conditions, improving decision-making across assets such as stocks, forex, and cryptocurrencies.
✅ Suitable for all asset types
✅ Complements other indicators like RSI, MACD, and Bollinger Bands
✅ Categorized under Momentum & Volatility indicators
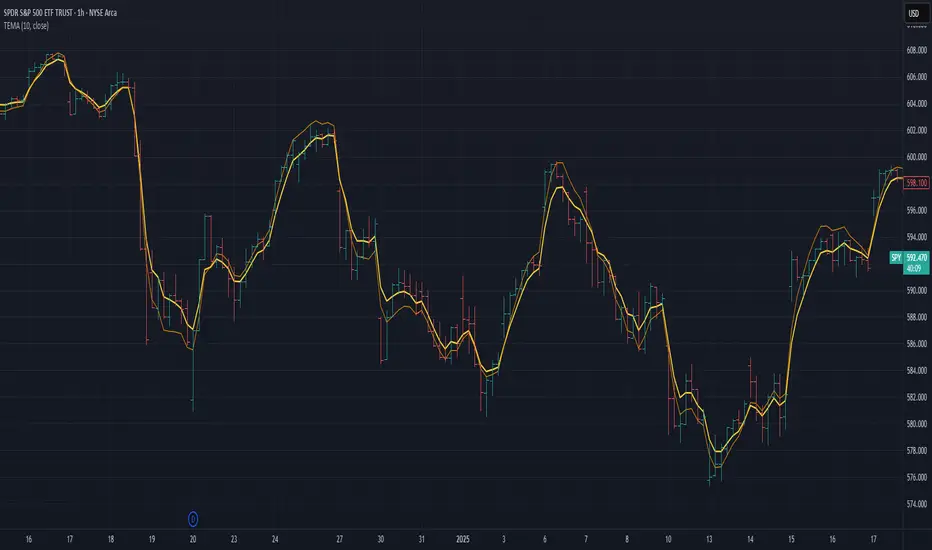
Triple Exponential Moving Average (TEMA)The Triple Exponential Moving Average (TEMA) is an advanced technical indicator designed to significantly reduce the lag inherent in traditional moving averages while maintaining signal quality. Developed by Patrick Mulloy in 1994 as an extension of his DEMA concept, TEMA employs a sophisticated triple-stage calculation process to provide exceptionally responsive market signals.
TEMA's mathematical approach goes beyond standard smoothing techniques by using a triple-cascade architecture with optimized coefficients. This makes it particularly valuable for traders who need earlier identification of trend changes without sacrificing reliability. Since its introduction, TEMA has become a key component in many algorithmic trading systems and professional trading platforms.
▶️ **Core Concepts**
Triple-stage lag reduction: TEMA uses a three-level EMA calculation with optimized coefficients (3, -3, 1) to dramatically minimize the delay in signal generation
Enhanced responsiveness: Provides significantly faster reaction to price changes than standard EMA or even DEMA, while maintaining reasonable smoothness
Strategic signal processing: Employs mathematical techniques to extract the underlying trend while filtering random price fluctuations
Timeframe effectiveness: Performs well across multiple timeframes, though particularly valued in short to medium-term trading
TEMA achieves its enhanced responsiveness through an innovative triple-cascade architecture that strategically combines three levels of exponential moving averages. This approach effectively removes the lag component inherent in EMA calculations while preserving the essential smoothing benefits.
▶️ **Common Settings and Parameters**
Length: Default: 12 | Controls sensitivity/smoothness | When to Adjust: Increase in choppy markets, decrease in strongly trending markets
Source: Default: Close | Data point used for calculation | When to Adjust: Change to HL2/HLC3 for more balanced price representation
Corrected: Default: false | Adjusts internal EMA smoothing factors for potentially faster response | When to Adjust: Set to true for a modified TEMA that may react quicker to price changes. false uses standard TEMA calculation
Visualization: Default: Line | Display format on charts | When to Adjust: Use filled cloud to see divergence from price more clearly
Pro Tip: For optimal trade signals, many professional traders use two TEMAs (e.g., 8 and 21 periods) and look for crossovers, which often provide earlier signals than traditional moving average pairs.
▶️ **Calculation and Mathematical Foundation**
Simplified explanation:
TEMA calculates three levels of EMAs, then combines them using a special formula that amplifies recent price action while reducing lag. This triple-processing approach effectively eliminates much of the delay found in traditional moving averages.
Technical formula:
TEMA = 3 × EMA₁ - 3 × EMA₂ + EMA₃
Where:
EMA₁ = EMA(source, α₁)
EMA₂ = EMA(EMA₁, α₂)
EMA₃ = EMA(EMA₂, α₃)
The smoothing factors (α₁, α₂, α₃) are determined as follows:
Let α_base = 2/(length + 1)
α₁ = α_base
If corrected is false:
α₂ = α_base
α₃ = α_base
If corrected is true:
Let r = (1/α_base)^(1/3)
α₂ = α_base * r
α₃ = α_base * r * r = α_base * r²
The corrected = true option implements a variation that uses progressively smaller alpha values for the subsequent EMA calculations. This approach aims to optimize the filter's frequency response and phase lag.
Alpha Calculation for corrected = true:
α₁ (alpha_base) = 2/(length + 1)
r = (1/α₁)^(1/3) (cube root relationship)
α₂ = α₁ * r = α₁^(2/3)
α₃ = α₂ * r = α₁^(1/3)
Mathematical Rationale for Corrected Alphas:
1. Frequency Response Balance:
The standard TEMA (where α₁ = α₂ = α₃) can lead to an uneven frequency response, potentially over-smoothing high frequencies or creating resonance artifacts. The geometric progression of alphas (α₁ > α₁^(2/3) > α₁^(1/3)) in the corrected version aims to create a more balanced filter cascade. Each stage contributes more proportionally to the overall frequency response.
2. Phase Lag Optimization:
The cube root relationship between the alphas is designed to minimize cumulative phase lag while maintaining smoothing effectiveness. Each subsequent EMA stage has a progressively smaller impact on phase distortion.
3. Mathematical Stability:
The geometric progression (α₁, α₁^(2/3), α₁^(1/3)) can enhance numerical stability due to constant ratios between consecutive alphas. This helps prevent the accumulation of rounding errors and maintains consistent convergence properties.
Practical Impact of corrected = true:
This modification aims to achieve:
Potentially better lag reduction for a similar level of smoothing
A more uniform frequency response across different market cycles
Reduced overshoot or undershoot in trending conditions
Improved signal-to-noise ratio preservation
Essentially, the cube root relationship in the corrected TEMA attempts to optimize the trade-off between responsiveness and smoothness that can be a challenge with uniform alpha values.
🔍 Technical Note: Advanced implementations apply compensation techniques to all three EMA stages, ensuring TEMA values are valid from the first bar without requiring a warm-up period. This compensation corrects initialization bias and prevents calculation errors from compounding through the cascade.
▶️ **Interpretation Details**
TEMA excels at identifying trend changes significantly earlier than traditional moving averages, making it valuable for both entry and exit signals:
When price crosses above TEMA, it often signals the beginning of an uptrend
When price crosses below TEMA, it often signals the beginning of a downtrend
The slope of TEMA provides insight into trend strength and momentum
TEMA crossovers with price tend to occur earlier than with standard EMAs
When multiple-period TEMAs cross each other, they confirm significant trend shifts
TEMA works exceptionally well as a dynamic support/resistance level in trending markets
For optimal results, traders often use TEMA in combination with momentum indicators or volume analysis to confirm signals and reduce false positives.
▶️ **Limitations and Considerations**
Market conditions: The high responsiveness can generate false signals during highly choppy, sideways markets
Overshooting: More aggressive lag reduction leads to more pronounced overshooting during sharp reversals
Parameter sensitivity: Changes in length have more dramatic effects than in simpler moving averages
Calculation complexity: Triple cascaded EMAs make behavior less predictable and more resource-intensive
Complementary tools: Should be used with confirmation tools like RSI, MACD or volume indicators
▶️ **References**
Mulloy, P. (1994). "Smoothing Data with Less Lag," Technical Analysis of Stocks & Commodities .
Mulloy, P. (1995). "Comparing Digital Filters," Technical Analysis of Stocks & Commodities .
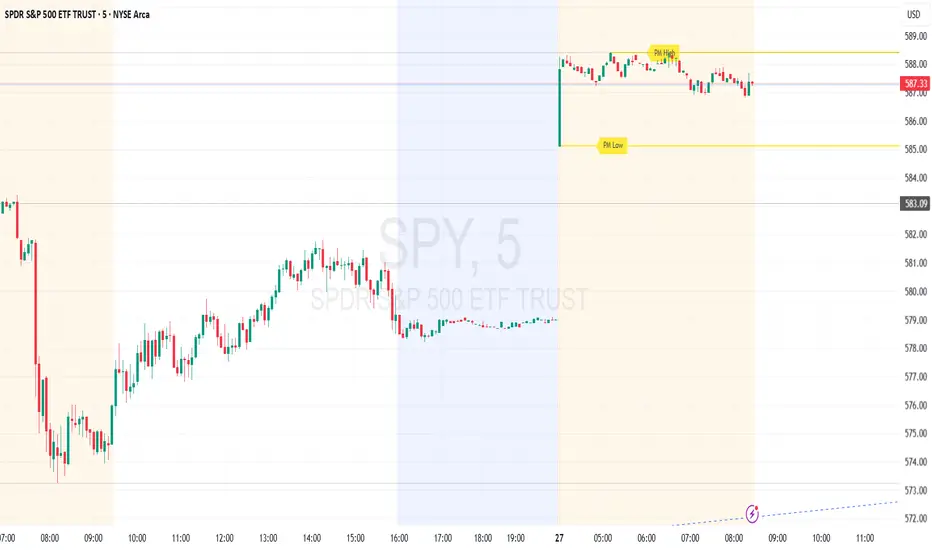
Premarket High/Low (Horizontal Rays)=== Script Description ===
This TradingView script automatically detects and displays the high and low prices
during the premarket session (04:00–09:30 Eastern Time) for the current trading day.
It draws horizontal rays that extend across the chart and labels them as "PM High" and "PM Low".
These markers are refreshed daily and only apply to today's session.
The script also provides full customization for:
- Line color, width, and style (solid, dotted, dashed)
- Label text color, background color, size, and style (left, right, up, down)
Time note: This script assumes data aligned with U.S. market hours.
Open-Based Percentage Levelsv2
This is an updated version of my original script.
Changes:
I took off the displacement levels since there served no purpose on this script.
I also fixed it to where the percentage level lines are visible continually throughout the entire trading day. Old version had these lines disappearing.
I also updated the name to better reflect its purpose.
Now only works on 30 min and below as the higher time frames are meaningless. The older version allow higher time frames and the code is open source to adjust as desired

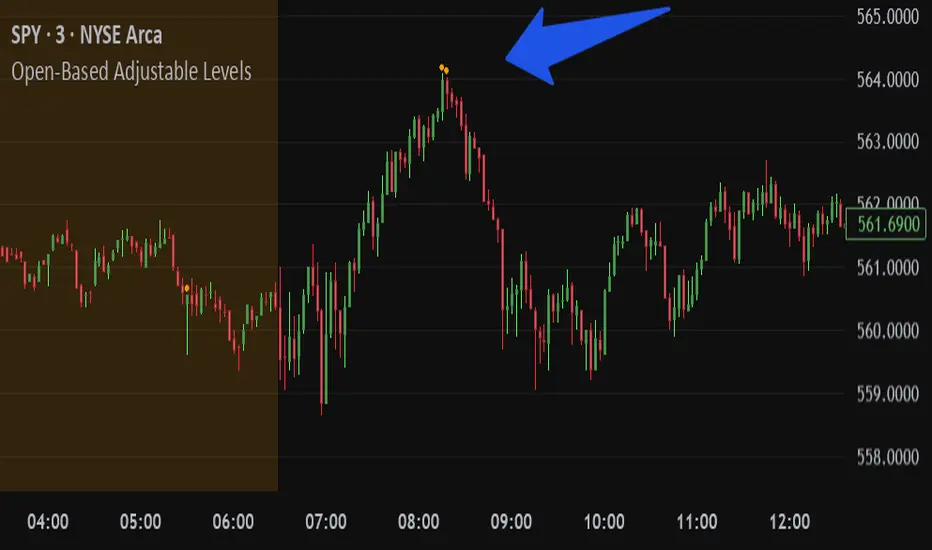
Open-Based Adjustable LevelsThis indicator gives signals for levels where the buy or sell volume is above adjustable levels (ex, volume at 100,000). And these levels will only signal after the price has gone above/below a certain 'adjustable' percentage of the stocks opening price.
Example: Signal sell when the price action is 0.7% above market opening price and when sell volume is above 120,000
or
Signal buy when buy volume is above 80,000 and the price is 0.5% below market opening price.
Great for day trading and detecting potential swings in the market. Above image is on a 3min chart.
Doesn't work as well on daily time frames or above.
Should be combined with other indicators like buy/sell channels, for the best confirmations
Levels & Flow📌 Overview
Levels & Flow is a visual trading tool that combines daily pivot levels with a dynamic EMA ribbon to help traders identify structure, momentum, and key decision zones in the market.
This script is designed for discretionary traders who rely on clean visual cues for intraday and swing trading strategies.
⚙️ Key Features
Daily Pivot, Support, and Resistance Lines
Automatically plots the daily pivot level based on the previous day’s OHLC data, along with calculated support and resistance levels.
Fibonacci Retracement Levels
Two dashed lines above and below the pivot represent the retracement of the pivot-resistance and pivot-support range, forming the boundaries of the “no-trade zone.”
No-Trade Zone (Shaded Box)
A gray shaded box between the two Fibonacci levels to visually mark a high-chop/low-conviction zone.
Trend-Based Candle Coloring (Current Day Only)
Candles are colored green if the close is above the pivot, red if below (only on the current trading day).
Bullish/Bearish Trend Label
A small table in the bottom-right corner displays “Bullish” or “Bearish” depending on whether price is above or below the pivot.
20-EMA Gradient Ribbon
A stack of 20 EMAs, each smoothed and color-coded from blue to green to reflect short- to long-term trend alignment.
Cumulative EMA with Adaptive Weighting
An intelligent moving average line that adjusts weight distribution among the 20 EMAs based on recent predictive accuracy using a learning rate and lookback period.
🧠 How It Works
📍 Levels
The script calculates daily pivot, resistance, and support levels using standard formulas:
Pivot = (High + Low + Close) / 3
Resistance = (2 × Pivot) – Low
Support = (2 × Pivot) – High
These levels update each day and extend 143 bars to the right.
📏 Fib Lines
Fib Up = Pivot + (Resistance – Pivot) × 0.382
Fib Down = Pivot – (Pivot – Support) × 0.382
These lines form the “no-trade zone” box.
📈 EMA Ribbon
20 EMAs starting from the user-defined Base Length, each incremented by 1
Each EMA is smoothed using the Smoothing Period
Color-coded from blue to green for intuitive visual flow
Filled between EMAs to visualize trend strength and alignment
🧠 Cumulative EMA Learning
Each EMA’s historical error is calculated over a Lookback Period
Lower-error EMAs receive higher weight; weights are normalized to sum to 1
The result is a cumulative EMA that adapts based on historical predictive power
🔧 User Inputs
Input
Base EMA Length: Sets the period for the shortest EMA (default: 20)
Smoothing Period: Smooths all EMAs and the cumulative EMA
Lookback for Learning: Number of bars to evaluate EMA prediction accuracy
Learning Rate: Adjusts how quickly weights shift in favor of more accurate EMAs
✅ How to Use It
Use the pivot level to define directional bias.
Watch for price breakouts above resistance or breakdowns below support to consider entry.
Avoid trading inside the shaded zone, where direction is less reliable.
Use the EMA ribbon gradient to confirm short/long alignment.
The cumulative EMA helps define trend with noise reduction.
🧪 Best For
Intraday traders who want to blend structure with flow
Swing traders needing clean daily levels with dynamic confirmation
Anyone looking to avoid choppy zones and improve visual clarity
⚠️ Disclaimer
This script is for educational and informational purposes only. It does not constitute financial advice or a trading recommendation. Always test scripts in simulation or on demo accounts before live use. Use at your own risk.

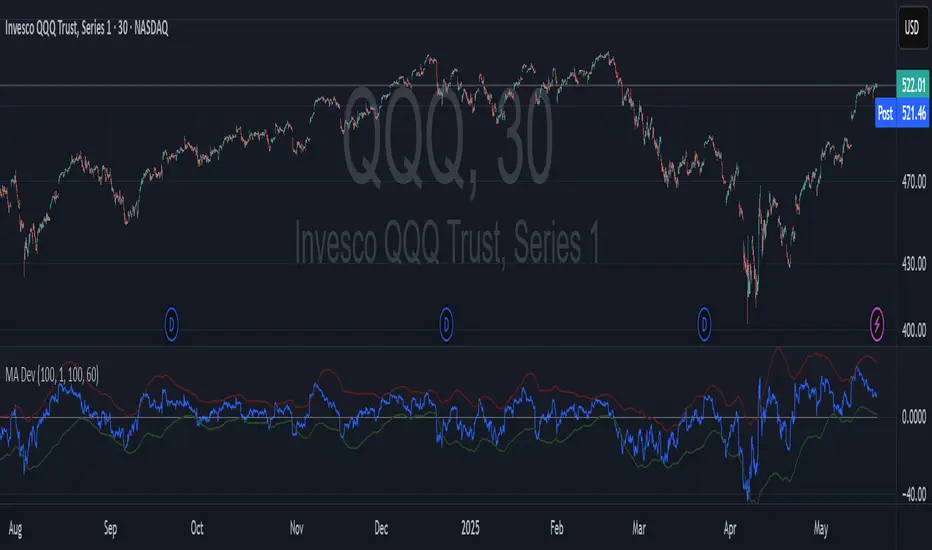
Moving Average Price Deviation Spread
**Moving Average Price Deviation Spread (MA Dev)**
This indicator visualizes the deviation of price from its exponential moving average (EMA) and scales it within dynamic upper and lower bounds. The core logic measures the smoothed spread between price and EMA, then calculates standard deviation over a rolling window to define statistical thresholds.
* **Spread**: EMA of (Close - EMA), highlighting directional bias.
* **Upper/Lower Bounds**: EMA of ±1.96 \* standard deviation of the spread, framing high/low deviation zones.
* **Use Case**: Spot overextended conditions, mean reversion setups, or volatility-driven breakouts. Ideal for timing entries and exits around price extremes.