ICT Killzone by JeawThis is an indicator script for TradingView called "ICT Killzone". It is a useful tool for identifying the London and New York open and close sessions, as well as the Asian range on the chart. The appearance of the "killzones" can be customized by selecting colors and transparencies for each session. Boxes can also be displayed around each session and labels with additional information can be added. This script is compatible with intraday charts and time multipliers up to 60 minutes. It was created by Jeaw and is based on the ideas of the ICT (Institutional Cash Trades) methodology. This script can help traders avoid entering the market during high impact news events and periods of low liquidity. By identifying these potentially volatile times, traders can better manage their risk and improve their overall trading strategy.
Cari dalam skrip untuk "市值60亿的股票"

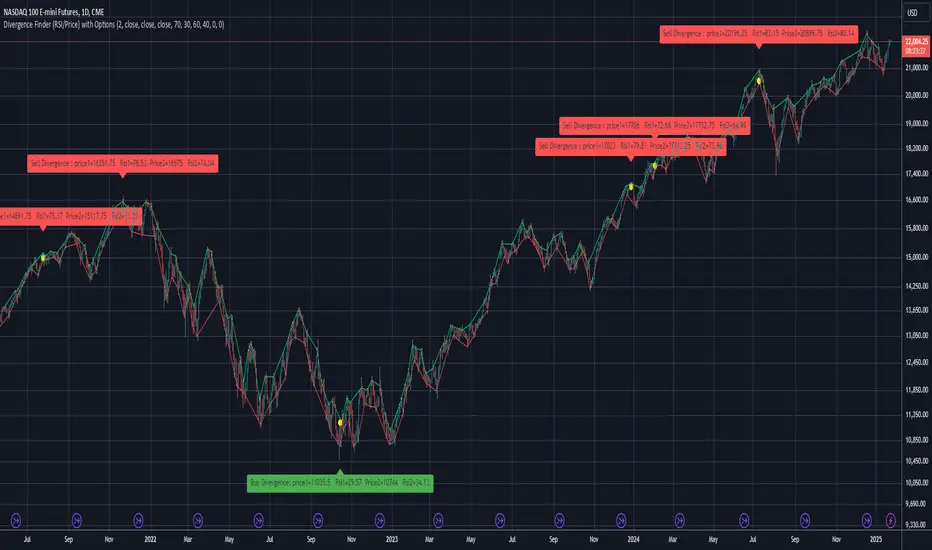
Divergence Finder (RSI/Price) with OptionsDivergence finder used to find BUY or SELL Signal based on a divergence between Price and RSI (Price goes UP when RSI goes down / opposite )
You can configure the script with several Options :
Source for Price Buy Div : you can use the close price of the candle (by default) or use the high price of the candle for exemple.
Source for Price Sell Div : you can use the close price of the candle (by default) or use the low price of the candle for exemple.
Source for RSI Div : you can use the close price of the candle (by default) to calculate the RSI .
Theses settings allow you to set a minimum RSI level to reach to activate the Divergence finder (p1 is the first point in time, and p2 is the second one):
Min RSI for Sell divergence(p1) : this is the minimum RSI level to reach for the first of the 2 points of divergence (Default 70) for the SELL Signal
Min RSI for Sell divergence (p2) : this is the minimum RSI level to reach for the second of the 2 points of divergence (Default 60) for the SELL Signal
Max RSI for Buy divergence (p1) : this is the minimum RSI level to reach for the first of the 2 points of divergence (Default 30) for the BUY Signal
Max RSI for Buy divergence (p2) : this is the minimum RSI level to reach for the second of the 2 points of divergence (Default 40 ) for the BUY Signal
Theses settings allow you to set a minimum margin difference between our two points (p1 and p2) to validate the Divergence
Min margin between price for displaying divergence (%) : Set a minimum margin (in % of the price) before the indicator validate this divergence
Min margin between RSI for displaying divergence (%) : Set a minimum margin (in % of the RSI ) before the indicator validate this divergence
Display Divergence label : Choose to display the price of the candle, and the RSI when a divergence is found
Display tops/bottoms : Display where the tops and bottoms are calculated directly on the chart
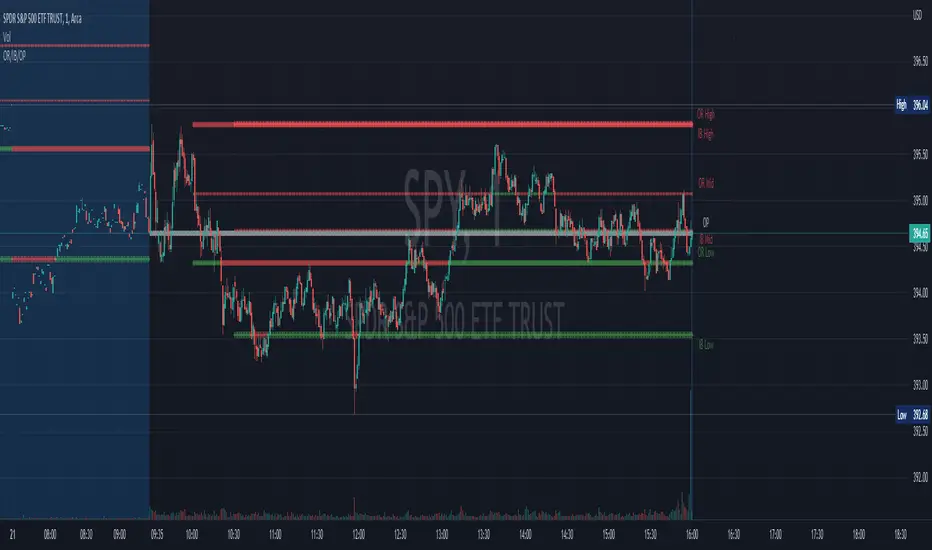
Opening Range, Initial Balance, Opening PriceThis script draws Opening Range, Initial Balance and Opening Price with options to show mid levels.
By default, lines changes color depending on whether closing price is above or below the lines. Red if price is below, green if price is above.
Colors and line styles are all configurable.
Options to change label positions.
Some definitions:
Opening Range - The opening range is high and low for a given period after the market opens. This period is generally the first 30 or 60 minutes of trading
Initial Balance - WRT to TPO profile chart, the Initial Balance is the price range resulting from the market’s trade during the first two 30 minute periods of the regular trading hours session.
Why is this useful?
The first hour of the trading day is the most active and dynamic period. The price range defined by this period of trading creates some key support / resistance levels for the rest of the day. Example below:
[blackcat] L1 N-Shape AttackLevel 1
Background
At the beginning of the stock price rise, the stock form is a buying point in the "N" shape.
Function
This form is the same as the "N" shape. What is pursued is the strength of the skyrocketing rise after the sharp rise and fall. The adjustment time in the middle of the N shape must not exceed 3-4 days! If it is an aggressive Changyang, the total adjustment cycle must not exceed 5 days. A simple summary is: skyrocketing + quick callback + skyrocketing again! There has been a solid sun candle in the early stage, and a real sun candle appeared again after a few days of adjustment.
Key points of the N-shaped attack pattern:
1. The shorter the adjustment time, the better, indicating that individual stocks are already quite strong, and the rush to raise funds is quite obvious. It is best to only adjust for 1 day. The most extreme is a big rise and then a big fall and then a big rise. This is the most ideal. Adjust on 2 days and then follow. It is best to adjust the number of days below 5 days. The longer the adjustment time, the less obvious the effect.
2. The smaller the adjustment range, the better, and it is better if the lowest point during the adjustment period does not fall below the lowest point of the previous big rising candle.
3. It is more ideal if the closing price of the latter surge is higher than the highest price of the previous surge, and it is even more ideal if it exceeds the height of the adjustment period.
4. When selecting stocks, try to select stocks whose 20-day and 60-day moving averages have started to rise, preferably in a long-term arrangement.
Market logic of N-shaped attack:
The main force took advantage of the opportunity to pull out the first big positive candle in the early stage, and then took advantage of the profit taking or the index pullback, and there was a rapid 1-3 day downward kill, just returning to the initial position of the previous big positive candle, and then increased the volume again Rising to new highs.
Remarks
The long signal frequency is low.
Feedbacks are appreciated.

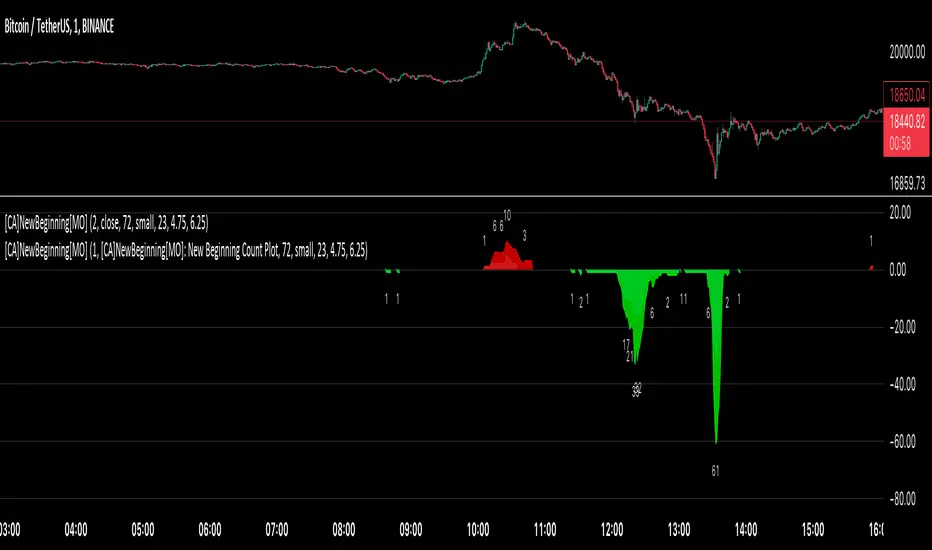
[ChasinAlts] A New Beginning[MO]Hello Tradeurs, firstly let me say this… Please do not think that this dump is over (so I want to gift you one of the best gifts I CAN gift you at the PERFECT TIME...which is now) but I believe it to be the final one before a New Beginning is upon us. I hope that anybody that sees this within the next day or so listens to me when I tell you this… Follow the instructions below, IF ANYTHING, just to set the alert to be notify you so you can see why I’m about to tell you everything that I’m about to tell you. That being that this indicator is pure magic…..BUT you must stay in your lane when using it (ie. ultimately, understand its use case) and most importantly, how many people you expose it to. The good thing about it is it produces very few alerts. In fact, it was built SOLELY to find the very tips of MAJOR dumps/pumps (with its current default settings). I honestly cannot remember where I acquired the code so if anyone recognizes it please direct me to the source so I can give a shoutout. In the past it has been so astonishingly accurate that I didn’t want to publish it but I've just been...in the mood I suppose recently.
Now…it is SPECIFICALLY meant for the 1min TF. I’ll say it again… It is meant for ONE MINUTE CHARTS…it was built for 1min charts, it will only work as well as I’m describing to you on the…you guessed it…ONE MINUTE CHART (again, with the default settings how they are, that is). If any of you use it for this present dump (November 8, 2022) and want to thank me for it or speak very highly about it or give it a bunch of likes… DO NOT!!! I will reword this so you fully comprehend my urgency on this matter. I do not want this indicator getting out for every Joe Schmoe (or stupid YouTuber) to use and spread because the manipulators will see to it that it will no longer work. Things that will happen that will cause it to gain the popularity that I do not want it to have are the following:
1) You "like" the indicator in TradingView to show appreciation/that your using it so that it will show up in your indicators list (to get past this you need to select all of the text of the script on the indicator's page and copy and paste it into the “Pine Editor”. Then select "save" and name it as you wish. Now, it is in your indicator list under the name that you saved it as.
2) You *favorite* the indicator in TradingView
3) You leave comments in the comments section on the indicators page in TradingView (I really do love hearing comments about anything regarding my indicators(positive or negative..though I haven't gotten any negative yet SO BRING IT ON), even though I don’t get too many of them, so if you are grateful (or hateful) PLEASE message me privately (and really I truly truly do appreciate getting comments/messages so if it has benefited you make sure to message me as I might have more for those that do express their gratitude) and tell me anything that you want to tell me or ask me anything that you wanna ask me there).
One major thing that will help to suppress its popularity will be that if anybody goes back on historical charts to see its accuracy they most likely will not be able to go far back enough on the 1min TF to be able to Witness its efficacy so I'm banking on that helping to keep a lid on things.
The settings used (as well as the TF used) really should not be changed if using it for its intended purpose. On little dumps that last for a few hours os so will produce points somewhere in the 40 to 60 range at the dumps/pumps peak. Each coin is worth one point and there are 40 coins per set and 2 sets (that you will have to link together) and when the under the hood indicator is triggered for that coin it will add a point to the score. With the settings how they are and on the 1min TF(if I hadn't mentioned it yet. lol) a good point alert threshold to use to catch the apex of heavy pumps/dumps would be between 70 to 80 points(80 is max). Ultimately is the users choice to input the alert threshold of points in the indicators settings(default is 72). If you’re trying to nail the very bottom of a hard pump/dump, DO NOT fall for times where it peaks at 50 to 60. You’re looking for 70 or above.
*** This is the most important thing to do as you will not receive an alert if you do not do this correctly. You have to add the indicator two times to the chart. One of the indicators needs to be under “Coin Set 1“ and the other under “Coin Set 2“. Now, in “Set 1“ you need to go to the setting entitled “Select New Beginning Count Plot from drop-down“ and you need to open the drop-down and select the plot entitled “A New Beginning Count Plot”. This will link both the indicators and since there are 40 coins per iteration of the script, when you link them it could give you a max of 80 points total at the very peak of a very strong dump...which will obviously be rare. You CAN use only one copy of the script (but need to change the alert setting to a MAX of 40) but in my experience it's best to use both of them and to link them. It gives you a more well-rounded outcome. Good luck my people and always remember...Much love...Much Love. May the force be with your trades. -ChasinAlts out.
Intrabar Efficiency Ratio█ OVERVIEW
This indicator displays a directional variant of Perry Kaufman's Efficiency Ratio, designed to gauge the "efficiency" of intrabar price movement by comparing the sum of movements of the lower timeframe bars composing a chart bar with the respective bar's movement on an average basis.
█ CONCEPTS
Efficiency Ratio (ER)
Efficiency Ratio was first introduced by Perry Kaufman in his 1995 book, titled "Smarter Trading". It is the ratio of absolute price change to the sum of absolute changes on each bar over a period. This tells us how strong the period's trend is relative to the underlying noise. Simply put, it's a measure of price movement efficiency. This ratio is the modulator utilized in Kaufman's Adaptive Moving Average (KAMA), which is essentially an Exponential Moving Average (EMA) that adapts its responsiveness to movement efficiency.
ER's output is bounded between 0 and 1. A value of 0 indicates that the starting price equals the ending price for the period, which suggests that price movement was maximally inefficient. A value of 1 indicates that price had travelled no more than the distance between the starting price and the ending price for the period, which suggests that price movement was maximally efficient. A value between 0 and 1 indicates that price had travelled a distance greater than the distance between the starting price and the ending price for the period. In other words, some degree of noise was present which resulted in reduced efficiency over the period.
As an example, let's say that the price of an asset had moved from $15 to $14 by the end of a period, but the sum of absolute changes for each bar of data was $4. ER would be calculated like so:
ER = abs(14 - 15)/4 = 0.25
This suggests that the trend was only 25% efficient over the period, as the total distanced travelled by price was four times what was required to achieve the change over the period.
Intrabars
Intrabars are chart bars at a lower timeframe than the chart's. Each 1H chart bar of a 24x7 market will, for example, usually contain 60 intrabars at the LTF of 1min, provided there was market activity during each minute of the hour. Mining information from intrabars can be useful in that it offers traders visibility on the activity inside a chart bar.
Lower timeframes (LTFs)
A lower timeframe is a timeframe that is smaller than the chart's timeframe. This script determines which LTF to use by examining the chart's timeframe. The LTF determines how many intrabars are examined for each chart bar; the lower the timeframe, the more intrabars are analyzed, but fewer chart bars can display indicator information because there is a limit to the total number of intrabars that can be analyzed.
Intrabar precision
The precision of calculations increases with the number of intrabars analyzed for each chart bar. As there is a 100K limit to the number of intrabars that can be analyzed by a script, a trade-off occurs between the number of intrabars analyzed per chart bar and the chart bars for which calculations are possible.
Intrabar Efficiency Ratio (IER)
Intrabar Efficiency Ratio applies the concept of ER on an intrabar level. Rather than comparing the overall change to the sum of bar changes for the current chart's timeframe over a period, IER compares single bar changes for the current chart's timeframe to the sum of absolute intrabar changes, then applies smoothing to the result. This gives an indication of how efficient changes are on the current chart's timeframe for each bar of data relative to LTF bar changes on an average basis. Unlike the standard ER calculation, we've opted to preserve directional information by not taking the absolute value of overall change, thus allowing it to be utilized as a momentum oscillator. However, by taking the absolute value of this oscillator, it could potentially serve as a replacement for ER in the design of adaptive moving averages.
Since this indicator preserves directional information, IER can be regarded as similar to the Chande Momentum Oscillator (CMO) , which was presented in 1994 by Tushar Chande in "The New Technical Trader". Both CMO and ER essentially measure the same relationship between trend and noise. CMO simply differs in scale, and considers the direction of overall changes.
█ FEATURES
Display
Three different display types are included within the script:
• Line : Displays the middle length MA of the IER as a line .
Color for this display can be customized via the "Line" portion of the "Visuals" section in the script settings.
• Candles : Displays the non-smooth IER and two moving averages of different lengths as candles .
The `open` and `close` of the candle are the longest and shortest length MAs of the IER respectively.
The `high` and `low` of the candle are the max and min of the IER, longest length MA of the IER, and shortest length MA of the IER respectively.
Colors for this display can be customized via the "Candles" portion of the "Visuals" section in the script settings.
• Circles : Displays three MAs of the IER as circles .
The color of each plot depends on the percent rank of the respective MA over the previous 100 bars.
Different colors are triggered when ranks are below 10%, between 10% and 50%, between 50% and 90%, and above 90%.
Colors for this display can be customized via the "Circles" portion of the "Visuals" section in the script settings.
With either display type, an optional information box can be displayed. This box shows the LTF that the script is using, the average number of lower timeframe bars per chart bar, and the number of chart bars that contain LTF data.
Specifying intrabar precision
Ten options are included in the script to control the number of intrabars used per chart bar for calculations. The greater the number of intrabars per chart bar, the fewer chart bars can be analyzed.
The first five options allow users to specify the approximate amount of chart bars to be covered:
• Least Precise (Most chart bars) : Covers all chart bars by dividing the current timeframe by four.
This ensures the highest level of intrabar precision while achieving complete coverage for the dataset.
• Less Precise (Some chart bars) & More Precise (Less chart bars) : These options calculate a stepped LTF in relation to the current chart's timeframe.
• Very precise (2min intrabars) : Uses the second highest quantity of intrabars possible with the 2min LTF.
• Most precise (1min intrabars) : Uses the maximum quantity of intrabars possible with the 1min LTF.
The stepped lower timeframe for "Less Precise" and "More Precise" options is calculated from the current chart's timeframe as follows:
Chart Timeframe Lower Timeframe
Less Precise More Precise
< 1hr 1min 1min
< 1D 15min 1min
< 1W 2hr 30min
> 1W 1D 60min
The last five options allow users to specify an approximate fixed number of intrabars to analyze per chart bar. The available choices are 12, 24, 50, 100, and 250. The script will calculate the LTF which most closely approximates the specified number of intrabars per chart bar. Keep in mind that due to factors such as the length of a ticker's sessions and rounding of the LTF, it is not always possible to produce the exact number specified. However, the script will do its best to get as close to the value as possible.
Specifying MA type
Seven MA types are included in the script for different averaging effects:
• Simple
• Exponential
• Wilder (RMA)
• Weighted
• Volume-Weighted
• Arnaud Legoux with `offset` and `sigma` set to 0.85 and 6 respectively.
• Hull
Weighting
This script includes the option to weight IER values based on the percent rank of absolute price changes on the current chart's timeframe over a specified period, which can be enabled by checking the "Weigh using relative close changes" option in the script settings. This places reduced emphasis on IER values from smaller changes, which may help to reduce noise in the output.
█ FOR Pine Script™ CODERS
• This script imports the recently published lower_ltf library for calculating intrabar statistics and the optimal lower timeframe in relation to the current chart's timeframe.
• This script uses the recently released request.security_lower_tf() Pine Script™ function discussed in this blog post .
It works differently from the usual request.security() in that it can only be used on LTFs, and it returns an array containing one value per intrabar.
This makes it much easier for programmers to access intrabar information.
• This script implements a new recommended best practice for tables which works faster and reduces memory consumption.
Using this new method, tables are declared only once with var , as usual. Then, on the first bar only, we use table.cell() to populate the table.
Finally, table.set_*() functions are used to update attributes of table cells on the last bar of the dataset.
This greatly reduces the resources required to render tables.
Look first. Then leap.

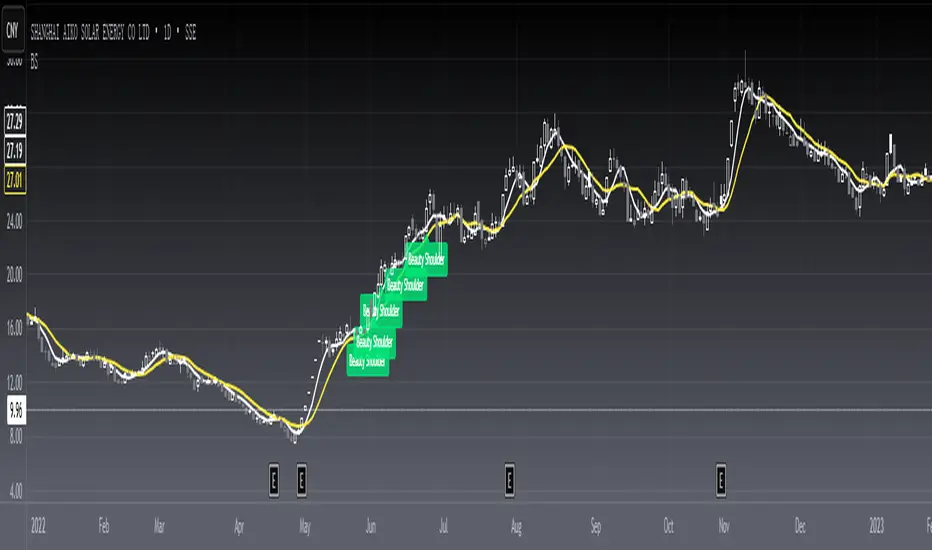
[blackcat] L1 Beauty ShoulderLevel 1
Background
A classic candle pattern : beauty shoulder.
Function
Beauty shoulder, as the name suggests, is that the trend of the candle chart is like a beauty shoulder. The most important feature of the beauty shoulder pattern is that after it reaches the shoulder, it does not wash the market through the downward trend of the stock price, but only by slowing down the rising speed to achieve washing out float chips.Therefore, the shape of the beauty shoulder is not rising from beginning to end, but the acceleration of the rise has changed.
Morphological characteristics:
1. Beauty shoulder is a candlestick pattern. It is usually the trace left by the main force opening up positions. This pattern is encountered by dozens every year, and you will always find it if you look for it carefully.
2. The technical characteristics of the beauty shoulder, the 5-day moving average and the 10-day moving average must continue to form a golden fork.
3. The trend in the first half of the candle chart must present an arch, and only in this way can it be called a beauty shoulder.
4. The candle chart must be above the 60-day moving average. It is best to hang it in the air, or a stronger shoulder of the beauty. The candle chart is above the 30-day moving average, so the magnitude of the pull up will become larger.
5. The bottom of the shoulder of the beauty is the part of the consolidation, and the volume must be increased, because the shoulder of the beauty is the result of the main force building a strong position in a short time, so the volume must be increased.
6. The rise of the shoulders of the beauty is very scary, and the increase is usually more than 30%.
Remarks
Feedbacks are appreciated.
Yield Curve (1-10yr)Yield curve of the 1-10 year US Treasury Bonds, with over 60 years of history.
The Yield Curve is the interest rate on the 10 year bond minus the 1 year bond.
When it inverts (crosses under 0) a recession usually follows 6-12 months later.
It's a great leading indicator to identify risk in the macroeconomic environment.
Yield curves can be constructed on varying durations. Using a 1-year as the short-term bond provides a slightly faster response than the 2-year bond; and the 1-year has more historical data on TradingView.

Multi Timeframe Moving AveragesThis script lets you have multiple Smoothed Moving Averages
for any timeframe of your choosing that are configurable to
your liking all in one indicator. Very useful if you want to always
show a specific MA like the 200d SMA on smaller timeframes,
for example.
Defaults to 30 d, 60 day, 90 day

Power Of Stocks - Bollinger Band & 5Ema Indicator - Keanu_RiTz
Power of Stocks - Bollinger band & 5ema Strategy
In this script you get to take Buy/Sell trades using the 3 options mentioned below.(Alerts with price levels for buy/sell at , SL & Target are included in this one)
1. Combined Strategy :- uses confirmation from both strategies to trade.
2. Bollinger band Strategy :- use the Bollinger band Strategy to trade.
3. 5ema Strategy :- use the 5ema Strategy to trade.
1. Combined Strategy :-
for Selling :- we will go short/sell only when conditions of both strategies are satisfied.
i.e. when a candle is completely above the upper Bollinger band & completely above the 5ema then it will be our Alert Candle.
We Short/Sell only when the low of the Alert candle is broken or when the candle closes below the close of the Alert Candle.
SL will be above high of the Alert Candle. Target will be minimum 1:3 or as per your emotions.
for Buying:- we will go Long/Buy only when conditions of both strategies are satisfied.
i.e. when a candle is completely below the lower Bollinger band & completely below the 5ema then it will be our Alert Candle.
We go Long/Buy only when the high of the Alert candle is broken or when the candle closes above the close of the Alert Candle.
SL will be below low of the Alert Candle. Target will be minimum 1:3 or as per your emotions.
2. Power of Stocks - Bollinger Band Strategy :-
Bollinger band with standard deviation = 1.5
when a candle is completely above the upper Bollinger band, that candle will be called a signal/alert candle.
Initiate a Sell trade when that alert candles low is broken. SL will be above high of that alert candle.
Risk to reward ratio will be 1:4 i.e. target will be 4 times the SL.
when a candle is completely below the lower Bollinger band, that candle will be called a signal/alert candle.
Initiate a Buy trade when that alert candles high is broken. SL will be below low of that alert candle.
Risk to reward ratio will be 1:4 i.e. target will be 4 times the SL.
other rules for Options buying:- minimum 15min timeframe
The day you initiate the position , you should be in profit above 10%-15% then only you should carry forward that position overnight, otherwise squareoff your trade on that day only.
Buy ATM or slightly OTM, SL max 100 points , target 1:4
for Long-term/Investing :- Minimum Weekly
If candle is outside the lower band then initiate a Buy trade when that candles High is broken. Sl will be below Low of that candle.
for Long-term Target will be according to your emotions.
3. Power of Stocks - 5ema Strategy (target minimum 1:3)
Timeframe -
5 min for Selling (Sell Futures/index/stocks or buy Put)
15 min for Buying (Buy Futures/index/stocks or sell Put)
for selling stocks :-
you should enter trade within 10am , don't look for entries after that time. take only 2 entries a day.
for selling Index(Banknifty) :-
you can take trade at anytime of the day whenever conditions get satisfied. you can take multiple entries in banknifty as it is very volatile.
for options choose atm strikes: selling trade
sl for premium between 200-300 :- 20-30 points SL
sl for premium between 400-500 :- 40-50 points SL
sl for premium between 500-600 :- 50-60 points SL
Subhashish Pani's (power of stocks) 5 EMA Strategy:-
It plots 5 EMA and Buy/Sell signals with Target & Stoploss levels.
What is Subhashish Pani's (power of stocks) 5 EMA Strategy :-
His strategy is very simple to understand. for intraday use 5 minutes timeframe for selling. You can sell futures, sell call or buy Puts in selling strategy.
What this strategy tries to do is , it tries to catch the tops, so when you sell at top & it turns out to be a reversal point then you can get good profit.
this will hit stop losses often, but stop losses are small and minimum target should be 1:3. but if you stay with the trend you can get big profits.
According to Subhashish Pani this strategy has 60% success rate.
Strategy for Selling (Short future/Call/stock or buy Put)
When ever a Candle closes completely above 5 ema (no part of candle should be touching the 5ema), then that candle should be considered as Alert Candle.
If the next candle is also completely above 5 ema and it has not broken the low of previous alert candle, Then the previous Alert Candle should be ignored and the new candle should be considered as new Alert Candle.
so if this goes on then continue shifting the Alert Candle, but whenever the next candle breaks the low of the Alert Candle we should take the Short trade (Short future/Call/stock or buy Put).
Stoploss will be above high of the Alert Candle and minimum target will be 1:3.
Strategy for Buying (Buy future/Call/stock or sell Put)
When ever a Candle closes completely below 5 ema (no part of candle should be touching the 5ema), then that candle should be considered as Alert Candle.
If the next candle is also completely below 5 ema and it has not broken the high of previous alert candle, Then the previous Alert Candle should be ignored and the new candle should be considered as new Alert Candle.
so if this goes on then continue shifting the Alert Candle, but whenever the next candle breaks the high of the Alert Candle we should take the Long trade (Buy future/Call/stock or sell Put).
Stoploss will be below low of the Alert Candle and minimum target will be 1:3.
Buy/Sell with extra conditions :
it just adds 1 more condition to buying/selling
1. checks if closing of current candle is lower than alert candles closing for Selling & checks if closing of current candle is higher than alert candles closing for Buyling.
This can sometimes save you from false moves but by using this, you can also miss out on big moves as you'll enter trade after candle closing instead of entering at break of high/low.
Note :- According to Subhashish Pani Timeframe for intraday buying should be 15 minutes Timeframe.
If you haven't understood the strategy by reading above description, then search for "Subhashish Pani's (power of stocks) 5 EMA Strategy" on YouTube to get a deeper understanding.
Note:- This is not only for Intraday trading , you can use this strategy for Positional/Swing trading as well. If you use this on Monthly Timeframe then it can be very good for Long Term Investing as well.
Rules will be same for all types of trades & Timeframes.

TASC 2022.11 Phasor Analysis█ OVERVIEW
TASC's November 2022 edition Traders' Tips includes an article by John Ehlers titled "Recurring Phase Of Cycle Analysis". This is the code that implements the phasor analysis indicator presented in this publication.
█ CONCEPTS
The article explores the use of phasor analysis to identify market trends.
An ordinary rotating phasor diagram is a two-dimensional vector, anchored to the origin, whose rotation rate corresponds to the cycle period in the price data stream. Similarly, Ehlers' phasor is a representation of angular phase rotation along the course of time. Its angle reflects the current phase of the cycle. Angles -180, -90, +90 and +180 degrees correspond to the beginning, valley, peak and end of the cycle, respectively.
If the observed cycle is very long, the market can be considered trending . In his article, John Ehlers defined trending behavior to occur when the derived instantaneous cycle period value is greater that 60 bars. The author also introduced guidelines for long and short entries in a trending state. Depending on the tuning of the indicator period input, a long entry position may occur when the phasor angle is around the approximate vicinity of −90 degrees, while a short entry position may occur when the phasor angle will be around the approximate vicinity of +90 degrees. Applying these definitive guidelines, the author proposed a state variable that is indicated by +1 for a trending long position, 0 for cycling, and −1 for a trending short position (or out).
The phasor angle, the cycle period, and the state variable are made available with three selectable display modes provided for this TradingView indicator.
█ CALCULATIONS
The calculations are carried out as follows.
First, the price data stream is correlated with cosine and sine of a fixed cycle period. This produces two new data streams that correspond to the projections of the frequency domain phasor diagram to the horizontal (so-called real ) and vertical (so-called imaginary ) axis respectively. The wavelength of the cycle period input should be set for the midrange vicinities of the phasor to coincide with the peaks and valleys of the charted price data.
Secondly, the phase angle of the phasor is easily computed as the arctangent of the ratio of the imaginary component to the real component. The difference between the current phasor values and its last is then employed to calculate a derived instantaneous period and market state. This computation is then repeated successively for each individual bar over the entire duration of the data set.

RSI Buy & Sell Trading ScriptThis is my first attempt at a trading script using the RSI indicator for Buy & Sell signals (so please be nice but would appreciate any constructive comments).
Starting with $100 initial capital and using 10% per trade
You can select which month the backtesting starts
There is also a monthly table (sorry can’t remember who I got this from) that shows the total monthly profits, but you’ll need to turn it on by going into settings, Properties and in the Recalculate section tick the “On every tick” box
It should do the following:
Open Buy order if the RSI > 68 and the current Moving Average is greater than the previous Moving average
• TP1 = 50% of Order at 0.4%
• TP2 = 50% of order at 0.8%
• SL = 2% below entry
• Close Buy order if the RSI < 30
Open Sell order if the RSI < 28 and the current Moving Average is less than the previous Moving average
• TP1 = 50% of Order at 0.4%
• TP2 = 50% of order at 0.8%
• SL = 2% above entry
• Close Buy order if the RSI < 60
I would like to build on this if you have any ideas/ code that could help like the following:
• Move the SL to break even when it hits TP1
• Move the SL to TP1 when TP2 hits
• Moving take profit code so I can let the some of the trade stay in play (activate if it hits 1% profit and close trade if price retracts 0.5%)

[blackcat] L3 Candle Skew 3821 TraderLevel 3
Background
By modeling skew to produce long and short entry points.
Function
The concept of skew comes from physics and statistics, and is used in market technical analysis to reflect the expectation of future stock price distribution. Because the return distribution of stocks in the trend market has skew (Skew), it is reasonable to judge the trend continuity according to the historical and current skew. It is precisely because the stock price rises that there is a skew. The greater the strength of the rise, the greater the angle of inclination and the greater the skew. The degree of this upward or downward slope in the statistical distribution of stock prices is defined as skew. Through the size of skew, we can know the direction, inertia and extent of the stock's rise or fall, and find stocks with a high probability of quick profit. The technical indicator introduced today is a simplified but effective stock price skew model used to generate buying and selling points.
The principle of this technical indicator is based on the success rate test results of different moving averages corresponding to different skews as follows:
10 trading cycles profit 5% success rate (%)
5 period moving average 10 period moving average 20 period moving average 30 period moving average 60 period moving average
skew>=0 51.36 52.26 52.65 52.55 52.08
skew>=0.5 55.44 58.06 60.56 62.37 65.66
skew>=1 59.72 63.06 67.07 69.78 70.62
skew>=1.5 63.01 67.08 71.61 72.9 70.61
skew>=2 65.53 70.22 74.18 73.76 70.12
skew>=2.5 67.89 72.93 75.32 73.66 68.92
skew>=3 70.07 75.32 75.69 72.54 67.45
skew>=3.5 71.85 77.05 75.32 73.63 63.82
skew>=4 73.6 78.06 74.19 68.96 59.91
skew>=4.5 76.04 78.56 72.85 69.55 49.24
skew>=5 77.44 78.88 71.58 67.28 51.69
skew>=5.5 78.97 78.39 70.33 64.31 49.7
skew>=6 79.68 78.07 68.82 61.65 53.57
Table 1
As can be seen from the above table, with the increase of the 5-period and 10-period moving average skew values, the success rate is increasing, but after the 20- and 30-period moving average skew values increase to an upper bound, it shows a downward trend. When the skew of the 20-period and 30-period moving averages is greater than 0.5, the 10-period profit of 5% is above 60%, and when it is greater than 1.5, the success rate can reach above 70%. The larger the 5-period moving average skew, the higher the success rate, but often because the short-term skew is too large, the stock price has risen rapidly to a high level, and chasing up is risky, which is not suitable for the investment habits of most people, so prudent investors may like to do swings. Investors may wish to pay more attention to the skew of the 20-period and 30-period moving averages. Based on the above analysis, as a short-term trading enthusiast, I need to choose the 5-period and 10-period moving average skew, and consider the medium-term trend as a compromise, and I also need to consider the 20-period moving average skew. Finally, according to the principle of personal preference, I chose 3 groups of periods based on Fibonacci magic numbers: 3 periods, 8 periods, 21 periods, and skews that take into account both short-term and mid-line trends. So, I named this indicator number 3821 as a distinction.
002084 1D from TradingView
BTCUSDT 1H from TradingView
Tesla 1D from TradingView
VarianceChange under a 60 ema.
For use with BTCUSD 1 min.
When the indicator is at a low of -2 it shows over sold.
When the indicator is at a high of 2 it shows over bought.

Harris RSIThis is a variation of Wilder's RSI that was altered by Michael Harris.
CALCULATION
The average change of each of the length's source value is compared to the more recent source value.
The average difference of both positive or negative changes is found.
The range of 100 is divided by the divided result of the average incremented and decremented ratio plus one.
This result of the above is subracted from the range value of 100
I have added some signals and filtering options with moving averages:
Trend OB/OS: Uptrend after above Overbought Level. Downtrend after below Oversold Level\n(For the traditional RSI OB=60 and OS=40 is used)
OB/OS: When above Overbought, or below oversold
50-Cross: Above 50 line is uptrend, below is downtrend
Direction: Moving up or down
RSI vs MA: RSI above MA is an uptrend, RSI below MA is a downtrend
The signals I added are just some potential ideas, always backtest your own strategies.

Relative Strength Index with fast and slow MAsThis is the typical Relative Strength Index indicator with two moving averages, one slow (length 50 by default) and one fast (length 20 by default). Additionally, there are four lines, which mark the oversold/overbought signals at different levels, there are two inner bands with values at the levels 40, and 60, and two outer bands at the levels 20, and 80. The presence of the fast and slow moving averages and their crossover/crossunder with the oversold/overbought levels or the RSI can provide more insightful and faster signals. The indicator has a slightly different colouring mechanism.
The views of the RSI indicator on the above the price chart in both dark and light modes:

Chop and explode (ps5)Description : This is a renovated version of my previous mod that was based on the original script from fhenry0331.
Added are:
a data cleaning function
a seasonal random index function
an updated scaler and
a signalling procedure.
-
The following description is moved here from the old script.
The purpose of this script is to decipher chop zones from runs/movement/explosion spans. The chop is RSI movement between 40 and 60. Tight chop is RSI movement between 45 and 55. There should be an explosion after RSI breaks through 60 (long) or 40 (short). Tight chop bars are colored gray, a series of gray bars indicates a tight consolidation and should explode imminently. The longer the chop the longer the explosion will go for. The tighter the better. Loose chop (jig saw/gray bars on the silver background) will range between 40 and 60. The move begins with green and red bars.
Couple it with your trading system to help stay out of chop and enter when there is a movement.

SuperTrend Support & Resistance(My goal creating this indicator) : Provide a way to categorize and label key structures on multiple time frames so I can create a plan based on those observable facts.
The Underlying Concept / What is Momentum?
The Momentum shown is derived from a Mathematical Formula, SUPERTREND. When price closes above Supertrend Its bullish Momentum when its below Supertrend its Bearish Momentum. On the first bar bearish momentum is detected a resistance Level is made at the highest point of the previous bullish condition. On the first bar bullish momentum is detected a support Level is made at the lowest point of the previous bearish condition. As I become a better analyst I will find better techniques and this source code may become open-source, but as of now it remains protected. This indicator scans for bullish & bearish Momentum on the Timeframes selected by the user and when there is a shift in momentum on any of those time frames (price closes below or above SUPERTREND ) it notifies the trader with a Supply or Demand level with a unique color and Size to signify the severity of said level.
What is Severity?
Severity is How we differentiate the importance of different Highs and Lows. If Momentum is detected on a higher timeframe the Supply or Demand Level is updated. The Color and Size representing that higher timeframe will be shown. Demand and Supply Levels made by higher Timeframes are more SEVERE then a demand level made by a lower Timeframe.
Technical Inputs
- If you want to optimize the rate of signals to better fit your trading plan you would change the Factor input and ATR Length input. Increase factor and ATR Length to decrease the frequency of signals and decrease the Factor and ATR Length to increase the frequency of signals.
- to ensure the correct calculation of Support and Resistance levels change BAR_INDEX. BAR_INDEX creates a buffer at the start of the chart. For example: If you set BAR_INDEX to 300. The script will wait for 300 bars to elapse on the current chart before running. This allows the script more time to gather data. Which is needed in order for our dynamic lookback length to never return an error(Dynamic lookback length cant be negative or zero). The lower the timeframe the greater the amount of bars need. For Example if I open up a 30 sec chart I would enter 5000 as my BAR_INDEX since that will provide enough data to ensure the correct calculation of Support and Resistance levels.
Time Frame Inputs
- The indicator has 3 Time Frame Displays where you can choose how SEVERE You want the Supply and Demand Levels. For Example: 1min, 3min, 5min, 15 min Levels, 60 min levels Weekly Levels, etc.....The higher the Timeframe Selected the more SEVERE the Level.
- Use the Amount of time Frames input to increase or limit the amount of time frames that will be displayed onto the chart.
Display Inputs
- The toggle (Trend or Basic) option Lets the trend determine the colors of the Support and Resistance Levels or Basic where the color is strictly based on if its a high or a low ( Trend = HH,HL,LL,LH)
- Toggle options (Close) and (High & Low) creates Support and Resistance Levels using the Lowest close and Highest close or using the Lowest low and Highest high.
Toggle on both or toggle off both in order to use both these values when determining the trend of your chart. For Example this would mean (Price has to close higher then the highest high. Not only make a higher high or a
higher close) and the inverse (Price has to close lower then the lowest low. Not only make a lower low or a lower close)
How Trend Is being Determined ?
(Previous Supply Level > Current Supply Level ) if this statement is true then its s LH so the trend is bearish if this statement is false then its a HH so the trend is bullish
(Previous Demand Level > Current Demand Level ) if this statement is true then its a LL so the trend is bearish if this statement is false then its a HL so the trend is bullish
(Close > Current Supply Level ) if this statement is true technically price made a HH so the trend is bullish
(Close < Current Demand Level ) if this statement is true technically price made a LL so the trend is bearish
- Fully customize how you display and label Market Structure in specific timeframes. Line Length, Line Width, Line Style, Label Distance, Label Size, Label Background Size, and Background Color can all be customized.
- Lastly Is the Trend Chart. To Easily verify the current trend of any timeframes displayed by this indicator toggle on Chart On/Off . You also get the option to change the Chart Position and the size of the Trend Chart
*****The Current charts timeframe has to lower then a month to ensure correct calculation of Supply and Demand Levels*****
How it can be used ?
(Examples of Different ways you can use this indicator) : Easily categorize the severity of each and every Supply or Demand Level in the market (The higher the time frame the stronger the level)
: Quickly Determine the trend of any Timeframe
: Get a consistent view of a market and how different time frames are behaving but just use one chart.
: Take the discretion from hand drawing support and resistance lines out of your trading
: Find and categorize strong levels for potential breakouts
: Trend Analysis, Use multiple time frames to create a narrative based on observable facts from these time frames
: Different Targets to take money off the table
: Use labels to differentiate between different trend line setups
: Find Great places to move your stop loss too.

Parkinson's Historical Volatility Bands [Loxx]Parkinson's Historical Volatility Bands are constructed using:
Average as the middle line.
Upper and lower bands using the Parkinson's historical volatility (instead of "regular" Historical Volatility) for bands calculation.
What is Parkinson's Historical Volatility?
The Parkinson's number, or High Low Range Volatility developed by the physicist, Michael Parkinson in 1980, aims to estimate the Volatility of returns for a random walk using the High and Low in any particular period. IVolatility.com calculates daily Parkinson values. Prices are observed on a fixed time interval: n = 10, 20, 30, 60, 90, 120, 150, 180 days.
SH is stock's High price in t day.
SL is stock's Low price in t day.
High/Low Return (xt^HL) is calculated as the natural logarithm of the ratio of a stock's High price to stock's Low price.
Return:
And Parkinson's number: 1 / (4 * math.log(2)) * 252 / n * Σ (n, t =1) {math.log(Ht/Lt)^2}
An important use of the Parkinson's number is the assessment of the distribution prices during the day as well as a better understanding of the market dynamics. Comparing the Parkinson's number and periodically sampled volatility helps traders understand the tendency towards mean reversion in the market as well as the distribution of stop-losses.
The color of the middle line, unlike the bands colors, has 3 colors. When colors of the bands are the same, then the middle line has the same color, otherwise it's white.
Included
Alerts
Signals
Loxx's Expanded Source Types
Bar coloring

BTC Hashrate ribbonsBTC Hash Rate ribbons / Hash Rate cross
This strategy goes long when BTCs Hash Rate 30 day moving average crosses above the 60 day moving average, signifying that miner capitulation is over and recovery has started.
When the opposite signal is given, which signifies the beginning of miner capitulation, the strategy goes short (or flat, depending on configuration). This is generally considered the most popular Hash Rate related strategy.
The strategy is based on this medium article: medium.com
Thanks to the recent integration of IntoTheBlock data into Tradingview, we can now effortlessly show Hash Rate data on our chart,
keep in mind however, that IntoTheBlock doesn't provide Hash Rate data on timeframes below daily, so this strategy is based used on the daily, weekly or even monthly time frames.
Hash Rate definition:
The Bitcoin hash rate is the number of times per second that computers on the Bitcoin network are hashing data to verify transactions and perform the encryption that secures the network. The hash rate is an indicator of how healthy the Bitcoin network is at any given time, and is driven primarily by difficulty mining and the number of miners. Generally, a high hash rate is considered a good thing.
More precisely, the Bitcoin hash rate is the number of times per second that computers on the Bitcoin network are hashing data to verify transactions and perform the encryption that secures the network.

BTC Hashrate with smoothingBTC Hashrate with smoothing - thanks to the recent integration of IntoTheBlock data into Tradingview, we can now effortlessly show Hashrate data on our chart.
One popular use for Hashrate is to buy when the 30 day moving average crosses above the 60 day moving average, signifying that miner capitulation is over and recovery has started.
Definition
The Bitcoin hash rate is the number of times per second that computers on the Bitcoin network are hashing data to verify transactions and perform the encryption that secures the network. The hash rate is an indicator of how healthy the Bitcoin network is at any given time, and is driven primarily by difficulty mining and the number of miners. Generally, a high hash rate is considered a good thing.
More precisely, the Bitcoin hash rate is the number of times per second that computers on the Bitcoin network are hashing data to verify transactions and perform the encryption that secures the network.

MTF Fair Value Gap Indicator ULTRAFVG Fair Value Gap Indicator
FVG's commonly known as Fair Value Gaps are mostly in use for forex trading, however it’s been widely used in price action trading, even on regular large cap stocks. Think of it as an imbalance area where the price of the stock may actually be under/over valued due to many orders being injected in a short amount of time, ie . a gap caused by an impulse created by the speed of the price movement. In essence, the FVG can become a kind of magnet drawing the price back to that level to attempt to balance out the orders (when? we don't know). Please do research to understand the concept of FVG's.
You can look for an opportunity as price approaches the FVG for entry either long/short because after all, it is an "Area of Interest" so the price will either bounce or blow through the area. No indicator works 100% of the time so take in context as just another indicator. It tends work on larger time frames best.
IMPORTANT TV RELATED LIMITATIONS: You should take the time to understand the following. A MAXIMUM of 500 boxes and labels are allowed, thus if you elect to display many different time frames of FVGs and/or select to not auto delete old Daily FVGs, the oldest FVGs will be deleted and not be seen. Additionally if you are on a smaller chart time frame (1 min), you may not see older FVGs such as Daily ones that occurred and still exist from long ago. This is due to TV limitation of 20,000 candles of history in each chart timeframe. Example: A 1 minute chart supports approximately 14 days worth of data so looking for Daily FVGs would only go back that far, whereas if your chart was set to 5 minutes you'd be able to see 5 times as many, ie . 60 days worth of Daily FVG's. Obviously setting your chart and looking for Daily FVG's would support up to 20,000 days worth.
The Indicator Provides many different features:
*Creation of FVG's for all hours or just during market hours. Currently you can enable FVG’s for the following timeframes: Current chart timeframe, 5Min, 10Min, 15Min, 1Hr, 4Hr, 8Hr, Daily, Weekly, Monthly.
*Text label displays overlaying FVG bands including creation timestamps.
* Bands reflecting FVG's in action (created/deleted) for the current chart time frame, 15min, 1hr, 4hr, 8hr and daily time frames. The FVG's will be overlayed on the chart if enabled.
*Mitigation Action - Normal - When FVG is balanced out by price action, the FVG will disappear. Dynamic - The FVG band will decrease as the price movement eats into it thus only showing the remaining imbalance. None - For those that wish to retain FVG's even if they were mitigated. Half - FVG’s disappear when the price intrudes 50% of the overall FVG band zone.
*Mitigation Type - The elimination or balancing of the FVG is caused by either the candle wick or body passing completely through the FVG.
*Maximum FVGs - A maximum number of FVGs are created for each different enabled time frame (be aware setting a large number could impact system performance).
*All FVG band colors can be customized by the user.
* All FVG bands auto extend to the right.
* Intrusion Alerts - Trading View alerts are supported. You can use the indicator settings to enable an alert if the price intrudes into the FVG zone by a certain percentage. This is not related to mitigation or removal of the FVG, just a warning that price has reached the area of interest.

Net New Highs/Lows (With visible code)Basically the same script than Carusolnsights but without hidding the lines of code...
"This indicator displays the net number of stocks on the Nasdaq Composite making 52-week highs or lows. For instance, if there are 60 new 52-week highs and 20 new 52-week lows, the net number will display 40 net new 52 week highs. This indicator is particularty useful in gauging what the breadth is of the Nasdaq.
Three days of net 52-week highs show a healthy market which is conducive to increasing exposure. This condition is highlighted with a green background.
Three days of net 52-week lows show an unhealthy market which is conducive to reducing exposure. This condition is high|lighted with a red background."
