BollingerBands Strat + pending order alerts via TradingConnectorSoftware part of algotrading is simpler than you think. TradingView is a great place to do this actually. To present it, I'm publishing each of the default strategies you can find in Pinescript editor's "built-in" list with slight modification - I'm only adding 2 lines of code, which will trigger alerts, ready to be forwarded to your broker via TradingConnector and instantly executed there. Alerts added in this script: 14, 17, 20 and 23.
SCRIPT INCLUDES PENDING ORDERS AND ALERTS! Alert will be sent to MetaTrader when order is triggered, but not yet filled. That means if market conditions change and order does not get filled, it needs to be cancelled as well, and there are alerts for that in the script as well.
How it works:
1. TradingView alert fires.
2. TradingConnector catches it and forwards to MetaTrader4/5 you got from your broker.
3. Trade gets executed inside MetaTrader within 1 second of fired alert.
When configuring alert, make sure to select "alert() function calls only" in CreateAlert popup. One alert per ticker is required.
Adding stop-loss, take-profit, trailing-stop, break-even or executing pending orders is also possible. These topics have been covered in other example posts.
This routing works for Forex, indices, stocks, crypto - anything your broker offers via their MetaTrader4 or 5.
Disclaimer: This concept is presented for educational purposes only. Profitable results of trading this strategy are not guaranteed even if the backtest suggests so. By no means this post can be considered a trading advice. You trade at your own risk.
If you are thinking to execute this particular strategy, make sure to find the instrument, settings and timeframe which you like most. You can do this by your own research only.
Cari dalam skrip untuk "弘历投教boll指标代码分析"

Bollinger Bands Z-ScoreBollinger Bands Z-Score Indicator
This indicator transforms the classic Bollinger Bands into a Z-Score oscillator displayed in a separate pane. It standardizes the Bollinger Bands’ basis line by calculating the Z-Score over a user-defined period, allowing you to see how many standard deviations the price deviates from the mean.
Upper and Lower Fixed Lines: These are set at +2 and -2 Z-Score levels, representing common thresholds for overbought and oversold conditions.
Z-Score Oscillator: The normalized Bollinger Bands oscillate smoothly between these fixed boundaries, providing a clearer perspective on volatility extremes.
Z-Score Table: Displayed on the right side, this table shows the current Z-Score value, along with fixed maximum (+2) and minimum (-2) limits, making it easy to track current momentum and volatility in real-time.
Use Cases:
Identify overextended price moves with standardized volatility measures.
Spot potential reversals or continuation setups by observing the Z-Score crossing key levels.
Complement traditional Bollinger Bands analysis with a statistically normalized perspective.
Input Parameters:
Length: The period used for Bollinger Bands and Z-Score calculation.
MA Type: Choose the moving average type for the basis line (SMA, EMA, SMMA, WMA, VWMA).
StdDev: Multiplier for the standard deviation bands.
Z-Score Length: The lookback period used to compute the mean and standard deviation for Z-Score normalization.
This indicator is perfect for traders seeking a statistically sound and visually clear representation of Bollinger Bands volatility and extremes.

Bollinger Bands Multi TFBollinger Bands Multi TF Indicator
Overview
The Bollinger Bands Multi TF Indicator allows traders to overlay two sets of Bollinger Bands from different timeframes onto the same chart. This provides a broader market perspective by helping identify volatility and trend direction across multiple timeframes.
Features
✅ Dual Timeframe Support – Configure Bollinger Bands for two different timeframes (default: 15 min & 5 min).
✅ Customizable Moving Averages – Choose from SMA, EMA, SMMA (RMA), WMA, or VWMA as the basis line for each band.
✅ Dynamic Standard Deviation – Adjust the standard deviation multiplier for each timeframe.
✅ Visual Clarity – Different colors for each Bollinger Band set, with background filling for better visualization.
How to Use
🔹 Use the higher timeframe Bollinger Bands to identify overall trend and key resistance/support levels.
🔹 Use the lower timeframe Bollinger Bands for fine-tuned entry/exit signals within the broader trend.
🔹 A tightening of bands may indicate low volatility, signaling a potential breakout.
🔹 A widening of bands may suggest increased volatility and trend continuation.
Ideal For
📈 Intraday and swing traders looking for multi-timeframe confluence.
📊 Volatility-based traders who use Bollinger Bands for breakouts or reversals.
📍 Any trader wanting a deeper market context beyond a single timeframe.

Bollinger Breakout Strategy with Direction Control [4H crypto]Bollinger Breakout Strategy with Direction Control - User Guide
This strategy leverages Bollinger Bands, RSI, and directional filters to identify potential breakout trading opportunities. It is designed for traders looking to capitalize on significant price movements while maintaining control over trade direction (long, short, or both). Here’s how to use this strategy effectively:
How the Strategy Works
Indicators Used:
Bollinger Bands:
A volatility-based indicator with an upper and lower band around a simple moving average (SMA). The bands expand or contract based on market volatility.
RSI (Relative Strength Index):
Measures momentum to determine overbought or oversold conditions. In this strategy, RSI is used to confirm breakout strength.
Trade Direction Control:
You can select whether to trade:
Long only: Buy positions.
Short only: Sell positions.
Both: Trade in both directions depending on conditions.
Breakout Conditions:
Long Trade:
The price closes above the upper Bollinger Band.
RSI is above the midline (50), confirming upward momentum.
The "Trade Direction" setting allows either "Long" or "Both."
Short Trade:
The price closes below the lower Bollinger Band.
RSI is below the midline (50), confirming downward momentum.
The "Trade Direction" setting allows either "Short" or "Both."
Risk Management:
Stop-Loss:
Long trades: Set at 2% below the entry price.
Short trades: Set at 2% above the entry price.
Take-Profit:
Calculated using a Risk/Reward Ratio (default is 2:1).
Adjust this in the strategy settings.
Inputs and Customization
Key Parameters:
Bollinger Bands Length: Default is 20. Adjust based on the desired sensitivity.
Multiplier: Default is 2.0. Higher values widen the bands; lower values narrow them.
RSI Length: Default is 14, which is standard for RSI.
Risk/Reward Ratio: Default is 2.0. Increase for more aggressive profit targets, decrease for conservative exits.
Trade Direction:
Options: "Long," "Short," or "Both."
Example: Set to "Long" in a bullish market to focus only on buy trades.
How to Use This Strategy
Adding the Strategy:
Paste the script into TradingView’s Pine Editor and add it to your chart.
Setting Parameters:
Adjust the Bollinger Band settings, RSI, and Risk/Reward Ratio to fit the asset and timeframe you're trading.
Analyzing Signals:
Green line (Upper Band): Signals breakout potential for long trades.
Red line (Lower Band): Signals breakout potential for short trades.
Blue line (Basis): Central Bollinger Band (SMA), helpful for understanding price trends.
Testing the Strategy:
Use the Strategy Tester in TradingView to backtest performance on your chosen asset and timeframe.
Optimizing for Assets:
Forex pairs, cryptocurrencies (like BTC), or stocks with high volatility are ideal for this strategy.
Works best on higher timeframes like 4H or Daily.
Best Practices
Combine with Volume: Confirm breakouts with increased volume for higher reliability.
Avoid Sideways Markets: Use additional trend filters (like ADX) to avoid trades in low-volatility conditions.
Optimize Parameters: Regularly adjust the Bollinger Bands multiplier and RSI settings to match the asset's behavior.
By utilizing this strategy, you can effectively trade breakouts while maintaining flexibility in trade direction. Adjust the parameters to match your trading style and market conditions for optimal results!

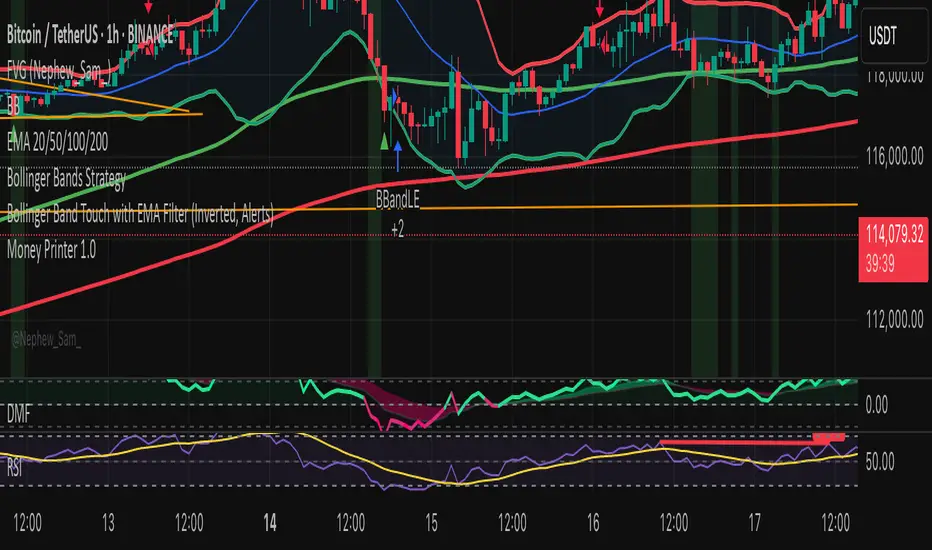
Bollinger Band Touch with EMA Filter (Inverted, Alerts)Bollinger Band Touch with EMA Filter above or below the 100 nd 200 emas


bollingerBandsV2Library "bollingerBandsV2"
Bollinger bands related functions
get_multiple_bollinger_bands(stdv1, stdv2, stdv3, stdv4, stdv5, stdv6, stdv7, length, source)
: Calculates 7 sets of bollinger bands, with 7 different standard deviations
Parameters:
stdv1 (float) : (simple int): standard deviation 1
stdv2 (float) : (simple int): standard deviation 2
stdv3 (float) : (simple int): standard deviation 3
stdv4 (float) : (simple int): standard deviation 4
stdv5 (float) : (simple int): standard deviation 5
stdv6 (float) : (simple int): standard deviation 6
stdv7 (float) : (simple int): standard deviation 7
length (simple int) : (simple int): Length for the bands
source (float) : (simple float): source for the calculation
Returns: : Returns 8 levels plus the range of all the levels.
get_bb_volatility(bb_highest, bb_lowest, ma_length, lookback)
: Provides a volatility indicator based on Bollinger Bands, and indicates wheather the volatility is increasing or decreasing.
Parameters:
bb_highest (float) : (simple float): Top Bollinger Band on which to calculate the range.
bb_lowest (float) : (simple float): Bottom Bollinger Band on which to calculate the range.
ma_length (simple int) : (simple int): Length to use in the smoothing of Bollinger Bands range.
lookback (int) : (simple int): Lookback period to identify a change in the Bollinger Bands range.
Returns: : Returns 8 levels plus the range of all the levels.
get_bbVolatility_data(source, length, stdv1, stdv2, stdv3, stdv4, stdv5, stdv6, stdv7, trend_direction)
: Generates Bollinger Bands Volatility
Parameters:
source (float) : (float): Source for Bollinger Bands
length (simple int) : (int): Length for Bollinger Bands
stdv1 (int) : (int): Standard Deviation 1
stdv2 (int) : (int): Standard Deviation 2
stdv3 (int) : (int): Standard Deviation 3
stdv4 (int) : (int): Standard Deviation 4
stdv5 (int) : (int): Standard Deviation 5
stdv6 (int) : (int): Standard Deviation 6
stdv7 (int) : (int): Standard Deviation 7
trend_direction (string) : (string): Current direction of the trend
Returns: : Returns a map with the levels, plus direction flag and the data table

B.Bands | Augmented | Intra-range | Long-OnlyHere you have the essential trading engine based on Bollinger Bands .
The idea behind is to trade the intra-range of the bands.
How is going to work?
Define which Bollinger Bands we want to use. Classic Bollinger Bands or Augmented Bollinger Bands . Without selecting, the algorithm doesn't show a strategy.
Define the length of the Moving Average and the Standard Deviation by default the classic 20-2.
Define the Bollinger Bands Spread Max Range (Upper-Lower) to be able to determine wheter or not you're in a price range or potential breakout.
Define data source to trigger exit and entry points.
Define profit based on Middle Band or Opposite Band.
Define Stop Loss % and activate Trailing Stop if desired with the percentage required.
Determine if you want to sell only on profit after triggering the entry signal. * Note Stop Loss remains activated.
Choose a date range if you want to study a specific period.
Bear in mind, this is the essential trading engine, open for you to test, try and improve under your requirements. You can determinate when is the ideal market to implement it based on many other indicators. Maybe you wish to change the stop loss settings for ATR, previous low, etc. Totally up to you.
Note the script comes with initial capital, fee % and slippage by deault. This may change for your assets. Make sure you define it in advance.
NOTE: If you trade assets such BTC, you must update the initial capital. By default 5000 (USD) The script doesn't support fraction trading such 0.01BTC.
Will be updated on next version.
Feel free to get in touch if you've got any question.

Breakdown OscillatorThis is an indicator I made, based on the observation that the longer the price action hugs the bottom bollinger band, the greater the danger of a breakdown occurring (price decline). Essentially its a moving average of the difference between close price and the bottom bollinger band, divided by the bottom bollinger band; I like to use 1.5 standard deviations for the 20 day bollinger band. When it crosses below zero there is increased danger of a breakdown, although of course it could turn right around and go up again. In fact if it does turn around sharply from near zero it can be a good time to buy in the context of a pullback within an uptrend. I also have included the 'slope factor' which makes the indicator more negative based on the rate of downward movement of the bollinger moving average (set to 0 to omit this modification). The indicator can be used just for exits or can be used for entry signals when crossing over the green bar if desired. In the example chart you can see the price hitting the lower band or crossing below the 50dMA plenty of times on the way up while the indicator says to hold tight. When the breakdown comes its after a prolonged period of low volatility (band squeeze) on the lower side of the moving average so the signal comes quickly - they won't all be this good of course. This indicator can also be used to help spot potential shorting candidates.
This indicator also works well on weekly charts; I like the 1 standard deviation with 16 to 24 week long period, 6 to 10 week short period and 30 buy level. Your mileage may vary, please do your own research.

Calm before the StormCalm before the Storm - Bollinger Bands Volatility Indicator
What It Does
This indicator identifies and highlights periods of extremely low market volatility by analyzing Bollinger Bands distance. It uses percentile-based analysis to find the "quietest" market periods and highlights them with a gradient background, operating on the premise that low volatility periods often precede significant price movements.
How It Works
Volatility Measurement: Calculates the distance between Bollinger Bands upper and lower boundaries
Percentile Analysis: Analyzes the lowest X% of volatility periods over a configurable lookback period (default: lowest 40% over 200 bars)
Visual Highlighting: Uses gradient opacity to show volatility levels - the lower the volatility, the more opaque the background highlighting
Adaptive Threshold: Automatically calculates what constitutes "low volatility" based on recent market conditions
Who Should Use It
Primary Users:
Breakout Traders: Looking for consolidation periods that may precede significant moves
Options Traders: Seeking low implied volatility periods before volatility expansion
Swing Traders: Identifying accumulation/distribution phases before trend continuation or reversal
Range Traders: Spotting tight trading ranges for mean reversion strategies
Trading Styles:
Volatility-based strategies
Breakout and momentum trading
Options strategies (volatility plays)
Market timing approaches
When to Use It
Market Conditions:
Consolidation Phases: When price is moving sideways with decreasing volatility
Pre-Announcement Periods: Before earnings, economic data, or major events
Market Transitions: During shifts between trending and ranging markets
Low Volume Periods: When institutional participation is reduced
Strategic Applications:
Entry Timing: Wait for volatility compression before positioning for breakouts
Risk Management: Reduce position sizes during highlighted periods (anticipating volatility expansion)
Options Strategy: Sell premium during low volatility, buy during expansion
Multi-Timeframe Analysis: Combine with higher timeframe trends for confluence
Key Benefits
Objective Volatility Measurement: Removes subjectivity from identifying "quiet" markets
Adaptive Analysis: Automatically adjusts to current market conditions
Visual Clarity: Easy-to-interpret gradient highlighting
Customizable Sensitivity: Adjustable percentile thresholds for different trading styles
Best Used In Combination With:
Trend analysis tools
Support/resistance levels
Volume indicators
Momentum oscillators
This indicator is particularly valuable for traders who understand that periods of low volatility are often followed by periods of high volatility, allowing them to position ahead of potential significant price movements.
bollingerBandsLibrary "bollingerBands"
Bollinger bands related functions
get_multiple_bollinger_bands(stdv1, stdv2, stdv3, stdv4, stdv5, stdv6, stdv7, length, source)
Parameters:
stdv1 (int)
stdv2 (int)
stdv3 (int)
stdv4 (int)
stdv5 (int)
stdv6 (int)
stdv7 (int)
length (simple int)
source (float)
get_bb_volatility(bb_highest, bb_lowest, ma_length, lookback)
Parameters:
bb_highest (float)
bb_lowest (float)
ma_length (simple int)
lookback (int)

Coin Bureau BB/EMA/RSI IndicatorThis indicator was inspired by Coin Bureau's How To Spot The Crypto Top video. In the video, Coin Bureau uses Bollinger bands, 7-period EMA and RSI to look for early signs of a top, thus presenting an opportunity to sell.
Using the basic principles found in the video, I've made a tentative indicator as a way to visualise all 3 indicators at once. Alerts will only fire when all 3 criteria are met:
Price closes outside 20-period Bollinger bands
Price closes ~2sd away from 7-period EMA
RSI is overbought or oversold
The indicator will also update in real-time and show when 1, 2 or all 3 conditions are satisfied. Additionally, there is built-in functionality to toggle historical/current alerts and users can set their own bounds for what constitutes a buy or sell alert.
This is just a personal project purely for edutainment purposes and should not be used to make financial decisions. This project is not affiliated with Coin Bureau.
Some caveats:
Using only 7 periods to calculate the standard deviation of price data will not lead to a statistically significant result, thus this figure may have no right being in the script. However, this was more to trial some techniques and to get acquainted with the pine scripting language.
As you can see, there are a lot of false positives. There are moments when the indicator flashes a sell alert only for the price to keep on rising. This is due to the specificity/sensitivity trade-off. The indicator has been tuned to give the optimal sensitivity (the more critical component). These are the best results I could find for this asset in this time frame.

[DIP] Inverse BB HighlightThis indicator allows you to highlight the area outside of the Bollinger Bands in order to draw more attention to it. This is especially useful for those who only trade when we are outside of the bands.
Keep in mind this indicator only works on bars, not on candles.

BB%B StratSimple strategy to go long when price is below a bollinger band %B threshold, or go short when above a threshold.
Trades are closed when BB%B moves back to an opposite threshold.
Intended to be a relatively short time frame trade, usually only a few candles, and probably better on high time frames.
