Ratio with Lag• Ratio = X(T) / Y(T-lag)
• Auto-detects “X/Y” typed in chart search bar
• Plots ratio directly on main chart
• Adds 30-week MA (weekly SMA of the ratio)
• Adds 150-day SMA (daily SMA of the ratio)
Cari dalam skrip untuk "港股央企红利etf"

Market Trend & Breadth Checklist [Kulturdesken]Description
Concept & Inspiration This indicator serves as a disciplined "Pre-Flight Checklist" for swing traders, combining two powerful methodologies into one objective dashboard.
The Foundation (@kulturdesken): The core checklist structure is inspired by the workflow of @kulturdesken, utilizing the QQQE (Nasdaq 100 Equal Weighted Index). By focusing on the equal-weighted index rather than the market-cap weighted QQQ, we avoid distortions caused by mega-cap stocks and gauge the true price trend of the average stock.
The Enhancement (StockBee): To further filter out "hollow rallies," we integrated Pradeep Bonde’s (StockBee) "Market Monitor" logic. This adds a layer of analysis based on the Total US Universe (Wilshire 5000) to ensure market breadth is expanding, not just price.
Why StockBee Logic Was Added While QQQE tells us if the average price is trending, the StockBee logic tells us if the market structure is healthy. We added the "Universe" checks (Total US Market Breadth) because price trends can sometimes be deceptive during low-volume corrections.
By incorporating the Market Monitor concept (specifically checking if the % of stocks above their 50-day Moving Average is rising), this tool acts as a "Traffic Light." It prevents the trader from entering aggressive long positions even if QQQE is green, provided the underlying participation (Market Breadth) is weak.
How It Works (The 7 Checks)
1. Price Momentum (Kulturdesken): QQQE > Rising 5 SMA
Verifies short-term momentum is aggressive (Price > 5SMA) and the 5SMA itself is curling up.
2. Daily Trend Structure: Daily Buy Signal
Verifies a "stacked" bullish alignment where Price > 10 SMA > 20 SMA.
3. Macro Trend: Weekly Buy Signal
Verifies the Weekly Price > 10 WMA > 20 WMA (Weighted Moving Averages).
4. Universe Breadth (StockBee/McClellan): Summation Uptrend
We aggregate Nasdaq + NYSE data to create a "Total Universe" McClellan Summation Index.
Check: Is the Summation Index rising? (Indicates long-term money flow entering the system).
5. Short-Term Thrust: Oscillator Positive
Uses the "Total Universe" McClellan Oscillator.
Check: Is the Oscillator > 0? (Indicates immediate buying pressure is dominant).
6. Leadership: Net Highs/Lows
Check: Are Net New Highs (Highs minus Lows) trending positive?
7. Performance Filter (Manual): Traction Check
A psychological guardrail. If you toggle this off in settings (indicating you are losing money/getting stopped out), the checklist forces a "WAIT" signal, protecting you from overtrading during choppy conditions.
Settings & Customization
Data Feeds: The script is pre-configured with USI (United States Indices) and INDEX tickers to ensure accurate breadth data, but these can be customized in the settings.
Main Ticker: Defaults to QQQE.
Disclaimer: This tool is for educational purposes and market analysis only. It does not constitute financial advice. Past performance is not indicative of future results.

Ichimoku Traffic Lights Go--no go flags for Ichimoku Cloud. For quick scanning thru your watchlist, and good for scanning through timeframes.

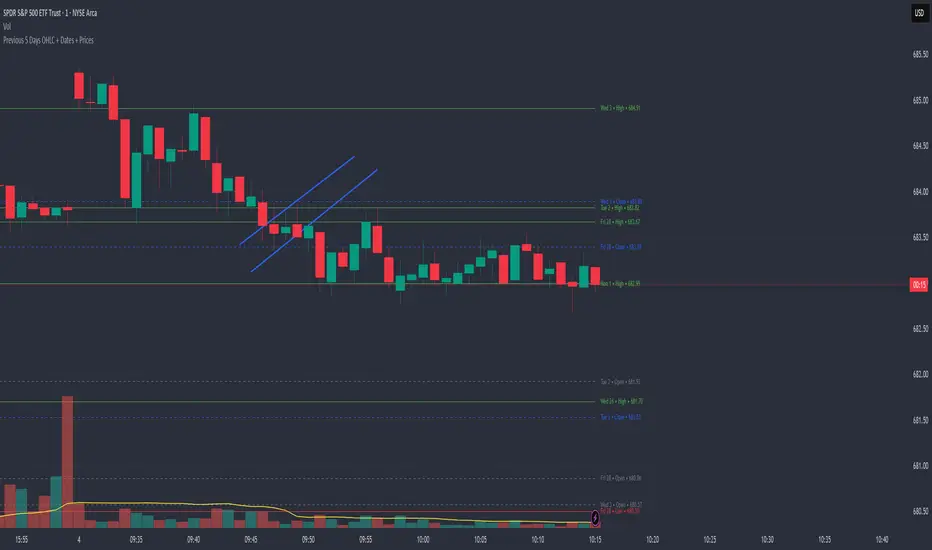
Previous 5 Days OHLC + Dates + PricesTitle: Previous 5 Days OHLC Levels (Extended Lines + Labels)
Description:
This indicator automatically plots the Open, High, Low, and Close (OHLC) levels for the previous 5 trading days. Unlike standard daily separators, this tool extends the lines from their historical origin all the way to the current price bar, allowing traders to instantly see how current price action interacts with recent support and resistance levels.
Key Features:
5-Day Lookback: Automatically fetches and plots OHLC data for the last 5 trading sessions.
Extended Lines: Lines extend to the current bar (Right) to visualize immediate Support/Resistance zones.
Smart Labels: Each line is marked with the Day Name, Date, Type (O/H/L/C), and the Exact Price.
Customizable Positioning: Choose to display labels on the Left (start of the day) or the Right (next to current price) to keep your chart clean.
Toggle Visibility: Individually turn on/off Opens, Closes, Highs, or Lows to focus on the data that matters to your strategy.
How to Use:
Trend Analysis: Use previous Highs and Lows to identify potential breakout or breakdown levels.
Range Trading: Identify where price previously opened or closed to find intraday pivots.
Clean Charting: Use the settings to hide labels or specific lines (e.g., hide Opens/Closes to see only the Daily Range).
Settings:
Label Position: Switch between "Left" (historical origin) and "Right" (current price).
Visibility: Checkboxes to show/hide Open, High, Low, Close, and Text Labels.
Style: Fully customizable colors for each level type.
Technical Note: This script is optimized for performance (Pine Script v6). It uses array management and executes drawing logic only on the last bar to minimize resource usage while maintaining real-time accuracy.
Apex Trend & Liquidity Master with TP/SLThe Apex Trend & Liquidity Master is a systematic trading framework that identifies trend direction and key structural price levels for entry and exit decisions. The system uses a volatility-adaptive trend detection mechanism built on Hull Moving Averages with ATR-based bands to filter consolidation periods and isolate directional moves.
The liquidity detection engine identifies potential reversal zones by marking swing highs and lows that meet statistical significance thresholds. These zones represent areas where institutional order flow previously caused price rejection. Zones remain active until price closes through them, indicating mitigation of the level.
This implementation is an enhanced derivative of the original system with fully automated risk management. Stop losses are calculated using ATR multiples with entry candle wick protection as a minimum threshold, while take profits maintain a fixed 3:1 risk-reward ratio. An additional exit mechanism closes profitable positions when price reaches opposing supply or demand zones, providing early profit-taking at probable reversal points before full target completion.
Entry signals generate only on trend changes when volume exceeds average levels, reducing false breakouts in ranging conditions. The system includes complete position tracking with three distinct exit types: take profit hits, stop loss hits, and profitable zone contact exits. All calculations use confirmed historical data with no forward-looking bias, though supply/demand zone identification operates with a confirmation lag inherent to pivot point detection.

Momentum Structural AnalysisMomentum Structural Analysis (MSA‑style Oscillator)
This indicator implements a simple, MSA‑style momentum oscillator that measures how far price has moved above or below its own long‑term trend on the active timeframe, expressed in percentage terms. Instead of looking at raw price, it "oscillates" price around a timeframe‑appropriate simple moving average (SMA) and plots the percentage distance from that SMA as an orange line around a zero baseline. Zero means price is exactly at its structural trend; positive values mean price is extended above trend; negative values mean it is trading below trend.
The script automatically selects the SMA length based on the chart timeframe:
On daily charts it uses the configurable Daily SMA Length (default 252 trading days, roughly 1 year).
On weekly charts it uses Weekly SMA Length (default 208 weeks).
On monthly charts it uses Monthly SMA Length (default 120 months).
This approach is inspired by the ideas behind Momentum Structural Analysis (MSA), which studies where a market trades relative to long‑term moving averages and then treats the momentum line (the oscillator) as the primary object of analysis. The goal is to highlight structural overbought/oversold conditions and regime changes that are often clearer on momentum than on the raw price chart.
--------------------------------------------------
What the script computes and how it works
For each bar, the indicator:
Chooses an SMA length based on the current timeframe (daily/weekly/monthly).
Calculates the SMA of the close.
Computes the percentage distance:
\text{Diff %} = \frac{\text{Close} - \text{SMA}}{\text{SMA}} \times 100
Plots this Diff % as an orange line, with a dashed horizontal zero line as the base.
This produces a momentum oscillator that oscillates around zero and reflects the "structural" position of price versus its own long‑term mean.
--------------------------------------------------
How to use it on index charts (e.g., NIFTY50)
On indices like NIFTY50, use the indicator to see how stretched the index is versus its structural trend.
Typical uses:
Identify extremes: a). Historically high positive readings can signal euphoric, late‑stage conditions where risk is elevated. b). Deep negative readings can highlight panic/capitulation zones where downside may be exhausted.
Draw structural levels: a). Mark horizontal bands on the oscillator where past turns have occurred (e.g., +15%, −10%, etc. specific to NIFTY50). b). Watch how price behaves when the oscillator revisits these zones: repeated rejections can validate them as structural bounds; clean breaks can indicate a change of regime.
This is not a buy/sell signal generator by itself; it is a framework to understand where the index sits within its long‑term momentum structure and to support risk‑management decisions.
--------------------------------------------------
How to use it on ratio charts
Apply the same indicator to ratio symbols such as NIFTY50/GOLD, BANKNIFTY/NIFTY50, sector vs index, or any spread you plot as a ratio.
On a ratio chart:
The oscillator now measures relative momentum: how far that ratio is above or below its own long‑term mean.
High positive readings = strong outperformance of the numerator vs the denominator (e.g., equities strongly outperforming gold).
Deep negative readings = strong underperformance (e.g., equities structurally lagging gold).
This is very much in the spirit of MSA’s work on spreads between asset classes: it helps visualize major rotations (equities → gold, financials → commodities, etc.) and whether a relative‑performance trend is stretched, reverting, or breaking into a new phase.
--------------------------------------------------
Using multiple timeframes for better decisions
You can stack information across timeframes to get a more robust view:
Monthly : a). Use monthly charts to see secular/structural phases. b). Long multi‑year stretches above or below zero, and large bases or trendline breaks on the monthly oscillator, can mark major bull or bear cycles and big rotations between asset classes.
Weekly : a). Use weekly charts for the primary trend. b). Weekly structures (multi‑month highs/lows, channels, or trendlines on the oscillator) are useful for medium‑term positioning and for confirming or rejecting signals seen on the monthly view.
Daily : a). Use daily charts mainly for timing entries/exits once the higher‑timeframe direction is clear. b). Short‑term extremes on the daily oscillator that align with the larger weekly/monthly structure can offer better‑timed opportunities, while signals that contradict higher‑timeframe momentum are more likely to be noise.
--------------------------------------------------

RVol based Support & Resistance ZonesDescription:
This indicator is designed to help traders identify significant price levels based on institutional volume. It monitors two higher timeframes (defined by the user) simultaneously. When a candle on these higher timeframes exhibits unusually high volume—known as high Relative Volume (RVol)—the indicator automatically draws a "Zone of Interest" box on your current chart.
These zones are defined by:
Up candle : from candle open to low of candle
Down candle : from candle open to high of candle
Key Features:
Multi-Timeframe Monitoring: You can trade on a lower timeframe (e.g., 5-minute) while the indicator monitors the 30-minute and 1-hour charts for volume spikes.
RVol Boxes: Automatically draws boxes extending from high-volume candles.
Up Candles: Box covers Low to Open.
Down Candles: Box covers High to Open.
Live Dashboard: A neat, color-coded table displays the current Volume, Average Volume, and RVol percentage for your watched timeframes.
Real-Time vs. Confirmed: Choose whether to see boxes appear immediately as volume spikes (Live) or only after the candle has closed and confirmed the volume (Candle Close).
Settings Guide:
1. General Settings
Relative Volume Length: The number of past candles used to calculate the "Average Volume." (Default is 20).
Max Days Back to Draw: To keep your chart clean, this limits how far back in history the script looks for high-volume zones. (e.g., set to 5 to only see zones created in the last 5 days).
Draw Mode:
- Live (Real-time): Draws the box immediately if the current developing candle hits the volume threshold. (Note: The box may disappear if the volume average shifts before the candle closes).
- Candle Close: The box only appears once the candle has finished and permanently confirmed the volume spike.
2. Table Settings
Show Info Table: Toggles the dashboard on or off.
Text Size & Position: Customise where the table appears on your screen and how large the text is.
Colours: Fully customisable colours for the Table Header (Top row) and Data Rows (Bottom rows).
3. Timeframe 1 & 2 Settings
You have two identical sections to configure two different timeframes (e.g., 30m and 1H).
Timeframe: The chart interval to monitor (e.g., "30" for 30 minutes, "60" for 1 Hour, "240" for 4 Hours).
Threshold %: The "Trigger" for drawing a box based on relative candle volume in that timeframe.
Example:
100% = Candle Volume is equal to the average volume for the specified timeframe.
200% = Candle Volume is 2x the average volume for the specified timeframe.
300% = Candle Volume is 3x the average volume for the specified timeframe.
Box & Edge Colour: Distinct colours for each timeframe so you can easily tell which timeframe created the zone.

RS Rating Multi-TimeframeRS Rating Multi-Timeframe (IBD-Style Relative Strength)
Short Description:
IBD-style Relative Strength Rating (1-99) comparing any stock's performance vs the S&P 500 across multiple timeframes.
Full Description:
Overview
This indicator calculates an IBD-style Relative Strength (RS) Rating that measures a stock's price performance relative to the S&P 500 over the past 12 months. The rating scale ranges from 1 (weakest) to 99 (strongest), telling you how a stock ranks against all other stocks in terms of relative performance.
How It Works
The RS Rating uses a weighted formula based on quarterly performance:
Last 63 days (1 quarter): 40% weight
Last 126 days (2 quarters): 20% weight
Last 189 days (3 quarters): 20% weight
Last 252 days (4 quarters): 20% weight
This weighting emphasizes recent performance while still accounting for longer-term strength.
Rating Interpretation
90-99 (Elite): Top 10% of all stocks - exceptional relative strength
80-89 (Excellent): Top 20% - strong leadership candidates
50-79 (Average): Middle of the pack
30-49 (Below Average): Underperforming the market
1-29 (Weak): Bottom 30% - avoid or consider shorting
Features
Multi-Timeframe: Works on any timeframe from 1-hour to weekly (always uses daily data for calculation)
Moving Average: Optional EMA or SMA of the RS Rating to smooth signals
Visual Zones: Color-coded zones for quick identification of strength/weakness
Signal Markers: Triangles appear when RS crosses key levels (80 and 30)
Info Table: Displays current RS Rating, change, MA value, and raw score
Alerts: Built-in alerts for key crossover events
Settings
Show Moving Average: Toggle MA line on/off
MA Length: Period for the moving average (default: 10)
MA Type: Choose between EMA or SMA
Benchmark Index: Change the comparison index (default: SP:SPX)
Show Rating Table: Toggle the info table on/off
How To Use
Buy candidates: Look for stocks with RS Rating above 80, ideally rising
Avoid: Stocks with RS Rating below 30 or falling rapidly
Confirmation: Use RS above its moving average as additional confirmation
Divergence: Watch for RS making new highs before price (bullish) or new lows before price (bearish)
Credits
RS Rating calculation methodology inspired by Investor's Business Daily (IBD) and adapted from Fred6724's RS Rating script. Percentile calibration based on analysis of ~6,600 US stocks.
Tags: relative strength, RS rating, IBD, momentum, CAN SLIM, benchmark, SPX, market leaders, stock ranking
Category: Relative Strength

Echo Chamber [theUltimator5]The Echo Chamber - When history repeats, maybe you should listen.
Ever had that eerie feeling you've seen this exact price action before? The Echo Chamber doesn't just give you déjà vu—it mathematically proves it, scales it, and projects what happened next.
📖 WHAT IT DOES
The Echo Chamber is an advanced pattern recognition tool that scans your chart's history to find segments that closely match your current price action. But here's where it gets interesting: it doesn't just find similar patterns - It expands and contracts the time window to create a uniquely scaled fractal. Patterns don't always follow the same timeframe, but they do follow similar patterns.
Using a custom correlation analysis algorithm combined with flexible time-scaling, this indicator:
Finds historical price segments that mirror your current market structure
Scales and overlays them perfectly onto your current chart
Projects forward what happened AFTER that historical match
Gives you a visual "echo" from the past with a glimpse into potential futures
══════════════════════════════
HOW TO USE IT
This indicator starts off in manual mode, which means that YOU, the user, can select the point in time that you want to project from. Simply click on a point in time to set the starting value.
Once you select your point in time, the indicator will automatically plot the chosen historical chart pattern and correlation over the current chart and project the price forwards based on how the chart looked in the past. If you want to change the point in time, you can update it from the settings, or drag the point on the chart over to a new position.
You can manually select any point in time, and the chart will quickly update with the new pattern. A correlation will be shown in a table alongside the date/timestamp of the selected point in time.
You can switch to auto mode, which will automatically search out the best-fit pattern over a defined lookback range and plot the past/future projection for you without having to manually select a point in time at all. It simply finds the best fit for you.
You can change the scale factor by adjusting multiplication and division variables to find time-scaled fractal patterns.
══════════════════════════════
🎯 KEY FEATURES
Two Operating Modes:
🔧 MANUAL MODE - Select any historical point and see how it correlates with current price action in real-time. Perfect for:
• Analyzing specific past events (crashes, rallies, consolidations)
• Testing historical patterns against current conditions
• Educational analysis of market structure repetition
🤖 AUTO MODE - It automatically scans through your lookback period to find the single best-correlated historical match. Ideal for:
• Quick pattern discovery
• Systematic trading approach
• Unbiased pattern recognition
Time Warp Technology:
The time warp feature expands and compresses the correlation window to provide a custom fractal so you can analyze windows of time that don't necessarily match the current chart.
💡 *Example: Multiplier=3, Divisor=2 gives you a 1.5x time stretch—perfect for finding patterns that played out 50% slower than current price action.*
Drawing Modes:
Scale Only : Pure vertical scaling—matches price range while maintaining temporal alignment at bar 0
Rotate & Scale : Advanced geometric transformation that anchors both the start AND end points, creating a rotated fit that matches your current segment's slope and range
Visual Components:
🟠 Orange Overlay : The historical match, perfectly scaled to your current price action
🟣 Purple Projection : What happened NEXT after that historical pattern (dotted line into the future)
📦 Highlight Boxes : Shows you exactly where in history these patterns came from
📊 Live Correlation Table : Real-time correlation coefficient with color-coded strength indicator
══════════════════════════════
⚙️ PARAMETERS EXPLAINED
Correlation Window Length (20) : How many bars to match. Smaller = more precise matches but noisier. Larger = broader patterns but fewer matches.
Note: if this value is too high in auto mode, the script may time out from computational overload.
Multiplication Factor : Historical time multiplier. 2 = sample every 2nd bar from history. Higher values find slower historical patterns.
Division Factor : Historical time divisor applied after multiplication. Final sample rate = (Length × Factor) ÷ Divisor, rounded down.
Lookback Range : How far back to search for patterns. More history = better chance of finding matches but slower performance.
Note: if this value is too high in auto mode, the script may time out from computational overload.
Future Projection Length : How many bars forward to project from the historical match. Your crystal ball's focal length.
══════════════════════════════
💼 TRADING APPLICATIONS
Trend Continuation/Reversal :
If the purple projection continues the current trend, that's your historical confirmation. If it reverses, you've found a potential turning point that's happened before under similar conditions.
Support/Resistance Validation :
Does the projection respect your S/R levels? History suggests those levels matter. Does it break through? You've found historical precedent for a breakout.
Time-Based Exits :
The projection shows not just WHERE price might go, but WHEN. Use it to anticipate timing of moves.
Multi-Timeframe Analysis :
Use time compression to overlay higher timeframe patterns onto lower timeframes. See daily patterns on hourly charts, weekly on daily, etc.
Pattern Education :
In Manual Mode, study how specific historical events correlate with current conditions. Build your pattern recognition library.
══════════════════════════════
📊 CORRELATION TABLE
The table shows your correlation coefficient as a percentage:
80-100%: Extremely strong correlation—history is practically repeating
60-80%: Strong correlation—significant similarity
40-60%: Moderate correlation—some structural similarity
20-40%: Weak correlation—limited similarity
0-20%: Very weak correlation—essentially random match
-20-40%: Weak inverse correlation
-40-60%: Moderate inverse correlation
-60-80%: Strong inverse correlation
-80-100%: Extremely strong inverse correlation—history is practically inverting
**Important**: The correlation measures SHAPE similarity, not price level. An 85% correlation means the price movements follow a very similar pattern, regardless of whether prices are higher or lower.
══════════════════════════════
⚠️ IMPORTANT DISCLAIMERS
- Past performance does NOT guarantee future results (but it sure is interesting to study)
- High correlation doesn't mean causation—markets are complex adaptive systems
- Use this as ONE tool in your analytical toolkit, not a standalone trading system
- The projection is what HAPPENED after a similar pattern in the past, not a prediction
- Always use proper risk management regardless of what the Echo Chamber suggests
══════════════════════════════
🎓 PRO TIPS
1. Start with Auto Mode to find high-correlation matches, then switch to Manual Mode to study why that period was similar
2. Experiment with time warping on different timeframes—a 2x factor on a daily chart lets you see weekly patterns
3. Watch for correlation decay —if correlation drops sharply after the match, current conditions are diverging from history
4. Combine with volume —check if volume patterns also match
5. Use "Rotate & Scale" mode when the current trend angle differs from the historical match
6. Increase lookback range to 500-1000+ on daily/weekly charts for finding rare historical parallels
══════════════════════════════
🔧 TECHNICAL NOTES
- Uses Pearson correlation coefficient for pattern matching
- Implements range-based scaling to normalize different price levels
- Rotation mode uses linear interpolation for geometric transformation
- All calculations are performed on close prices
- Boxes highlight actual historical bar ranges (high/low)
- Maximum of 500 lines and 500 boxes for performance optimization

S&P Options Patterns Detector (6-20 Candles)Pattern detector for S&P options. Detects alerts for bullish or bearish signals for any stock in S&P 500

FUSED 9.5 INSTITUTIONAL [FINAL] - AgTradezInstitutional style Indicator that gives you trend direction, MSS, with Tp levels and much more.

OBV + WaveTrend Volume Scalper [GratefulFutures]This script is a combination script of three different strategies that provides buy and sell signals based on the change of volume with momentum confirmations.
Sources used:
This script relies on the outstanding scripts of the great script writer LazyBear: LazyBear
The following scripts were used in this publication:
1. A modified "On-Balance Volume Oscillator" modified from LazyBear's original script:
2. Wavetrend Oscillator with crosses, Author: LazyBear
3. Squeeze Momentum Oscillator, Author: LazyBear
This script functions based on the following criteria being true:
1. On balance volume oscillator turning from negative to positive (buy) or positive to negative (sell)
2. Squeeze Momentum value is increasing (buy) or decreasing (sell)
3. Wavetrend 1 (wt1) is greater than wavetrend 2 (wt2) (buy)/ Wavetrend 1 (wt1) is less than wavetrend 2 (wt2) (sell)
By combining these factors the indicator is able to signal exactly when net buying turns to net selling (OBV) and when this change is most advantageous to continue based on the momentum and price action of the underlying asset (SQMOMO and Wavetrend).
This allows you to pair volume and price action for a powerful tool to identify where price will reverse or continue providing exceptional entries for short term trades, especially when combined with other aspects such as support and resistance, or volume profile.
How to use:
Simply adjust the settings to your preference and read the given signals as generated.
Settings
There are multiple ways to tune the signals generated. It is set standard for my preferred use on a 1 minute chart.
OBV Oscillator Settings
The first 4 dropdowns in the Inputs section tune the On Balance Volume Oscillator (OBVO) portion of the indicator. You can choose if you want it to calculate based on close, open, high, low, or other value.
The most impactful in the entire settings is going to be the length and smoothing of the OBVO EMA. Making this number lower increasing the sensitivity to changes in volume, making the signals come quicker but is more susceptible to quick fluctuations. A value of between (5-20) is reasonable for the OBVO EMA length. There is a separate smoothing factor titled OBV Smoothing Length and below that, OBV Smoothing Type , a value of (2) is standard with "SMA" for smoothing type with a value of between 2-10 being reasonable. You may also play with these values to see what you like for your trading style.
Wavetrend Settings
The next 3 options are to modify the wavetrend portion of the indicator. I do not modify these from standard, and feel that they work appropriately on all time frames at the following values: n1 length (10), n2 length (20), Wavetrend Signal SMA length (4)
Squeeze Momentum Settings
The following 5 options through the end modify the Squeeze momentum portion of the indicator. The only one that modifies the signals generated is the KC Length , Making this number lower increasing the sensitivity to changes in price action, making the signals come quicker but is more susceptible to quick fluctuations. A value of between (18-25) is reasonable for KC Length .
Style Setting
You may select if you want to see the buy and sell signals. The following 5 options Raw OBV Osc through Squeeze Momentum allow you to see where each specific requirement was met, posted as a vertical line, but for live use it is recommended to turn all of these vertical lines off and only use the buy and sell signals.
Time Frames:
While this script is most effective on shorter time frames (1 minute for scalping and daytrading) it is also viable to use it on longer timeframes, due to the nature of its components being independent of time frame.
Examples of use - (Green and red vertical lines are for visualization purpose and are not part of the script)
SPY 1 Minute (Factory Settings):
SPX 15 minutes (Factory Settings):
Considerations
This script is meant primarily for short term trading, trades on the basis of seconds to minutes primarily. While they can be a good indication of volume lining up with momentum, it is always wise to use them in combination with other factors such as support, resistance, market structure, volume levels, or the many other techniques out there...
As Always... Happy Trading.
-Not_A_Mad_Scientist (GreatfulFutures Trade University)

PVV StochRSI TrendAnother Price, Volume, Volatility Trend indicator. This one has an RSI factor to it.
Have fun and change what you want.
Adjusting the inputs to the timeframe traded on is encouraged.

PVV Trend Line (Lower Study)Doing my best to create something is uses rate of change on the Price, volume, and volatility. I know it's not perfect, but it does it's job for me.
It's useful use it, if it's not then don't.
You will need to change settings for the time frame you want to trade on.
5 DMA Entry Plus5 DMA Entry Plus - Multi-Strategy Entry Signal Indicator
Overview:
The 5 DMA Entry Plus is a versatile entry signal indicator that combines multiple proven technical analysis methods to identify potential buy opportunities. This indicator is designed to be highly customizable, allowing traders to toggle between different entry strategies or combine them for confluence-based entries.
Key Features:
1. Multiple Entry Strategy Options:
Default Close Above Entry: Triggers when price closes above the 5-day moving average (with optional HMA filter)
Green Wick Candle Signal: Identifies bullish candles where the wick pierces above key moving averages, indicating rejection of lower prices
5DMA Zero/Upslope Entry: Generates signals when the 5DMA is flat or sloping upward, confirming momentum
HMA Cross Entry: Triggers when price crosses above the Hull Moving Average, a responsive momentum indicator
2. Adaptive HMA Filter:
Toggle the HMA (Hull Moving Average) filter on or off to adjust signal sensitivity. When enabled, price must be above both the 5DMA and 20 HMA for confirmation. When disabled, only the 5DMA is required, generating more frequent signals.
3. Smart Reset Logic:
The indicator includes intelligent reset functionality that prevents signal spam. Once an entry signal is generated, no new signals appear until price closes below the moving average(s), ensuring clean, actionable entries without clutter.
4. Visual Components:
5-Day Moving Average (Blue Line): The primary trend reference
20-Period Hull Moving Average (Orange Line): Fast-responding momentum filter
Buy Signals (Green Labels): Clear "Buy" labels appear below candles when entry conditions are met
Built-in Alerts: Set up custom alerts to be notified when entry signals trigger
Customizable Inputs:
Use HMA Filter: Enable/disable the 20 HMA confirmation requirement
Include Green Wick Candle Signal: Toggle wick-based entry detection
Use 5DMA Zero/Upslope Entry: Enable slope-based entry logic
Use HMA Cross Entry: Enable HMA crossover signals
HMA Length: Adjust the Hull Moving Average period (default: 20)
Best Use Cases:
Swing trading on daily and 4-hour timeframes
Identifying pullback entries in uptrends
Combining multiple confirmation signals for high-probability setups
Filtering entries in momentum-based strategies
Strategy Flexibility:
This indicator allows you to use each entry method independently or combine multiple methods for confluence. Test different combinations to find what works best for your trading style and the instruments you trade.
Risk Management Note:
This indicator identifies potential entry points but does not provide exit signals or stop-loss levels. Always use proper risk management and combine with your own exit strategy.

QQQ Quant Power STRATEGY v13.3 (Ribbon + TQQQ Specs)1. The Quant Engine (Data Processing)
Weighted Scoring: It assigns specific weights to stocks (e.g., NVDA gets 8.5% weight, TXN gets 1.0%).
Z-Score Pressure: It calculates how "unusual" the current buying/selling pressure is compared to the average (Standard Deviation).
Alignment Bonus: It boosts the "Conviction Score" if Mega Caps (Top 8) and Large Caps (Next 12) are moving in the same direction.
2. The Dashboard (Mission Control)
The dashboard gives you an X-Ray view of the market:
Main Status: Tells you if the market is BULLISH, BEARISH, or CHOP (Sit Out).
Conviction %: A probability score (0-99%). Higher = Safer trade.
Breadth: Counts how many of the top 20 stocks are above their EMA.
Chop Logic: If Breadth is mixed (between 6 and 14 stocks above EMA), it declares "CHOP" and blocks trades.
Mega/Large Net: Shows the net buying/selling pressure for each group.
3. Visuals
Pressure Line: The line on the chart isn't just a Moving Average; it's the Net Pressure of the 20 stocks pushing price up or down.
Conviction Ribbon: The squares at the bottom of the screen.
🟩 Green: High Probability Long (>77%).
🟥 Red: High Probability Short (>77%).
⬜ Gray: Low Conviction / Holding.
4. Strategy Logic (Automated Trading)
Entry: Enters when the "Basket" of stocks is aligned (Bull/Bear Pressure) AND the Conviction Score is high (>77%).
Exit: Closes the trade if Conviction drops (Signal fades) or hits a Hard Stop Loss.
Time Filters: Includes strict trading windows (e.g., No trading during lunch 12-1pm, closes all positions on Friday).
Summary
This is a Market Breadth & Momentum Strategy. It assumes that QQQ cannot sustain a trend unless its underlying components (NVDA, AAPL, etc.) are pushing it. It filters out "fake moves" where QQQ moves but the components don't support it.

REMS - Deep SynergyThis is a more flexible version of the REMS Synergy indicator. Like other indicators in the REMS family, it builds upon the foundations assessing the relationships between RSI, EMAs, MACDs, and Stochastic RSI across multiple timeframes. Designed to help traders identify less frequent, but high probability entries across 2 time frames. Uses 3 levels of confluence indicators for both long and short moves.
Features 3 levels of confluence across 2 timeframes. All 3 levels allow filtering of any combination of REMS filters. Features more options and customization than previous REMS Synergy.
Includes VWAP and 4 EMAs as optional visual representations.
Includes 'Enhanced Candles' than can colour code candlesticks for better visual identification. (off by default)
Originally designed with 5 minute and 2 minute timeframes in mind, and pairs well with REMS First Strike and/or REMS Snap Shot indicators.
This version features no hard-coded inputs and allows for more freedom than previous version. With the added flexibility comes the ability for the indicator to be more easily stacked.

Trend Flip Exhaustion SignalsThis Pine Script is designed to generate buy and short trading signals based on a combination of technical indicators. It calculates fast and slow EMAs, RSI, a linear regression channel, and a simplified TTM squeeze histogram to measure momentum.
- Short signals trigger when price is above both EMAs, near the upper regression channel, momentum is weakening, volume is fading, and RSI is overbought.
- Buy signals trigger when price is below both EMAs, near the lower regression channel, momentum is strengthening, volume is surging, and RSI is oversold.
- Signals are displayed as labels anchored to price bars (with optional plotshape arrows for backup).
- The script also plots the EMAs and regression channel for visual context.
In short - it’s a trend‑following entry tool that highlights potential exhaustion points for shorts and potential reversals for buys, with clear on‑chart markers to guide decision‑making.

Multi-Factor Trend Confluence Indicator (PTP V4)Disclaimer: This is a technical analysis tool for educational and informational purposes only. It does not constitute investment advice, financial solicitation, or a recommendation to buy or sell any security or instrument. Trading involves significant risk, and past performance is not indicative of future results. Use at your own risk.
KEY Features and Strategic Methodology
This is a comprehensive trend and confluence indicator built on multiple factors to identify potential pullbacks within an established trend.
• Core Trend Filter: Uses a long-term EMA to confirm the overall market bias.
• Fibonacci Pullback Logic: Identifies potential low-risk entry zones by calculating a 61.8% Fibonacci Retracement over a user-defined lookback period.
• Multi-Factor Confluence: A signal is generated only when the price touches the Fib zone AND the following factors align (You can edit the script to adjust the confluence conditions.):
o RSI is above 50.
o Positive DI is above Negative DI (DMI Bullish Crossover).
o Price is above the fast EMA.
• Consecutive Signal Counter: Includes a unique counter that highlights bars where the confluence conditions have been met for a minimum number of consecutive candles (4 by default), aiding in the validation of strong momentum entries.
• Moving Average Visualization: Plots and color-fills 10 WMA, 21 EMA, 42 EMA, and 200 EMA to provide a full market context and visualize momentum shifts.
1. Short-Term Momentum (WMA10 vs. EMA42 Fill)
This fill area highlights immediate price acceleration and momentum shifts:
• Green Fill (Bullish Momentum): WMA10 > EMA42.
• Red Fill (Bearish Momentum): WMA10 < EMA42.
2. Long-Term Market Context (EMA200 vs. EMA42 Fill)
This fill area defines the dominant backdrop of the market, essential for strategic positioning:
• Green Fill (Bullish Context): EMA200 < EMA42.
• Red Fill (Bearish Context): EMA200 > EMA42.
EMA200 Line Coloration
The EMA200 line color itself also provides a visual cue for the long-term context:
• Red Line: When EMA200 > EMA42 (Bearish Context).
• Green Line: When EMA200 < EMA42 (Bullish Context).
Customization
The indicator is highly customizable via the settings menu, allowing users to adjust lengths for EMA, RSI, DMI, Pivot Points, and the specific parameters for the Fibonacci Retracement Strategy (tolerance and candle limits).

S&P 500 Scalper Pro [Trend + MACD] 5 minfor scalping 5 min S&P on 5 min chart put SL on 20 min ma and take 2:1 risk

Current Price Label & Line📊 Current Price Label & Line Indicator
Keep track of the current price with style! This indicator displays a clean, customizable price label alongside a horizontal reference line that makes it easy to see exactly where price is trading at a glance.
✨ Key Features
The indicator creates a dynamic label that shows the current closing price with precision formatting matched to your chart's tick size. Position the label anywhere you want using the bar offset control, allowing you to keep it visible without cluttering your price action. The accompanying horizontal line extends across your chart, providing a clear visual reference point.
🎨 Full Customization
Make it match your trading style perfectly. Choose from five font sizes ranging from tiny to huge, ensuring readability on any screen size or chart layout. Customize the label background color, text color, and line color independently to match your chart theme or personal preferences. You can even adjust the line width for subtle or bold emphasis depending on your needs.
🎯 Perfect For
Day traders who need quick price reference at a glance. Chart analysts who want clean, professional-looking price markers. Anyone who prefers a minimalist approach to price tracking without unnecessary indicators cluttering their workspace.
💡 How It Works
The indicator automatically updates with each new bar, keeping your price display current. The label floats at your chosen offset from the current bar, while the line extends left across your chart history. Everything is clean, efficient, and designed to stay out of your way while providing essential information.
Simple to set up, easy to customize, and lightweight on your chart. Add it once and adjust the settings to your preference—it just works!

VB Finviz-style MTF Screener📊 VB Multi-Timeframe Stock Screener (Daily + 4H + 1H)
A structured, high-signal stock screener that blends Daily fundamentals, 4H trend confirmation, and 1H entry timing to surface strong trading opportunities with institutional discipline.
🟦 1. Daily Screener — Core Stock Selection
All fundamental and structural filters run strictly on Daily data for maximum stability and signal quality.
Daily filters include:
📈 Average Volume & Relative Volume
💲 Minimum Price Threshold
📊 Beta vs SPY
🏢 Market Cap (Billions)
🔥 ATR Liquidity Filter
🧱 Float Requirements
📘 Price Above Daily SMA50
🚀 Minimum Gap-Up Condition
This layer acts like a Finviz-style engine, identifying stocks worth trading before momentum or timing is considered.
🟩 2. 4H Trend Confirmation — Momentum Check
Once a stock passes the Daily screen, the 4-hour timeframe validates trend strength:
🔼 Price above 4H MA
📈 MA pointing upward
This removes structurally good stocks that are not in a healthy trend.
🟧 3. 1H Entry Alignment — Timing Layer
The Hourly timeframe refines near-term timing:
🔼 Price above 1H MA
📉 Short-term upward movement detected
This step ensures the stock isn’t just good on paper—it’s moving now.
🧪 MTF Debug Table (Your Transparency Engine)
A live diagnostic table shows:
All Daily values
All 4H checks
All 1H checks
Exact PASS/FAIL per condition
Perfect for tuning thresholds or understanding why a ticker qualifies or fails.
🎯 Who This Screener Is For
Swing traders
Momentum/trend traders
Systematic and rules-based traders
Traders who want clean, multi-timeframe alignment
By combining Daily fundamentals, 4H trend structure, and 1H momentum, this screener filters the market down to the stocks that are strong, aligned, and ready.

Intraday Day-Trade Scanner//@version=5
indicator("Intraday Day-Trade Scanner", overlay=true)
// ----- Inputs -----
minFloat = input.int(10000000, "Min Float")
maxFloat = input.int(20000000, "Max Float")
minPrice = input.float(3, "Min Price")
maxPrice = input.float(50, "Max Price")
minRVOL = input.float(1.5, "Min Relative Volume")
minAtrPct = input.float(1.0, "Min ATR %")
maxAtrPct = input.float(5.0, "Max ATR %")
useLong = input.bool(true, "Long scan (above VWAP)")
useShort = input.bool(false, "Short scan (below VWAP)")
// ----- Data -----
float = request.financial(syminfo.tickerid, "FLOAT", "FQ")
avgVol = ta.sma(volume, 20)
rvol = volume / avgVol
atr = ta.atr(14)
atrPct = (atr / close) * 100
// VWAP
vwap = ta.vwap(close)
// ----- Conditions -----
floatOK = float >= minFloat and float <= maxFloat
priceOK = close >= minPrice and close <= maxPrice
rvolOK = rvol >= minRVOL
atrOK = atrPct >= minAtrPct and atrPct <= maxAtrPct
longOK = useLong and close > vwap
shortOK = useShort and close < vwap
qualified = floatOK and priceOK and rvolOK and atrOK and (longOK or shortOK)
// ----- Plot label on chart -----
plotshape(qualified,title ="Qualified Stock", text="SCAN HIT", style=shape.labelup, size=size.small, color=color.new(color.green, 0))
// ----- Alerts -----
alertcondition(qualified, title="Trade Candidate Found", message="This stock meets your day-trade scan criteria!")
