Gradient Money Flow Divergence DetectorThe "Gradient Money Flow Divergence Detector" indicator has several use cases for traders. Let's explore the main use cases:
1. Money Flow Analysis : The primary purpose of this indicator is to analyze money flow in a particular asset. The Money Flow Index (MFI) is a momentum indicator that uses price and volume data to assess the buying and selling pressure in a market. Traders can use the MFI to identify overbought and oversold conditions, potential trend reversals, and divergences between the MFI and price movement.
2. Divergence Detection : The indicator incorporates a divergence detection mechanism for multiple timeframes (micro, sub-mid, mid, and macro). Divergence occurs when the price movement and an indicator (MFI in this case) move in opposite directions, signaling a potential shift in the price trend. Traders can use divergences to anticipate trend reversals or trend continuation.
3. Multiple Lookback Analysis : The indicator allows traders to assess divergences and money flow trends across various time horizons by providing divergence detection for different lengths. This can help traders identify confluence areas where divergences align on multiple timeframes, strengthening the potential signal.
4. Overbought and Oversold Conditions : The indicator plots horizontal lines at MFI levels of 20, 50, and 80. These levels can be used to identify overbought (MFI above 80) and oversold (MFI below 20) conditions. Traders may look for potential reversal signals when the MFI reaches extreme levels.
5. Confirmation of Price Trends : The indicator's color gradient visually represents the MFI value, which can help traders confirm the strength of a prevailing price trend. For example, an uptrend with a consistently high MFI might suggest strong buying pressure, reinforcing the bullish bias.
6. Fine-Tuning Divergence Signals : Traders can adjust the parameters of divergence detection (e.g., pivot points, rangeUpper, rangeLower) to fine-tune the sensitivity of the divergence signals. This allows for greater customization based on individual trading preferences.
7. Combining with Other Indicators : The indicator can be used in combination with other technical indicators or price action analysis to strengthen trading decisions. For example, traders may look for divergences in conjunction with support and resistance levels or chart patterns to increase the probability of successful trades.
8. Trend Reversal Confirmation : When a divergence is detected, it may indicate a potential trend reversal. Traders can use other confirmation signals (e.g., candlestick patterns, trendline breaks) to validate the reversal before making trading decisions.
Remember that no single indicator should be used in isolation, and it's essential to use the indicator in combination with other confirmations such as support and resistance, and analysis methods for more robust trading strategies. Additionally, thorough backtesting and practice in a demo environment are recommended before using the indicator in live trading.
Cari dalam skrip untuk "股价在8元左右净利润为正市值小于80亿的热门股票有哪些"

Pseudo-Entropy Oscillator with Standard Deviation (modified)Intuition: The Pseudo-Entropy Oscillator with Standard Deviation (PEO_SD) was created to provide traders with a way to analyze market momentum and potential reversals. It combines the concepts of entropy, standard deviation, and moving averages to offer insights into market behavior.The oscillator's core idea is to measure the pseudo-entropy of the market using standard deviation. Pseudo-entropy refers to the degree of disorder or randomness in the price data. By calculating the standard deviation of the closing prices over a specified period, the oscillator quantifies the market's volatility.To enhance the usefulness of the pseudo-entropy measurement, the oscillator incorporates moving averages. The entropy delta is calculated by applying momentum analysis to the pseudo-entropy values. This helps identify short-term changes in the entropy, indicating shifts in market sentiment or momentum.The oscillator further smoothes the pseudo-entropy values by calculating the simple moving average (SMA) over a specified length. This helps filter out noise and provides a clearer representation of the market's overall momentum.
------------------------------------------------------------------------------------------------------------------------------------------------------------------------------------------------------------------------------------------------
The "Pseudo-Entropy Oscillator with Standard Deviation" (PEO_SD) is a custom indicator designed to help traders analyze market momentum and potential reversal points. It can be applied to various markets like stocks, commodities, forex, or cryptocurrencies. By using this indicator, you can gain insights into the market's behavior and make more informed trading decisions.
The PEO_SD indicator plots three lines on your chart: the fast pseudo-entropy line, the medium pseudo-entropy line, and the slow pseudo-entropy line. Each line represents the combined pseudo-entropy values, which are calculated using standard deviation and moving averages.
The lines are color-coded for easy identification. The fast line is represented by blue, the medium line by yellow, and the slow line by red. Additionally, three horizontal reference lines are plotted: the mid line (at 50), the lower bound (at 20), and the upper bound (at 80).
To use this indicator effectively, you can observe the interactions of the lines with the reference lines. For example, when any of the lines cross above the mid line, it might indicate a bullish signal, suggesting an upward price movement. Conversely, a crossover below the mid line could be a bearish signal, indicating a potential downward price movement. If the lines reach the upper bound, it might suggest that the market is overbought, and a reversal could be imminent. Conversely, reaching the lower bound may indicate that the market is oversold, possibly leading to a price reversal.
By applying the PEO_SD indicator and studying the lines' movements, you can gain valuable insights into market momentum, identify potential reversal points, and make more informed trading decisions.

adaptive_mfi
█ Description
Money flow an indexed value-based price and volume for the specified input length (lookback period). In summary, a momentum indicator that attempt to measure the flow of money (identify buying/selling pressure) through the asset within a specified period of time. MFI will oscillate between 0 to 100, oftentimes comprehend the analysis with oversold (20) or overbought (80) level, and a divergence that spotted to signaling a further change in trend/direction. As similar to many other indicators that use length (commonly a fixed value) as an input parameter, can be optimized by applied an adaptive filter (Ehlers), to solve the measuring cycle period. In this indicator, the adaptive measure of dominant cycle as an input parameter for the lookback period/n, will be applied to the money flow index.
█ Money Flow Index
mfi = 100 - (100/(1 + money_flow_ratio))
where:
n = int(dominant_cycle)
money_flow_ratio = n positive raw_money_flow / n negative raw_money_flow
raw_money_flow = typical_price * volume
typical_price = hlc3
█ Feature
The indicator will have a specified default parameter of: hp_period = 48; source = ohlc4
Horizontal line indicates positive/negative money flow
MFI Color Scheme: Solid; Normalized

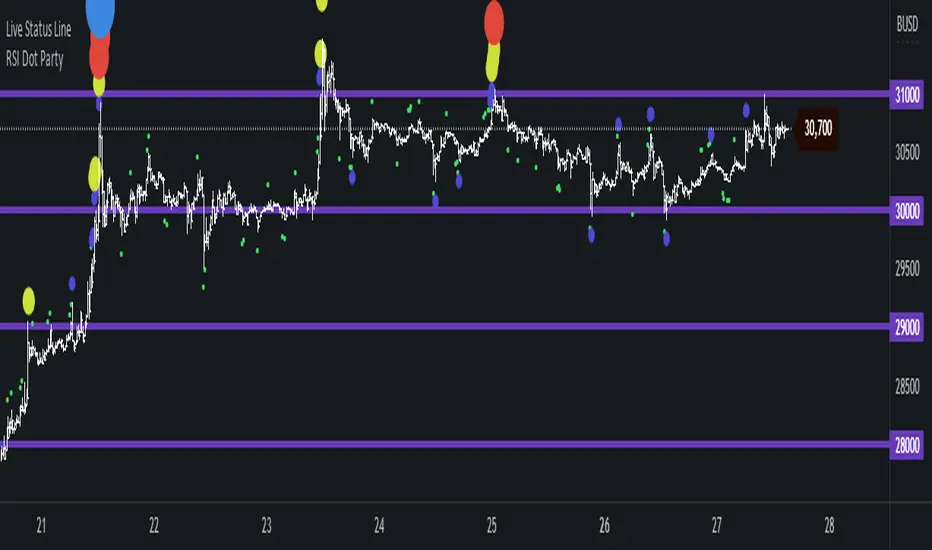
RSI Dot Party - All Lengths From 1 To 120The RSI Dot Party indicator displays all RSI lengths from 1 to 120 as different colored dots on the chart.
🔶 Purpose
Show the reversal point of price action to time entries and exits.
🔶 USAGE
When a dot displays it is a indication of the reversal of the price/trend. The larger the dot the more likely it is to reverse.
The Default settings generates dots for extreme cases where the RSI is over = 90 or under = 10 for every RSI length in the range of 1-120.
Example if the RSI of length 1 or 2 or 3 or 4 or ... or 15 or 16 or 17 or ... or 80 or 81 or 82 or ... if any of does RSI crosses a boundary a dot is shown.
A boundary is the over/under the RSI oscillates in.
Customize the settings until the dots match up with the high and lows of past price action.
🔶 SETTINGS
🔹 Source
Source 1: Is the First Source RSI is calculated from
Source 2: Is the Second Source RSI is calculated from
🔹 Meta Settings
Hours back to draw: To speed up the script calculate it only draws a set number of hours back, default is 300 hours back in time to draw then it cuts off.
Show Dots: Show or disable dots
Show Bar Color: Color the bars for each RSI incident
Filter Cross: Filters and only shows dots when the RSI crosses above or bellow a boundary. If not all candles above or bellow the boundaries will display a dot.
Dots Location Absolute: Instead of showing the dots above or bellow the candle, the dots will show up on the top and bottom of the window.
🔹 7 RSI Groups
There are a total of 7 RSI colors.
Range Very Tiny: Default Color Green
Range Tiny: Default Color Purple
Range Small: Default Color Yellow
Range Normal: Default Color Red
Range Large: Default Color Blue
Range Huge: Default Color Dark Purple
Range Very Huge: Default Color White
🔹 RSI Group Settings
Hi/Low Color: Change the Color of that group.
Start/End: The Start and End range of this RSI color. Example if start = 5 and end = 10 the RSI of 5,6,7,8,9,10 will be displayed on the chart for that color, if any of does RSI goes above or bellow the boundary a dot is displayed on that candle.
Delay: The RSI needs to be above or bellow a boundary for x number of candles before displaying a dot. For example if delay = 2 and the RSI is over = 70 for 2 candles then it will display a dot.
Under/Over: Boundaries that indicate when to draw a dot, if over = 70 and RSI crosses above 70 a dot is displayed.
🔹 Show
Section that allows you to disable RSI grounds you dont want to see, this also removes them from the alert signal generated.
Show Low: Show or disable Low RSI dots
Show High: Show or disable High RSI dots
🔶 ALERTS
Alert for all New RSIs Dots Created in real time
The alert generated depends on what groups are showing or not, if the green group is disabled for example the alert will not be generated.
🔶 Warning
When a dot shows up it can continue moving. For example if a purple dot shows itself above a 15 minute candle, if that candle/price continue to extend up the dot will move up with it.
Dots can also disappear occasionally if the RSI moves in and out of a boundary within that candles life span.
🔶 Community
I hope you guys find this useful, if you have any questions or feature requests leave me a comment! Take care :D
SmartVPSGTitle: Identifying Volume Spikes, Price Movements and Gap Ups: A TradingView Script
Introduction:
In the world of trading, identifying volume spikes and price movements can provide valuable insights into market trends and potential trading opportunities. In this article, we'll explore a TradingView script that helps traders visualize volume spikes, price up moves with volume spikes, and gap-up days on their charts.
Detecting Price Up Moves:
The script starts by calculating price up moves. It compares the current day's closing price with the previous day's closing price and checks if it has increased by 3% or more. This helps traders spot significant upward price movements.
Detecting Volume Spurts:
Next, the script focuses on detecting volume spikes, which are often associated with increased market activity and potential trading opportunities. It compares the current day's volume with the highest volume of the previous nine sessions. If the current volume exceeds all the volumes of the previous nine sessions, it is considered a volume spurt.
Example:
Let's consider a hypothetical scenario where we have the following volume data for a stock:
Day 1: 100,000
Day 2: 80,000
Day 3: 120,000
Day 4: 150,000
Day 5: 200,000
Day 6: 90,000
Day 7: 110,000
Day 8: 130,000
Day 9: 140,000
Day 10: 250,000 (current day)
To determine if there is a volume spurt on Day 10, the script compares the current day's volume (250,000) with the highest volume of the previous nine sessions. In this case, the highest volume among the previous nine sessions is 200,000 (on Day 5). Since the current day's volume (250,000) exceeds the highest volume of the previous nine sessions (200,000), it is considered a volume spurt.
Identifying Gap-Up Days:
Gap-up days occur when the market opens significantly higher than the previous day's close. To identify these days, the script compares the current day's low price with the previous day's high price. If the low price is greater than the previous day's high, it is marked as a gap-up day.
Visualizing the Findings:
To provide a clear visual representation of the identified patterns, the script uses different shapes and colors. First, it plots small red dots above the candles whenever a volume spurt is detected. These dots help traders quickly identify periods of increased volume activity.
For price up moves with volume spikes, the script utilizes blue triangular shapes below the candles. This allows traders to pinpoint instances where both price and volume are showing positive signs, indicating potential bullish movements.
Additionally, the script incorporates green candles to represent gap-up days. These candles help traders recognize days when the market opens with a significant upward gap, suggesting a potential shift in market sentiment.
Conclusion:
The TradingView script discussed in this article provides traders with a visual representation of volume spikes , price up moves with volume spikes , and gap-up days . By incorporating these visual cues into their analysis, traders can gain valuable insights into market trends and potential trading opportunities.
Remember, this script should be used for educational and informational purposes only and does not serve as financial advice or recommendations. Traders are encouraged to customize and modify the script according to their specific trading strategies and risk tolerance.
Share this script with other traders on TradingView to enhance their chart analysis and trading decisions.
PS: This TradingView script is designed to work specifically on the daily timeframe (daily candles). It calculates and identifies volume spurts based on the volume data of the daily timeframe. Since it is designed for the daily timeframe, it may not produce accurate results or work as intended on other timeframes.

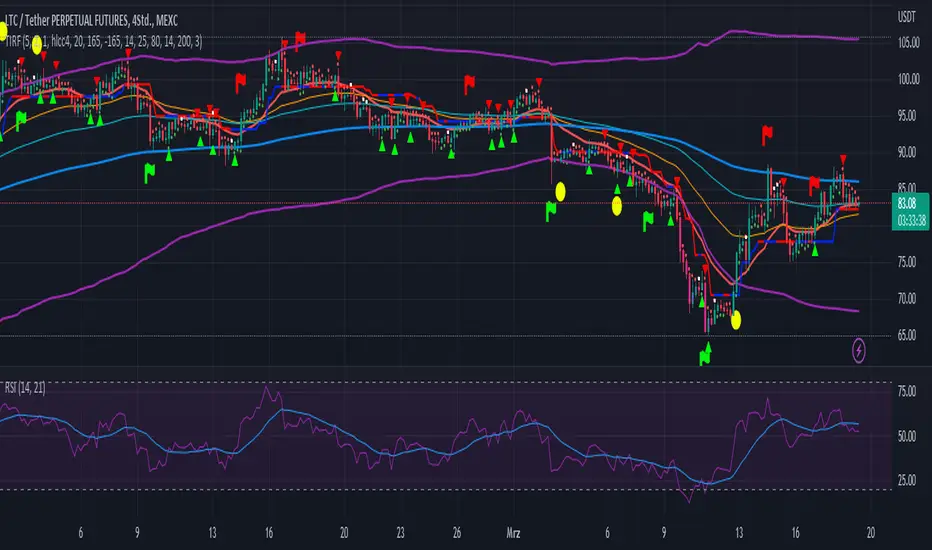
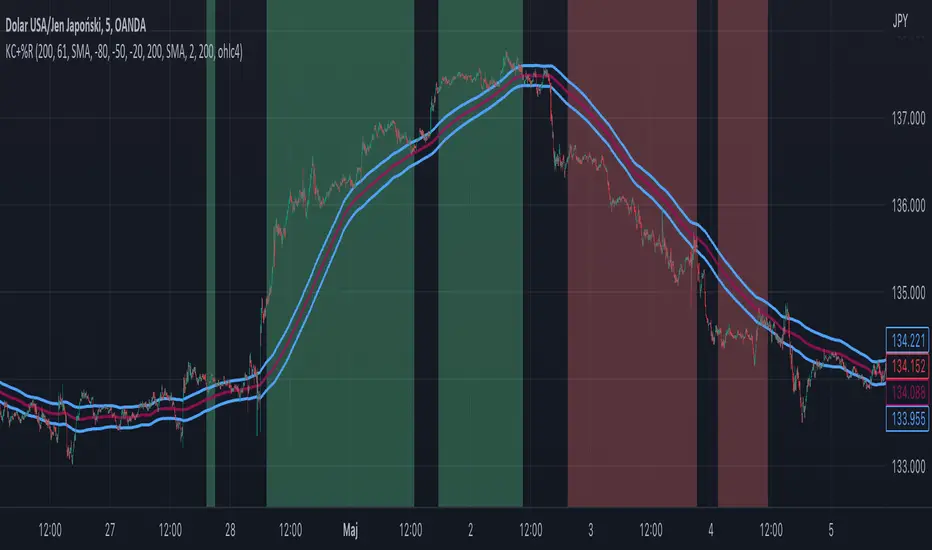
Williams %R + Keltner chanells - indicator (AS)1)INDICATOR ---This indicator is a combination of Keltner channels and Williams %R.
It measures trend using these two indicators.
When Williams %R is overbought(above upper line (default=-20)) and Keltner lower line is below price indicator shows uptrend (green).
When Williams %R is oversold(below lower line (default=-80)) and Keltner upper line is above price indicator shows downtrend (red) .
Can be turned into a strategy quickly.
2) CALCULATIONS:
Keltner basis is a choosen type of moving average and upper line is basis + (ATR*multiplier). Same with lower but minus instead of plus so basiss – (ATR*multiplier)
Second indicator
Williams %R reflects the level of the close relative to the highest high for the lookback period
3)PLS-HELP-----Looking for tips, ideas, sets of parameters, markets and timeframes, rules for strategy -------OVERALL -every advice you can have
4) SIGNALS-----buy signal is when price is above upper KC and Williams %R is above OVB(-20). Short is exactly the other way around
5) CUSTOMIZATION:
-%R-------LENGTH/SMOOTHING/TYPE SMOOTHING MA
-%R-------OVS/MID/OVB -(MID-no use for now)
-KC -------LENGTH/TYPE OF MAIN MA
-KC-------MULTIPLIER,ATR LENGTH
-OTHER--LENGTH/TYPE OF MA - (for signal filters, not used for now)
-OTHER--SOURCE -src of calculations
-OTHER--OVERLAY - plots %R values for debugging etc(ON by default)
6)WARNING - do not use this indicator on its own for trading
7)ENJOY
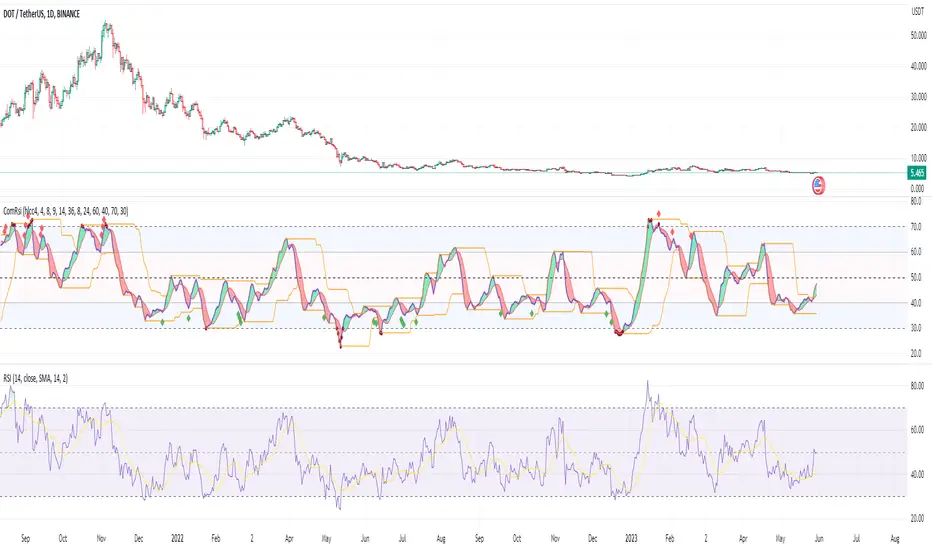
Composite RSIOne issue with the famouse RSI indicator is that it is too sensitive in some cases and thus, might give false signals if we are eager to use those signals.
If we increase the length of the RSI, it might give too few signals which is not ideal as well.
This Composite RSI indicator was created to utilize the RSI strength, using 3 RSIs (with different length) in combination to give less signal than the original one.
You can use it like a normal RSI indicator:
- Try to find the entry when the RSI is in the overbought (RSI >= 70) and oversold (RSI <= 30) areas
- Use bullish divergence and bearish divergence on the RSI itself to signal your trade
In the example chart, I included a built-in RSI as well so you that you can compare the original one and the Composite RSI indicator.
Some extra features:
- Simple bullish and bearish divergences detection.
- Mark the RSI with green circle(s) when it is extremely overbought (over 80) and oversold (under 20)
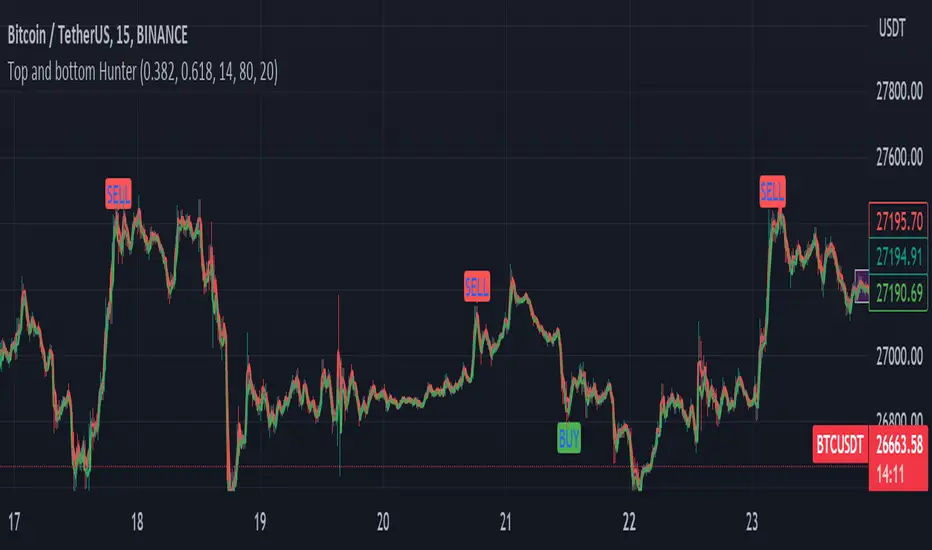
Fib top and bottom Hunter - No Repaint "Top and bottom Hunter" indicator combines two popular technical analysis tools, Fibonacci retracement levels and the Relative Strength Index (RSI), to identify potential trading opportunities in the market.
Fibonacci retracement levels are based on the Fibonacci sequence, a mathematical series where each number is the sum of the two preceding ones. In trading, Fibonacci retracement levels are used to identify potential support and resistance levels based on the recent price action. The indicator uses two Fibonacci levels, fib_0 and fib_1, which are typically set to 0.382 and 0.618, respectively. These levels represent common retracement ratios.
To calculate the Fibonacci levels, the indicator considers the highest and lowest prices within a specified range, typically the highest and lowest of the last two bars. It calculates the fib_range, which is the difference between the highest and lowest prices. Then, fib_level_0 and fib_level_1 are determined by subtracting the Fibonacci ratios from the highest price.
The RSI is a momentum oscillator that measures the speed and change of price movements. It helps identify overbought and oversold conditions in the market. The RSI parameters used in this indicator are rsi_length (length of the RSI calculation), rsi_overbought (upper threshold indicating overbought conditions), and rsi_oversold (lower threshold indicating oversold conditions). The RSI value is calculated based on the closing prices.
The indicator generates buy and sell signals based on specific conditions:
Buy Condition: A buy signal is triggered when the RSI crosses above the oversold level (rsi_oversold) and the closing price is higher than fib_level_1. This indicates a potential reversal or bounce from the Fibonacci support level.
Sell Condition: A sell signal is triggered when the RSI crosses below the overbought level (rsi_overbought) and the closing price is lower than fib_level_0. This suggests a potential reversal or pullback from the Fibonacci resistance level.
In summary, this indicator combines the power of Fibonacci retracement levels and the RSI to identify potential trading opportunities. It helps traders find confluence between the Fibonacci support or resistance levels and the RSI readings, indicating potential trend reversals or bounces. Traders can use this information to make informed decisions about entering or exiting positions in the market.
Feel free to change the settings for what works best for you and use this with other confluences. I personally use RSI overbought and oversold values as 80 and 20
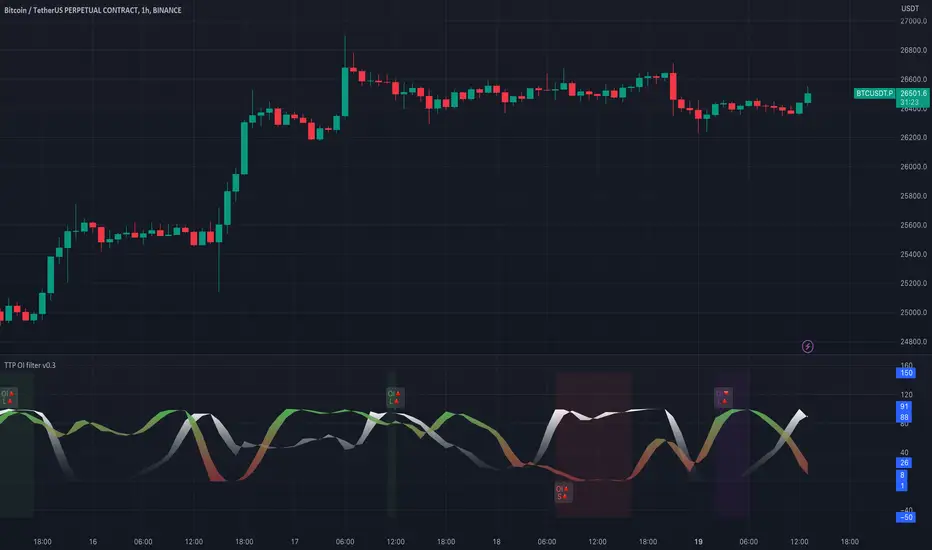
TTP OI + LS signal filterThis oscillator helps filtering specific conditions in the market based on open interest (OI) and the ratio of longs and shorts (LS) for crypto assets.
Currently it works with BINANCE:BTCUSDT.P but soon I'll be adding support for more assets.
It flags areas of interest like:
- Too many longs, too many shorts in the market
- Open interest too high or too low
It accepts an external signal as a source in which case filters can be applied to the original signal. For example the external signal might trigger and plot a 1 when RSI break below 70. By connecting such signal with this oscillator you'll be able to only pass-through the ones that occur when any of the areas of interest mentioned above are also valid.
If both filter are applied it acts as an OR. For example, if too many longs and too many shorts are active, it will pass through the signal in either condition.
The results of the original signal filtered is printed to be able to later use it in any external backtester strategy that accepts external sources too.
If external source signal is disabled it will trigger any time the combined filters are returning true.
Open interest and the ratio of longs/shorts is considered too high whenever the stochastic RSI calculation of the OI or ratio LS reaches a level above 80 and too low when below 20
The ratio of long/shorts is calculated by dividing the ratio of longs vs shorts from BITFINEX:BTCUSDLONGS and BITFINEX:BTCUSDSHORTS
RSI, SRSI, MACD and DMI cross - Open source codeHello,
I'm a passionate trader who has spent years studying technical analysis and exploring different trading strategies. Through my research, I've come to realize that certain indicators are essential tools for conducting accurate market analysis and identifying profitable trading opportunities. In particular, I've found that the RSI, SRSI, MACD cross, and Di cross indicators are crucial for my trading success.
Detailed explanation:
The RSI is a momentum indicator that measures the strength of price movements. It is calculated by comparing the average of gains and losses over a certain period of time. In this indicator, the RSI is calculated based on the close price with a length of 14 periods.
The Stochastic RSI is a combination of the Stochastic Oscillator and the RSI. It is used to identify overbought and oversold conditions of the market. In this indicator, the Stochastic RSI is calculated based on the RSI with a length of 14 periods.
The MACD is a trend-following momentum indicator that shows the relationship between two moving averages of prices. It consists of two lines, the MACD line and the signal line, which are used to generate buy and sell signals. In this indicator, the MACD is calculated based on the close price with fast and slow lengths of 12 and 26 periods, respectively, and a signal length of 9 periods.
The DMI is a trend-following indicator that measures the strength of directional movement in the market. It consists of three lines, the Positive Directional Indicator (+DI), the Negative Directional Indicator (-DI), and the Average Directional Index (ADX), which are used to generate buy and sell signals. In this indicator, the DMI is calculated with a length of 14 periods and an ADX smoothing of 14 periods.
The indicator generates buy signals when certain conditions are met for each of these indicators.
1) For the RSI, a buy signal is generated when the RSI is below or equal to 35 and the Stochastic RSI %K is below or equal to 15, or when the RSI is below or equal to 28 the Stochastic RSI %K is below or equal to 15 or when the RSI is below or equal to 25 and the Stochastic RSI %K is below or equal to 10 or when the RSI is below or equal to 28.
2) For the MACD, a buy signal is generated when the MACD line is below 0, there is a change in the histogram from negative to positive, the MACD line and histogram are negative in the previous period, and the current histogram value is greater than 0.
3) For the DMI, a buy signal is generated when the Positive Directional Indicator (+DI) crosses above the Negative Directional Indicator (-DI), and the -DI is less than the +DI.
The indicator generates sell signals when certain conditions are met for each of these indicators:
1) For the RSI, a sell signal is generated when the RSI is above or equal to 75 and the Stochastic RSI %K is above or equal to 85, or when the RSI is above or equal to 80 and the Stochastic RSI %K is above or equal to 85, or when the RSI is above or equal to 85 and the Stochastic RSI %K is above or equal to 90 or when the RSI is above or equal to 82.
2)For the MACD, a sell signal is generated when the MACD line is above 0, there is a change in the histogram from positive to negative, the MACD line and histogram are positive in the previous period, and the current histogram value is less than the previous histogram value. On the other hand, a buy signal is generated when the MACD line is below 0, there is a change in the histogram from negative to positive, the MACD line and histogram are negative in the previous period, and the current histogram value is greater than the previous histogram value.
3)For the DMI a bearish signal is generated when plusDI crosses above minusDI, indicating that bulls are losing strength and bears are taking control.
The indicator uses a combination of these four indicators to generate potential buy and sell signals. The buy signals are generated when RSI and SRSI values are in oversold conditions, while sell signals are generated when RSI and SRSI values are in overbought conditions. The indicator also uses MACD crossovers and DMI crossovers to generate additional buy and sell signals.
When a signal is strong?
The use of multiple signals within a specific timeframe can increase the accuracy and reliability of the signals generated by this indicator. It is recommended to look for at least two signals within a range of 5-8 candles in order to increase the probability of a successful trade.
Why it's original?
1) There is no indicator in the library that combine all of these indicators and give you a 360 view
2)The combination of the RSI, Stochastic RSI, MACD, and DMI indicators in a single script it's unique and not available in the libray.
3)The specific parameters and conditions used to calculate the signals may be unique and not found in other scripts or libraries.
4)The use of plotshape() to plot the signals as shapes on the chart may be unique compared to other scripts that simply plot lines or bars to indicate signals.
5)The use of alertcondition() to trigger alerts based on the signals may be unique compared to other scripts that do not have custom alert functionality.
Keep attention!
It is important to note that no trading indicator or strategy is foolproof, and there is always a risk of losses in trading. While this indicator may provide useful information for making conclusions, it should not be used as the sole basis for making trading decisions. Traders should always use proper risk management techniques and consider multiple factors when making trading decisions.
Support me:)
If you find this new indicator helpful in your trading analysis, I would greatly appreciate your support! Please consider giving it a like, leaving feedback, or sharing it with your trading network. Your engagement will not only help me improve this tool but will also help other traders discover it and benefit from its features. Thank you for your support!

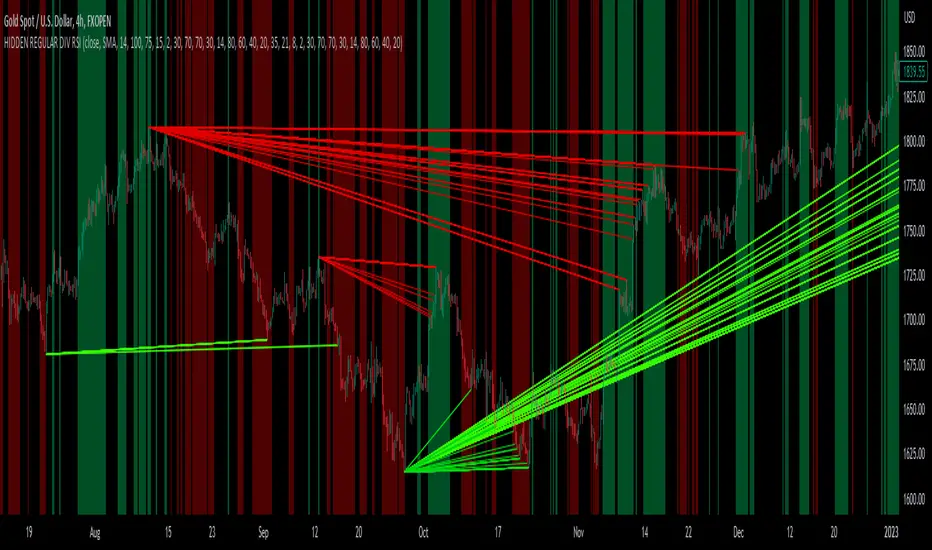
hidden & regular rsi divergenceThis is a divergence indicator that draws regular and hidden divergences based on the Zigzag indicator and RSI indicator. There are two degrees of Zigzag. So, in each Zigzag degree, there are two types of regular divergences and one type of hidden divergence.
👉(The logic is written in case of a bearish regular divergence. The opposite will apply for a bullish one.)
Type 1 of regular divergence (Logic 1):
Zigzag has to form a higher high. The highest RSI within both Zigzag legs must form lower highs, but the RSI values which are exactly at the Zigzag highs should not form lower highs.
Type 2 of regular divergence (Logic 2):
Zigzag has to form a higher high. The highest RSI within both Zigzag legs must form lower highs, and the RSI values which are exactly at the Zigzag highs should form lower highs.
👉(The logic is written in case of a bearish hidden divergence. The opposite will apply for a bullish one.)
Zigzag has to form a lower high. The highest RSI within both Zigzag legs must form higher highs.
👉There is also a filter that will be applied to all the divergences. It only shows the divergences whose corresponding RSI value was above/below a level (overbought level/oversold level).
Logic for regular divergences:
Bearish regular divergence's first high's (leftmost) RSI value should be greater than or equal to 70.
Bullish regular divergence's first low's (leftmost) RSI value should be less than or equal to 30.
Logic for hidden divergences:
Bearish hidden divergence's second high's (rightmost) RSI value should be greater than or equal to 70.
Bullish hidden divergence's second low's (rightmost) RSI value should be less than or equal to 30.
👉There is another feature also. This indicator colors the background based on whether the RSI is in a bullish or bearish range.
If it's within 80-60, the background will be colored green (this means that RSI is in a bullish range).
If it's within 40-20, the background will be colored red (this means that RSI is in a bearish range).
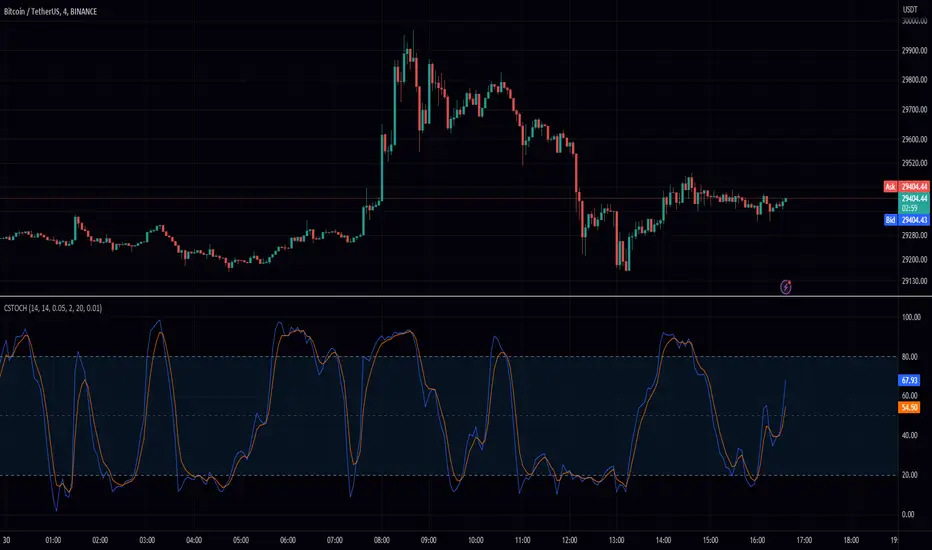
Stochastic Chebyshev Smoothed With Zero Lag SmoothingFast and Smooth Stochastic Oscillator with Zero Lag
Introduction
In this post, we will discuss a custom implementation of a Stochastic Oscillator that not only smooths the signal but also does so without introducing any noticeable lag. This is a remarkable achievement, as it allows for a fast Stochastic Oscillator that is less prone to false signals without being slow and sluggish.
We will go through the code step by step, explaining the various functions and the overall structure of the code.
First, let's start with a brief overview of the Stochastic Oscillator and the problem it addresses.
Background
The Stochastic Oscillator is a momentum indicator used in technical analysis to determine potential overbought or oversold conditions in an asset's price. It compares the closing price of an asset to its price range over a specified period. However, the Stochastic Oscillator is susceptible to false signals due to its sensitivity to price movements. This is where our custom implementation comes in, offering a smoother signal without noticeable lag, thus reducing the number of false signals.
Despite its popularity and widespread use in technical analysis, the Stochastic Oscillator has its share of drawbacks. While it is a price scaler that allows for easier comparisons across different assets and timeframes, it is also known for generating false signals, which can lead to poor trading decisions. In this section, we will delve deeper into the limitations of the Stochastic Oscillator and discuss the challenges associated with smoothing to mitigate its drawbacks.
Limitations of the Stochastic Oscillator
False Signals: The primary issue with the Stochastic Oscillator is its tendency to produce false signals. Since it is a momentum indicator, it reacts to short-term price movements, which can lead to frequent overbought and oversold signals that do not necessarily indicate a trend reversal. This can result in traders entering or exiting positions prematurely, incurring losses or missing out on potential gains.
Sensitivity to Market Noise: The Stochastic Oscillator is highly sensitive to market noise, which can create erratic signals in volatile markets. This sensitivity can make it difficult for traders to discern between genuine trend reversals and temporary fluctuations.
Lack of Predictive Power: Although the Stochastic Oscillator can help identify potential overbought and oversold conditions, it does not provide any information about the future direction or strength of a trend. As a result, it is often used in conjunction with other technical analysis tools to improve its predictive power.
Challenges of Smoothing the Stochastic Oscillator
To address the limitations of the Stochastic Oscillator, many traders attempt to smooth the indicator by applying various techniques. However, these approaches are not without their own set of challenges:
Trade-off between Smoothing and Responsiveness: The process of smoothing the Stochastic Oscillator inherently involves reducing its sensitivity to price movements. While this can help eliminate false signals, it can also result in a less responsive indicator, which may not react quickly enough to genuine trend reversals. This trade-off can make it challenging to find the optimal balance between smoothing and responsiveness.
Increased Complexity: Smoothing techniques often involve the use of additional mathematical functions and algorithms, which can increase the complexity of the indicator. This can make it more difficult for traders to understand and interpret the signals generated by the smoothed Stochastic Oscillator.
Lagging Signals: Some smoothing methods, such as moving averages, can introduce a time lag into the Stochastic Oscillator's signals. This can result in late entry or exit points, potentially reducing the profitability of a trading strategy based on the smoothed indicator.
Overfitting: In an attempt to eliminate false signals, traders may over-optimize their smoothing parameters, resulting in a Stochastic Oscillator that is overfitted to historical data. This can lead to poor performance in real-time trading, as the overfitted indicator may not accurately reflect the dynamics of the current market.
In our custom implementation of the Stochastic Oscillator, we used a combination of Chebyshev Type I Moving Average and zero-lag Gaussian-weighted moving average filters to address the indicator's limitations while preserving its responsiveness. In this section, we will discuss the reasons behind selecting these specific filters and the advantages of using the Chebyshev filter for our purpose.
Filter Selection
Chebyshev Type I Moving Average: The Chebyshev filter was chosen for its ability to provide a smoother signal without sacrificing much responsiveness. This filter is designed to minimize the maximum error between the original and the filtered signal within a specific frequency range, effectively reducing noise while preserving the overall shape of the signal. The Chebyshev Type I Moving Average achieves this by allowing a specified amount of ripple in the passband, resulting in a more aggressive filter roll-off and better noise reduction compared to other filters, such as the Butterworth filter.
Zero-lag Gaussian-weighted Moving Average: To further improve the Stochastic Oscillator's performance without introducing noticeable lag, we used the zero-lag Gaussian-weighted moving average (GWMA) filter. This filter combines the benefits of a Gaussian-weighted moving average, which prioritizes recent data points by assigning them higher weights, with a zero-lag approach that minimizes the time delay in the filtered signal. The result is a smoother signal that is less prone to false signals and is more responsive than traditional moving average filters.
Advantages of the Chebyshev Filter
Effective Noise Reduction: The primary advantage of the Chebyshev filter is its ability to effectively reduce noise in the Stochastic Oscillator signal. By minimizing the maximum error within a specified frequency range, the Chebyshev filter suppresses short-term fluctuations that can lead to false signals while preserving the overall trend.
Customizable Ripple Factor: The Chebyshev Type I Moving Average allows for a customizable ripple factor, enabling traders to fine-tune the filter's aggressiveness in reducing noise. This flexibility allows for better adaptability to different market conditions and trading styles.
Responsiveness: Despite its effective noise reduction, the Chebyshev filter remains relatively responsive compared to other smoothing filters. This responsiveness allows for more accurate detection of genuine trend reversals, making it a suitable choice for our custom Stochastic Oscillator implementation.
Compatibility with Zero-lag Techniques: The Chebyshev filter can be effectively combined with zero-lag techniques, such as the Gaussian-weighted moving average filter used in our custom implementation. This combination results in a Stochastic Oscillator that is both smooth and responsive, with minimal lag.
Code Overview
The code begins with defining custom mathematical functions for hyperbolic sine, cosine, and their inverse functions. These functions will be used later in the code for smoothing purposes.
Next, the gaussian_weight function is defined, which calculates the Gaussian weight for a given 'k' and 'smooth_per'. The zero_lag_gwma function calculates the zero-lag moving average with Gaussian weights. This function is used to create a Gaussian-weighted moving average with minimal lag.
The chebyshevI function is an implementation of the Chebyshev Type I Moving Average, which is used for smoothing the Stochastic Oscillator. This function takes the source value (src), length of the moving average (len), and the ripple factor (ripple) as input parameters.
The main part of the code starts by defining input parameters for K and D smoothing and ripple values. The Stochastic Oscillator is calculated using the ta.stoch function with Chebyshev smoothed inputs for close, high, and low. The result is further smoothed using the zero-lag Gaussian-weighted moving average function (zero_lag_gwma).
Finally, the lag variable is calculated using the Chebyshev Type I Moving Average for the Stochastic Oscillator. The Stochastic Oscillator and the lag variable are plotted on the chart, along with upper and lower bands at 80 and 20 levels, respectively. A fill is added between the upper and lower bands for better visualization.
Conclusion
The custom Stochastic Oscillator presented in this blog post combines the Chebyshev Type I Moving Average and zero-lag Gaussian-weighted moving average filters to provide a smooth and responsive signal without introducing noticeable lag. This innovative implementation results in a fast Stochastic Oscillator that is less prone to false signals, making it a valuable tool for technical analysts and traders alike.
However, it is crucial to recognize that the Stochastic Oscillator, despite being a price scaler, has its limitations, primarily due to its propensity for generating false signals. While smoothing techniques, like the ones used in our custom implementation, can help mitigate these issues, they often introduce new challenges, such as reduced responsiveness, increased complexity, lagging signals, and the risk of overfitting.
The selection of the Chebyshev Type I Moving Average and zero-lag Gaussian-weighted moving average filters was driven by their combined ability to provide a smooth and responsive signal while minimizing false signals. The advantages of the Chebyshev filter, such as effective noise reduction, customizable ripple factor, and responsiveness, make it an excellent fit for addressing the limitations of the Stochastic Oscillator.
When using the Stochastic Oscillator, traders should be aware of these limitations and challenges, and consider incorporating other technical analysis tools and techniques to supplement the indicator's signals. This can help improve the overall accuracy and effectiveness of their trading strategies, reducing the risk of losses due to false signals and other limitations associated with the Stochastic Oscillator.
Feel free to use, modify, or improve upon this custom Stochastic Oscillator code in your trading strategies. We hope this detailed walkthrough of the custom Stochastic Oscillator, its limitations, challenges, and filter selection has provided you with valuable insights and a better understanding of how it works. Happy trading!
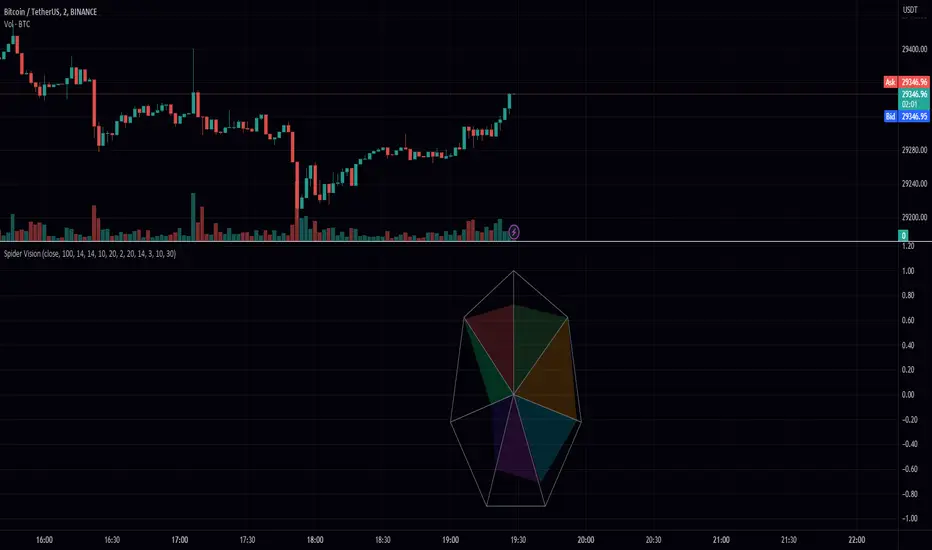
Spider VisionSpider Vision is an indicator that I created for trading view, which consists of a spider chart with 7 indicators built into it. This chart provides a visual representation of how these indicators are behaving, allowing traders to quickly assess the current market conditions.
The chart displays the following indicators:
RSI (Relative Strength Index): This is a momentum indicator that measures the strength of a security's price action. When the RSI is above 70, it is considered overbought, and when it is below 30, it is considered oversold.
Stochastic: This is another momentum indicator that compares the closing price of a security to its price range over a given time period. When the stochastic is above 80, it is considered overbought, and when it is below 20, it is considered oversold.
Momentum: This is a simple indicator that measures the change in a security's price over a given time period. When the momentum is positive, it indicates that the price is increasing, and when it is negative, it indicates that the price is decreasing.
BBW (Bollinger Bands Width): This indicator measures the width of the Bollinger Bands, which are a popular technical analysis tool used to identify potential trends and reversals. When the BBW is high, it suggests that the market is volatile, and when it is low, it suggests that the market is quiet.
DTO (Detrended Price Oscillator): This indicator measures the difference between the price of a security and its moving average. When the DTO is positive, it indicates that the price is above its moving average, and when it is negative, it indicates that the price is below its moving average.
Chop Zone: This indicator measures the choppiness of the market by comparing the average true range (ATR) to the difference between the high and low prices over a given time period. When the chop zone is high, it suggests that the market is choppy, and when it is low, it suggests that the market is trending.
Chaikin Oscillator: This is an oscillator that measures the accumulation/distribution of a security. When the Chaikin Oscillator is positive, it indicates that there is buying pressure in the market, and when it is negative, it indicates that there is selling pressure.
To use this indicator, traders can simply add it to their TradingView chart and adjust the input parameters to suit their trading style. The scale parameter can be used to adjust the size of the spider chart, while the color parameters can be used to customize the appearance of the chart. Traders can also adjust the length of each indicator to suit their preference.
Overall, the Spider Vision indicator provides a convenient way for traders to quickly assess the current market conditions and make more informed trading decisions.
SPY 4 Hour Swing TraderThe purpose of this script is to spot 4 hour pivots that indicate ~30 trading day swings. As VIX starts to drop options trading will get more boring and as we get back on the bull and can benefit from swing trading strategy. Swing trading doesn't make a whole lot of sense when VIX is above 28. Seems to get best results on 4 hour chart for this one. This indicator spots a go long opportunity when the 5 ema crosses the 13 ema on the 4 hour along with the RSI > 50 and the ADX > 20 and Stoichastic values (smoothed line < 80 or line < 90) and close > last candle close and the True Range < 6. It also spots uses a couple different means to determine when to exit the trade. Sell condition is primarily when the 13 ema crosses the 5 ema and the MACD line crosses below the signal line and the smoothed Stoichastic appears oversold (greater than 60) and slop of RSI < -.2. Stop Losses and Take Profits are configurable in Inputs along with ability to include short trades plus other MACD and Stoichastic settings. If a stop loss is encountered the trade will close. Also once twice the expected move is encountered partial profits will taken and stop losses and take profits will be re-established based on most recent close. Also a VIX above 28 will trigger any open positions to close. If trying to use this for something other than SPXL it is best to update stop losses and take profit percentages and check backtest results to ensure proper levels have been selected and the script gives satisfactory results.

Stochastic RSI of Smoothed Price [Loxx]What is Stochastic RSI of Smoothed Price?
This indicator is just as it's title suggests. There are six different signal types, various price smoothing types, and seven types of RSI.
This indicator contains 7 different types of RSI:
RSX
Regular
Slow
Rapid
Harris
Cuttler
Ehlers Smoothed
What is RSI?
RSI stands for Relative Strength Index . It is a technical indicator used to measure the strength or weakness of a financial instrument's price action.
The RSI is calculated based on the price movement of an asset over a specified period of time, typically 14 days, and is expressed on a scale of 0 to 100. The RSI is considered overbought when it is above 70 and oversold when it is below 30.
Traders and investors use the RSI to identify potential buy and sell signals. When the RSI indicates that an asset is oversold, it may be considered a buying opportunity, while an overbought RSI may signal that it is time to sell or take profits.
It's important to note that the RSI should not be used in isolation and should be used in conjunction with other technical and fundamental analysis tools to make informed trading decisions.
What is RSX?
Jurik RSX is a technical analysis indicator that is a variation of the Relative Strength Index Smoothed ( RSX ) indicator. It was developed by Mark Jurik and is designed to help traders identify trends and momentum in the market.
The Jurik RSX uses a combination of the RSX indicator and an adaptive moving average (AMA) to smooth out the price data and reduce the number of false signals. The adaptive moving average is designed to adjust the smoothing period based on the current market conditions, which makes the indicator more responsive to changes in price.
The Jurik RSX can be used to identify potential trend reversals and momentum shifts in the market. It oscillates between 0 and 100, with values above 50 indicating a bullish trend and values below 50 indicating a bearish trend . Traders can use these levels to make trading decisions, such as buying when the indicator crosses above 50 and selling when it crosses below 50.
The Jurik RSX is a more advanced version of the RSX indicator, and while it can be useful in identifying potential trade opportunities, it should not be used in isolation. It is best used in conjunction with other technical and fundamental analysis tools to make informed trading decisions.
What is Slow RSI?
Slow RSI is a variation of the traditional Relative Strength Index ( RSI ) indicator. It is a more smoothed version of the RSI and is designed to filter out some of the noise and short-term price fluctuations that can occur with the standard RSI .
The Slow RSI uses a longer period of time than the traditional RSI , typically 21 periods instead of 14. This longer period helps to smooth out the price data and makes the indicator less reactive to short-term price fluctuations.
Like the traditional RSI , the Slow RSI is used to identify potential overbought and oversold conditions in the market. It oscillates between 0 and 100, with values above 70 indicating overbought conditions and values below 30 indicating oversold conditions. Traders often use these levels as potential buy and sell signals.
The Slow RSI is a more conservative version of the RSI and can be useful in identifying longer-term trends in the market. However, it can also be slower to respond to changes in price, which may result in missed trading opportunities. Traders may choose to use a combination of both the Slow RSI and the traditional RSI to make informed trading decisions.
What is Rapid RSI?
Same as regular RSI but with a faster calculation method
What is Harris RSI?
Harris RSI is a technical analysis indicator that is a variation of the Relative Strength Index ( RSI ). It was developed by Larry Harris and is designed to help traders identify potential trend changes and momentum shifts in the market.
The Harris RSI uses a different calculation formula compared to the traditional RSI . It takes into account both the opening and closing prices of a financial instrument, as well as the high and low prices. The Harris RSI is also normalized to a range of 0 to 100, with values above 50 indicating a bullish trend and values below 50 indicating a bearish trend .
Like the traditional RSI , the Harris RSI is used to identify potential overbought and oversold conditions in the market. It oscillates between 0 and 100, with values above 70 indicating overbought conditions and values below 30 indicating oversold conditions. Traders often use these levels as potential buy and sell signals.
The Harris RSI is a more advanced version of the RSI and can be useful in identifying longer-term trends in the market. However, it can also generate more false signals than the standard RSI . Traders may choose to use a combination of both the Harris RSI and the traditional RSI to make informed trading decisions.
What is Cuttler RSI?
Cuttler RSI is a technical analysis indicator that is a variation of the Relative Strength Index ( RSI ). It was developed by Curt Cuttler and is designed to help traders identify potential trend changes and momentum shifts in the market.
The Cuttler RSI uses a different calculation formula compared to the traditional RSI . It takes into account the difference between the closing price of a financial instrument and the average of the high and low prices over a specified period of time. This difference is then normalized to a range of 0 to 100, with values above 50 indicating a bullish trend and values below 50 indicating a bearish trend .
Like the traditional RSI , the Cuttler RSI is used to identify potential overbought and oversold conditions in the market. It oscillates between 0 and 100, with values above 70 indicating overbought conditions and values below 30 indicating oversold conditions. Traders often use these levels as potential buy and sell signals.
The Cuttler RSI is a more advanced version of the RSI and can be useful in identifying longer-term trends in the market. However, it can also generate more false signals than the standard RSI . Traders may choose to use a combination of both the Cuttler RSI and the traditional RSI to make informed trading decisions.
What is Ehlers Smoothed RSI?
Ehlers smoothed RSI is a technical analysis indicator that is a variation of the Relative Strength Index ( RSI ). It was developed by John Ehlers and is designed to help traders identify potential trend changes and momentum shifts in the market.
The Ehlers smoothed RSI uses a different calculation formula compared to the traditional RSI . It uses a smoothing algorithm that is designed to reduce the noise and random fluctuations that can occur with the standard RSI . The smoothing algorithm is based on a concept called "digital signal processing" and is intended to improve the accuracy of the indicator.
Like the traditional RSI , the Ehlers smoothed RSI is used to identify potential overbought and oversold conditions in the market. It oscillates between 0 and 100, with values above 70 indicating overbought conditions and values below 30 indicating oversold conditions. Traders often use these levels as potential buy and sell signals.
The Ehlers smoothed RSI can be useful in identifying longer-term trends and momentum shifts in the market. However, it can also generate more false signals than the standard RSI . Traders may choose to use a combination of both the Ehlers smoothed RSI and the traditional RSI to make informed trading decisions.
What is Stochastic RSI?
Stochastic RSI (StochRSI) is a technical analysis indicator that combines the concepts of the Stochastic Oscillator and the Relative Strength Index (RSI). It is used to identify potential overbought and oversold conditions in financial markets, as well as to generate buy and sell signals based on the momentum of price movements.
To understand Stochastic RSI, let's first define the two individual indicators it is based on:
Stochastic Oscillator: A momentum indicator that compares a particular closing price of a security to a range of its prices over a certain period. It is used to identify potential trend reversals and generate buy and sell signals.
Relative Strength Index (RSI): A momentum oscillator that measures the speed and change of price movements. It ranges between 0 and 100 and is used to identify overbought or oversold conditions in the market.
Now, let's dive into the Stochastic RSI:
The Stochastic RSI applies the Stochastic Oscillator formula to the RSI values, essentially creating an indicator of an indicator. It helps to identify when the RSI is in overbought or oversold territory with more sensitivity, providing more frequent signals than the standalone RSI.
The formula for StochRSI is as follows:
StochRSI = (RSI - Lowest Low RSI) / (Highest High RSI - Lowest Low RSI)
Where:
RSI is the current RSI value.
Lowest Low RSI is the lowest RSI value over a specified period (e.g., 14 days).
Highest High RSI is the highest RSI value over the same specified period.
StochRSI ranges from 0 to 1, but it is usually multiplied by 100 for easier interpretation, making the range 0 to 100. Like the RSI, values close to 0 indicate oversold conditions, while values close to 100 indicate overbought conditions. However, since the StochRSI is more sensitive, traders typically use 20 as the oversold threshold and 80 as the overbought threshold.
Traders use the StochRSI to generate buy and sell signals by looking for crossovers with a signal line (a moving average of the StochRSI), similar to the way the Stochastic Oscillator is used. When the StochRSI crosses above the signal line, it is considered a bullish signal, and when it crosses below the signal line, it is considered a bearish signal.
It is essential to use the Stochastic RSI in conjunction with other technical analysis tools and indicators, as well as to consider the overall market context, to improve the accuracy and reliability of trading signals.
Signal types included are the following;
Fixed Levels
Floating Levels
Quantile Levels
Fixed Middle
Floating Middle
Quantile Middle
Extras
Alerts
Bar coloring
Loxx's Expanded Source Types

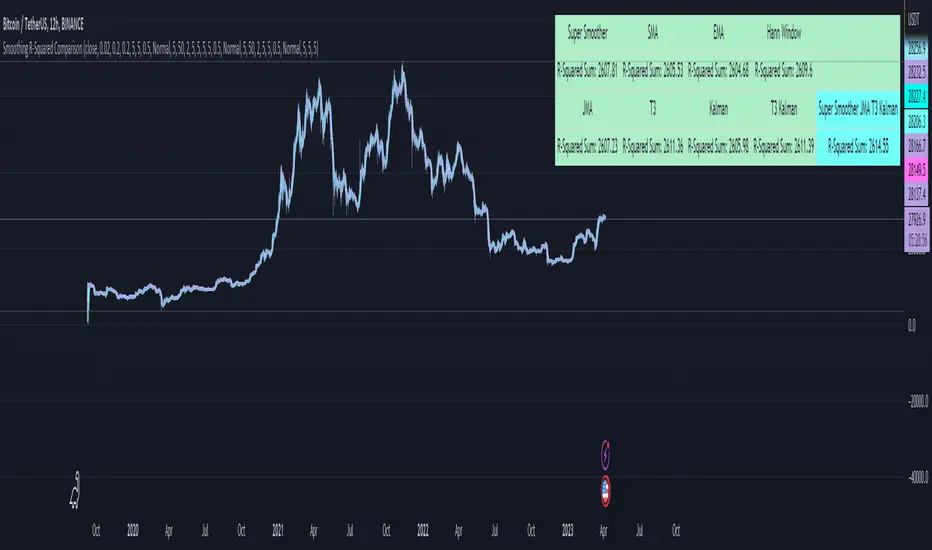
Smoothing R-Squared ComparisonIntroduction
Heyo guys, here I made a comparison between my favorised smoothing algorithms.
I chose the R-Squared value as rating factor to accomplish the comparison.
The indicator is non-repainting.
Description
In technical analysis, traders often use moving averages to smooth out the noise in price data and identify trends. While moving averages are a useful tool, they can also obscure important information about the underlying relationship between the price and the smoothed price.
One way to evaluate this relationship is by calculating the R-squared value, which represents the proportion of the variance in the price that can be explained by the smoothed price in a linear regression model.
This PineScript code implements a smoothing R-squared comparison indicator.
It provides a comparison of different smoothing techniques such as Kalman filter, T3, JMA, EMA, SMA, Super Smoother and some special combinations of them.
The Kalman filter is a mathematical algorithm that uses a series of measurements observed over time, containing statistical noise and other inaccuracies, and produces estimates of unknown variables that tend to be more accurate than those based on a single measurement.
The input parameters for the Kalman filter include the process noise covariance and the measurement noise covariance, which help to adjust the sensitivity of the filter to changes in the input data.
The T3 smoothing technique is a popular method used in technical analysis to remove noise from a signal.
The input parameters for the T3 smoothing method include the length of the window used for smoothing, the type of smoothing used (Normal or New), and the smoothing factor used to adjust the sensitivity to changes in the input data.
The JMA smoothing technique is another popular method used in technical analysis to remove noise from a signal.
The input parameters for the JMA smoothing method include the length of the window used for smoothing, the phase used to shift the input data before applying the smoothing algorithm, and the power used to adjust the sensitivity of the JMA to changes in the input data.
The EMA and SMA techniques are also popular methods used in technical analysis to remove noise from a signal.
The input parameters for the EMA and SMA techniques include the length of the window used for smoothing.
The indicator displays a comparison of the R-squared values for each smoothing technique, which provides an indication of how well the technique is fitting the data.
Higher R-squared values indicate a better fit. By adjusting the input parameters for each smoothing technique, the user can compare the effectiveness of different techniques in removing noise from the input data.
Usage
You can use it to find the best fitting smoothing method for the timeframe you usually use.
Just apply it on your preferred timeframe and look for the highlighted table cell.
Conclusion
It seems like the T3 works best on timeframes under 4H.
There's where I am active, so I will use this one more in the future.
Thank you for checking this out. Enjoy your day and leave me a like or comment. 🧙♂️
---
Credits to:
▪@loxx – T3
▪@balipour – Super Smoother
▪ChatGPT – Wrote 80 % of this article and helped with the research
WillyCycle Oscillator&DoubleMa/ErkOzi/version 2This oscillator can be customized by adjusting the length of the Willy period, the length of Willy's EMA, and the upper and lower bands. The upper and lower bands help traders identify overbought and oversold conditions.
The WillyCycle Oscillator is a technical analysis tool used to measure the momentum of an asset and identify overbought and oversold conditions based on the price range of a specific period and calculating the percentage of the closing price in that range. The WillyCycle Oscillator consists of two main components: Willy and Willy's EMA. The Willy component is the percentage calculation of the asset's price range, and Willy's EMA is the exponential moving average of the Willy component. Willy's EMA is used to smooth out the Willy component and make it easier to identify trends.
*** When the oscillator is above the 80 level, it indicates that the asset is overbought, and when it is below the 20 level, it indicates that the asset is oversold. Traders can use these levels as a guide for buying and selling signals.
***Traders can also use the WillyCycle Oscillator to identify trend reversals. When the oscillator rises above the 50 level, it signals a potential uptrend, and when it falls below the 50 level, it signals a potential downtrend.
***I have added a smoothed line option to the WillyCycle Oscillator, which allows traders to see a more smoothed version of the oscillator. This option can be enabled by setting the 'smoothed' input to true. The default value for the smoothed line is 15.
***We have also changed the value range of the WillyCycle Oscillator from -100 to 100 to 0 to 100. This change was made to make the oscillator more user-friendly and easier to read.
In conclusion, the WillyCycle Oscillator is a versatile tool that can help traders identify potential trading opportunities and trend reversals. Traders can customize the oscillator to fit their trading style and preferences. Adding a smoothed line and changing the value range can enhance the user experience and make the oscillator easier to use.

RSI with Keltner Channel (+EMA Ribbon)Note that the EMA Ribbon is not embedded into the custom RSI with KC. In the future I plan to embed it. The EMA Ribbon I use is the following:
This is my very first attempt at modifying an indicator. I basically attempted to add a Keltner Channel around RSI.
This was used as an alternative channel to the standard Bollinger Band. KC goes hand-in-hand with the EMA Ribbon. KC also helps to better pinpoint relative-overbought/oversold conditions.
In my belief, the 20-80 levels don't behave as overbought/oversold levels. An exponential chart would always be overbought. So a Keltner Channel could in theory (and in practice) give us greater understanding on chart analysis.
This custom indicator is a bodge . It has lots of extra calculations that can be removed. I post this rough indicator for the community to give feedback on how I can improve it, or perhaps give an idea to some of you. Please don't judge me, I wouldn't post it but lately some have asked me about it.
In the future I would like to embed an EMA ribbon in this RSI indicator, just like I did in the following idea.
During this period, I don't really have the time to fix this indicator to my standards. So I will leave it as is for the foreseeable future.
If you have the will and knowledge however, feel free to built upon this indicator and share it!
Tread lightly, for this is hallowed ground.
-Father Grigori
PS. In this indicator, I would replace all the moving averages with an EMA Ribbon "average".

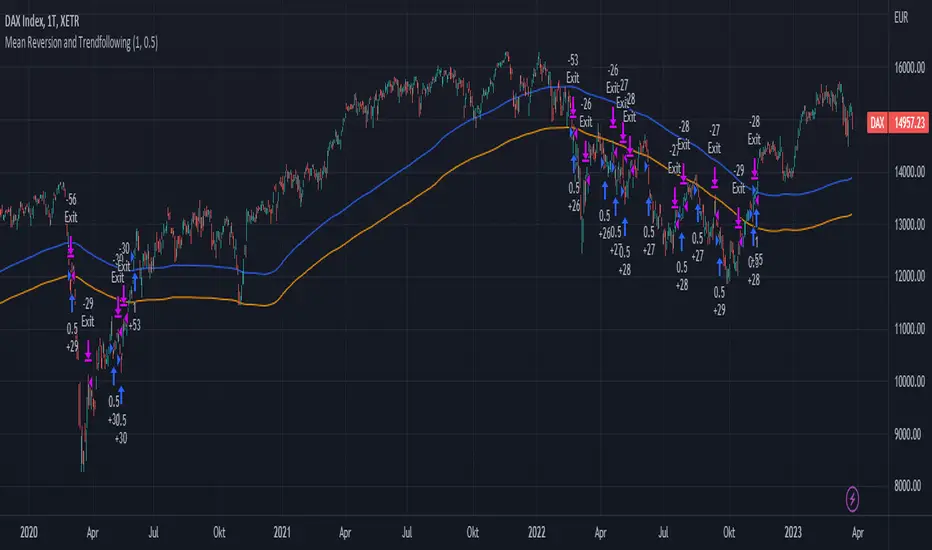
Mean Reversion and TrendfollowingTitle: Mean Reversion and Trendfollowing
Introduction:
This script presents a hybrid trading strategy that combines mean reversion and trend following techniques. The strategy aims to capitalize on short-term price corrections during a downtrend (mean reversion) as well as ride the momentum of a trending market (trend following). It uses a 200-period Simple Moving Average (SMA) and a 2-period Relative Strength Index (RSI) to generate buy and sell signals.
Key Features:
Combines mean reversion and trend following techniques
Utilizes 200-period SMA and 2-period RSI
Customizable starting date
Allows for enabling/disabling mean reversion or trend following modes
Adjustable position sizing for trend following and mean reversion
Script Description:
The script implements a trading strategy that combines mean reversion and trend following techniques. Users can enable or disable either of these techniques through the input options. The strategy uses a 200-period Simple Moving Average (SMA) and a 2-period Relative Strength Index (RSI) to generate buy and sell signals.
The mean reversion mode is active when the price is below the SMA200, while the trend following mode is active when the price is above the SMA200. The script generates buy signals when the RSI is below 20 (oversold) in mean reversion mode or when the price is above the SMA200 in trend following mode. The script generates sell signals when the RSI is above 80 (overbought) in mean reversion mode or when the price falls below 95% of the SMA200 in trend following mode.
Users can adjust the position sizing for both trend following and mean reversion modes using the input options.
To use this script on TradingView, follow these steps:
Open TradingView and load your preferred chart.
Click on the 'Pine Editor' tab located at the bottom of the screen.
Paste the provided script into the Pine Editor.
Click 'Add to Chart' to apply the strategy to your chart.
Please note that the past performance of any trading system or methodology is not necessarily indicative of future results. Always use proper risk management and consult a financial advisor before making any investment decisions.
------
The following is a summary of the underlying whitepaper (onlinelibrary.wiley.com) for this strategy:
This paper proposes a theory of securities market under- and overreactions based on two psychological biases: investor overconfidence about the precision of private information and biased self-attribution, which causes asymmetric shifts in investors' confidence as a function of their investment outcomes. The authors show that overconfidence implies negative long-lag autocorrelations, excess volatility, and public-event-based return predictability. Biased self-attribution adds positive short-lag autocorrelations (momentum), short-run earnings "drift," and negative correlation between future returns and long-term past stock market and accounting performance.
The paper explains that there is empirical evidence challenging the traditional view that securities are rationally priced to reflect all publicly available information. Some of these anomalies include event-based return predictability, short-term momentum, long-term reversal, high volatility of asset prices relative to fundamentals, and short-run post-earnings announcement stock price "drift."
The authors argue that investor overconfidence can lead to stock prices overreacting to private information signals and underreacting to public signals. This overreaction-correction pattern is consistent with long-run negative autocorrelation in stock returns, excess volatility, and further implications for volatility conditional on the type of signal. The market's tendency to over- or underreact to different types of information allows the authors to address the pattern that average announcement date returns in virtually all event studies are of the same sign as the average post-event abnormal returns.
Biased self-attribution implies short-run momentum and long-term reversals in security prices. The dynamic analysis based on biased self-attribution can also lead to a lag-dependent response to corporate events. Cash flow or earnings surprises at first tend to reinforce confidence, causing a same-direction average stock price trend. Later reversal of overreaction can lead to an opposing stock price trend.
The paper concludes by summarizing the findings, relating the analysis to the literature on exogenous noise trading, and discussing issues related to the survival of overconfident traders in financial markets.
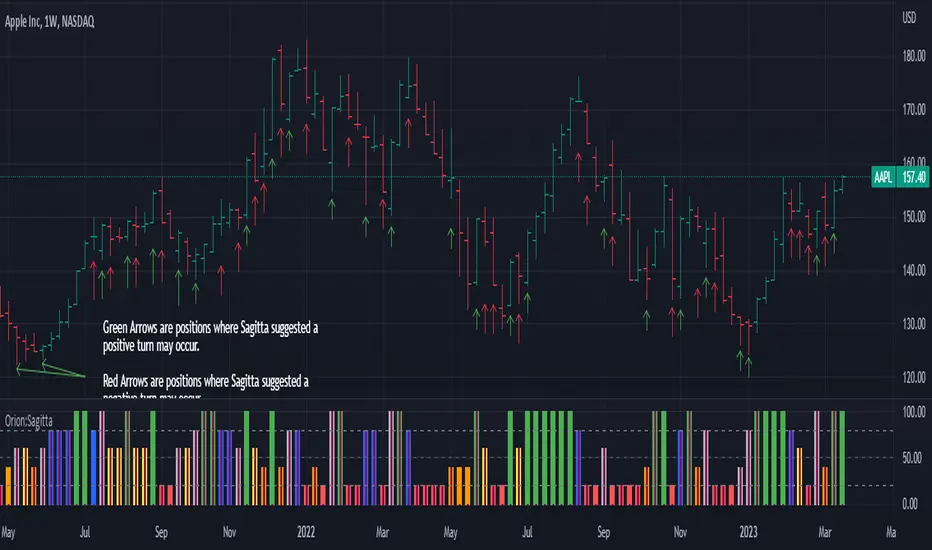
Orion:SagittaSagitta
Sagitta is an indicator the works to assist in the validation of potential long entries and to place stop-loss orders. Sagitta is not a "golden indicator" but more of a confirmation indicator of what prices might be suggesting.
The concept is that while stocks can turn in one bar, it usually takes two bars or more to signal a turn. So, using a measurement of two bars help determine the potential turning of prices.
Behind the scenes, Sagitta is nothing more than a 2 period stochastic which has had its values divided into five specific zones.
Dividing the range of the two bars in five sections, the High is equal to 100 and the Low is equal to 0.
The zones are:
20 = bearish (red) – This is when the close is the lower 20% of the two bars
40 = bearish (orange) – This is when the close is between the lower 20% and 40% of the two bars.
60 = neutral (yellow) – This is when the close is between the middle 40% - 60% of the two bars.
80 = bullish (blue) – This is when the close is between the upper 60% - 80% of the two bars.
100 = bullish (green) – This is when the close is above the upper 80% of the bar.
The general confirmation concept works as such:
When the following bar is of a higher value than the previous bar, there is potential for further upward price movement. Conversely when the following bar is lower than the previous bar, there is potential for further downward movement.
Going from a red bar to orange bar Might be an indication of a positive turn in direction of prices.
Going from a green bar to an orange bar would also be considered a negative directional turn of prices.
When the follow on bar decreases (ie, green to blue, blue to yellow, etc) placing a stop-loss would be prudent.
Maroon lines in the middle of a bar is an indication that prices are currently caught in consolidation.
Silver/Gray bars indicate that a high potential exists for a strong upward turn in prices exists.
Consolidation is calculated by determining if the close of one bar is between the high and low of another bar. This then establishes the range high and low. As long as closes continue with this range, the high and low of the range can expand. When the close is outside of the range, the consolidation is reset.
Signals in areas of consolidation (maroon center bar) should be looked upon as if the prices are going to challenge the high of the consolidation range and not necessarily break through.
The entry technique used is:
The greater of the following two calculations:
High of signal bar * 1.002 or High of signal bar + .03
The stop-loss technique used is:
The lesser of the following two calculations:
Low of signal bar * .998 or Low of signal bar - .03
IF an entry signal is generated and the price doesn’t reach the entry calculation. It is considered a failed entry and is not considered a negative or that you missed out on something. This has saved you from losing money since the prices are not ready to commit to the direction.
When placing a stop-loss, it is never suggested that you lower the value of a stop-loss. Always move your stop-losses higher in order to lock in profit in case of a negative turn.
DSS Bressert Stochastic MTFDouble Smoothed Stochastics – DSS Bressert is an oscillator introduced by William Blau and Walter Bressert shortly after each other in two slightly different versions. The calculation of DSS Bressert values is similar to the stochastic indicator. The difference is the use of double exponential smoothing. The advantages over the classic stochastic oscillators are the fast response to price changes in a still very smooth pattern. In addition, the extreme zones at the other end of the scale are reached quite frequently, even in strong trends, resulting in many trend conforming signals. Double Smoothed Stochastics – DSS The Bressert values are the same as the stochastics – values above 80 indicate an overbought condition of the market, values below 20 indicate an oversold condition of the market.
This is a full implementation of the original Stochastic Calulation with Multi-Time-Frame options. Other available scrips are lagging here and messing MTF up...
This Scrip will plot 2 lines for the double smoothed Stochastic based on the original exponential calculation from Blau/Bressert. Whilst the original stochastic is only simple moving average.
If you are a daytrader or scalper, the script is able to show a slow line and a fast line pair. Preferred Settings are embedded as screenshot.

Soheil PKO's 5 min Hitman Scalp - 3MA + Laguerre RSI + ADX [Pt]Someone sent me this strategy found on YouTube. It is Soheil PKO's "The Best and Most Profitable Scalping Strategy" Best way to find out is to code it =)
This strategy uses Moving Average Ribbon, Laguerre RSI, and ADX. This script only displays the MA ribbon, you will need to add Laguerre RSI and ADX separately.
Long Entry Criteria:
- 16 EMA > 48 EMA > 200 SMA
- Laguerre RSI > 80
- ADX > 20
Long Exit Criterion:
- 16 EMA < 48 EMA
Short Entry Criteria:
- 16 EMA < 48 EMA < 200 SMA
- Laguerre RSI < 20
- ADX > 20
Short Exit Criterion:
- 16 EMA > 48 EMA
As mentioned in the video, risk management is very important, especially for scalping strategies. Therefore, I've added option for setting Stop Loss and Price Target in the options for you guys to play with.
All parameters are configurable.
Enjoy~~

Trend Indicator with RSI and Fibbonacci Band 0.702 crossingsToday we have a new Indicator set, which I created using inspiration from the Trend Magic Indicator from KivancOzbilgic and adding several new aspects to it and a slightly modified calculation of the trend indicator itself.
You can change the inputs by changing the pre set values in the settings, but I found the current settings quite accurate. Feel free to experiment to fine tune the indicators.
Here are the details of the script:
Trend indicated within candles and as a line
- bullish and bearish trends are now also indicated within the candle based on the CCI calculation.
- Bullish is indicated by a green circle below the candle or as one may call it a "dot"
- bearish trend is indicated by a red circle above the candle
Entry Signal based on RSI crossing its EMA
- my motivation was to have a clearer entry signal besides highlighting a trend, which can not really be used to identify a good entry but to give confidence or when loosing trend to give an exit signal.
- after studiying the RSI and how it works together with its EMA it looks quite interesting as an entry or exit signal. But be cautios if the EMA and RSI values are moving in a narrow area we get a lot of crosses and therefore signals which should rather be ignored rather to be act on. So the the range where the cross happens is also quite important. But this aspect is not yet reflected as a rule/ logic.
But I am thinking of adding something.. or alternativly best to switch to another timeframe to get some better data
RSI overbought and oversold as Diamonds
- I also added key indications of oversold or overbought as Blue and Pink diamonds, can be considered as additional information to maybe identify a short term top or bottom.. but its not very accurate.
Entry signal based on crossing Fibbonachi Band 0.702
- So far the 0.702 seems to be quite an interesting retracement level which seems to be met a lot of times
- based on the assumption the price will evantually hit the 0.702 either direction I wanted to get a signal when this happens
- BUT! a big but, unfortunalty the Fibbonachi bands tend to bloat up in case of high volatility so it is not easy to find the crossing on higher timeframes
Here are the standard value which I found quite accurate for the assets I use this indicator set:
CCI Period = 5
ATR Multiplier = 1
ATR Period = 1
Source = High Low Close (hlc3 average value of the candle
Here the inputs used for the RSI Crossing signal (here you should play around a little to see which entry would have been best..)
RSI Length = 14
RSI Oversold = 25 (to be used for the "golden" entry signal based on the FBB crossing)
RSI Overbought = 80 (to be used for the "golden" entry signal based on the FBB crossing)
RSI Moving Average Length
In future versions I will add options to activate or deactive some of the plotting and espacially this golden dot when the fibbonachi band is being crossed needs some fine tuning..
And lets see if there is a way to fix the bloating of those bands..