OPEN-SOURCE SCRIPT
Telah dikemas kini hidden & regular rsi divergence
This is a divergence indicator that draws regular and hidden divergences based on the Zigzag indicator and RSI indicator. There are two degrees of Zigzag. So, in each Zigzag degree, there are two types of regular divergences and one type of hidden divergence.
👉(The logic is written in case of a bearish regular divergence. The opposite will apply for a bullish one.)
Type 1 of regular divergence (Logic 1):
Zigzag has to form a higher high. The highest RSI within both Zigzag legs must form lower highs, but the RSI values which are exactly at the Zigzag highs should not form lower highs.
Type 2 of regular divergence (Logic 2):
Zigzag has to form a higher high. The highest RSI within both Zigzag legs must form lower highs, and the RSI values which are exactly at the Zigzag highs should form lower highs.
👉(The logic is written in case of a bearish hidden divergence. The opposite will apply for a bullish one.)
Zigzag has to form a lower high. The highest RSI within both Zigzag legs must form higher highs.
👉There is also a filter that will be applied to all the divergences. It only shows the divergences whose corresponding RSI value was above/below a level (overbought level/oversold level).
Logic for regular divergences:
Bearish regular divergence's first high's (leftmost) RSI value should be greater than or equal to 70.
Bullish regular divergence's first low's (leftmost) RSI value should be less than or equal to 30.
Logic for hidden divergences:
Bearish hidden divergence's second high's (rightmost) RSI value should be greater than or equal to 70.
Bullish hidden divergence's second low's (rightmost) RSI value should be less than or equal to 30.
👉There is another feature also. This indicator colors the background based on whether the RSI is in a bullish or bearish range.
If it's within 80-60, the background will be colored green (this means that RSI is in a bullish range).
If it's within 40-20, the background will be colored red (this means that RSI is in a bearish range).
Nota Keluaran
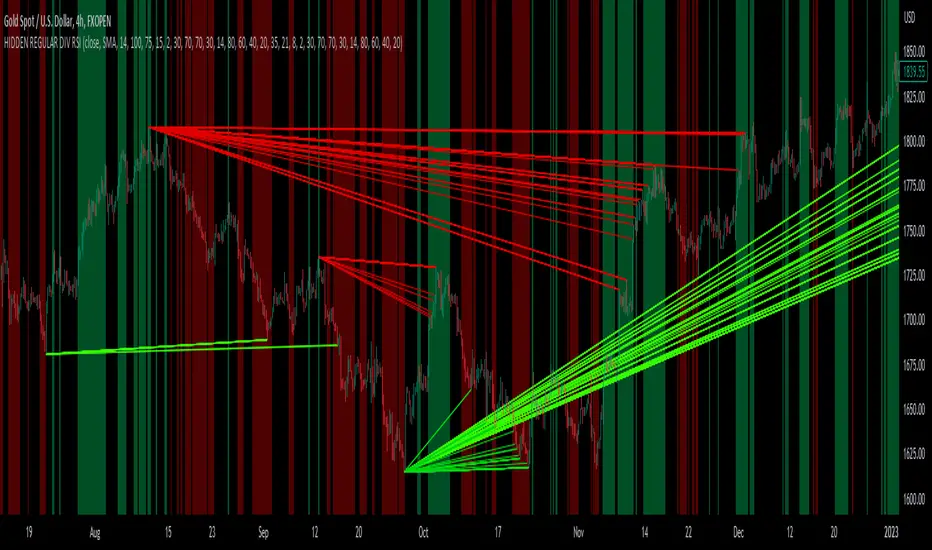
👉Here is an overview of this indicator:It uses the ZigZag++ indicator by DevLucem and the built in RSI indicator to draw Divergences on the chart.
It uses 2 degrees of ZigZag: A higher degree and a lower degree.
Each degree has its own Regular & Hidden Divergence settings, RSI settings & ZigZag settings.
It also shades the background based on where the RSI is.
If it's within a bullish range, it shades the background green.
If it's within a bearish range, it shades the background red.
You can change these ranges if you want to.
The default bullish range is 80-60. The default bearish range is 40-20.
👉Here is how you can use it as a strategy:
For a buy:
- Look for the 1st candle closing inside the green shading.
The previous candle should not be inside the green shading.
This green shading should come immediately after a Bullish divergence (the green lines).
For a sell:
*Look for the 1st candle closing inside the red shading.
The previous candle should not be inside the red shading.
This red shading should come immediately after a Bearish divergence (the redlines).
For the Stoploss, you can use the last swing high/low. For the Takeprofit, just take double of the Stoploss.
Skrip sumber terbuka
Dalam semangat sebenar TradingView, pencipta skrip ini telah menjadikannya sumber terbuka supaya pedagang dapat menilai dan mengesahkan kefungsiannya. Terima kasih kepada penulis! Walaupun anda boleh menggunakannya secara percuma, ingat bahawa menerbitkan semula kod ini adalah tertakluk kepada Peraturan Dalaman kami.
Penafian
Maklumat dan penerbitan adalah tidak dimaksudkan untuk menjadi, dan tidak membentuk, nasihat untuk kewangan, pelaburan, perdagangan dan jenis-jenis lain atau cadangan yang dibekalkan atau disahkan oleh TradingView. Baca dengan lebih lanjut di Terma Penggunaan.