Negative Correlation SignalsThank you to Hendrik Fuchs who coded this for me - I highly recommend you...
The AUDUSD/EURUSD has a negative correlation with the DXY as does the GBPJPY/USDJPY have with the JPYX. This indicator is very simple and uses opposite candle pinbars (pinbar/doji structure can be set by you) of the two instruments on the chart whilst the stochastic RSI should be above 80 for overbought on the one but below 20 on the other for oversold (or vice versa) to generate a signal.
This indicator works as follow:
1. Choose an instrument that has an opposing negatively correlated instrument (EURUSD & DXY, GBPJPY & JPYX, US100 & VIX, etc.)
2. Add indicator to the chart and open settings.
3. Open the settings and add the correct instruments (default is set to GBPJPY & JPYX).
4. Enter your desired Stochastic RSI & candle formation settings.
You will see buy and sell signals appear on the charts. Alerts are possible (Any alert() function call). Does not repaint after close of candle. Better on higher timeframes but can also be used for scalping. Best used as confluence or as part of a trend trading system.
There are obviously many many variations that I have not even thought off - please let us know in the comment section if you find settings/timeframes/instruments that work particularly well.
Cari dalam skrip untuk "股价在8元左右净利润为正市值小于80亿的热门股票有哪些"

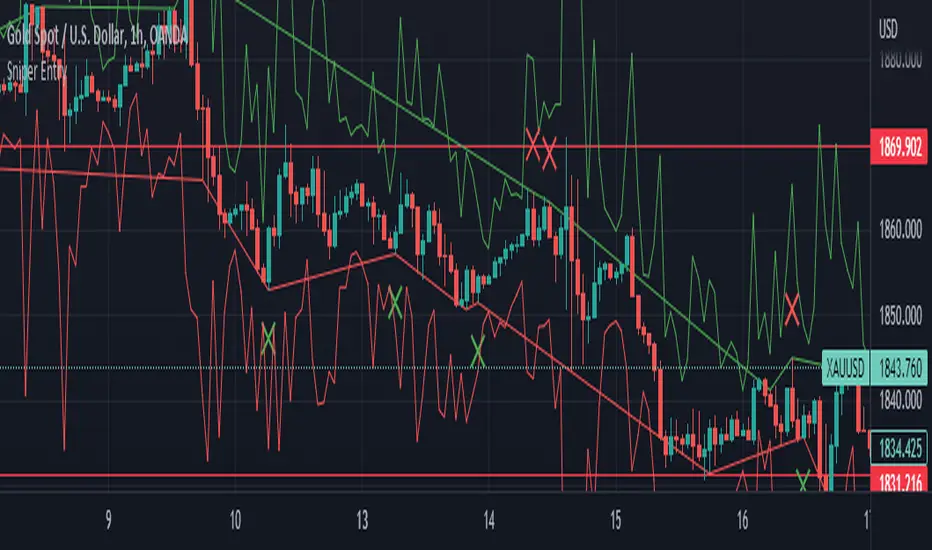
Sniper EntryThis source code is an implementation of a TradingView indicator called "Sniper Entry". The purpose of this indicator is to identify potential entry points for trades based on certain candlestick patterns and the Stochastic oscillator.
The indicator calculates the Stochastic oscillator based on the close, high, and low prices of the asset over a period of 14 bars. It then uses this oscillator to generate buy and sell signals.
For a buy signal to be generated, the Stochastic oscillator must cross above the oversold level of 20, and the current candle must either be a bullish pin bar or a bullish engulfing pattern. For a sell signal to be generated, the Stochastic oscillator must cross below the overbought level of 80, and the current candle must either be a bearish pin bar or a bearish engulfing pattern.
The indicator also calculates the stop loss and target levels for both buy and sell trades. The stop loss is calculated based on the low or high of the candle that generated the signal, depending on whether it's a buy or sell signal. The target is calculated based on the risk/reward ratio, which is set to 3 in this implementation. The lot size is also set to 0.01, and the starting capital is set to 100.
The indicator then plots the buy and sell signals, the stop loss and target levels, and the Stochastic oscillator on the chart.
It's important to note that this is just one example of a trading indicator, and its effectiveness may vary depending on market conditions and the asset being traded. It's also important to perform your own analysis and use proper risk management techniques when making trades based on any indicator or strategy.
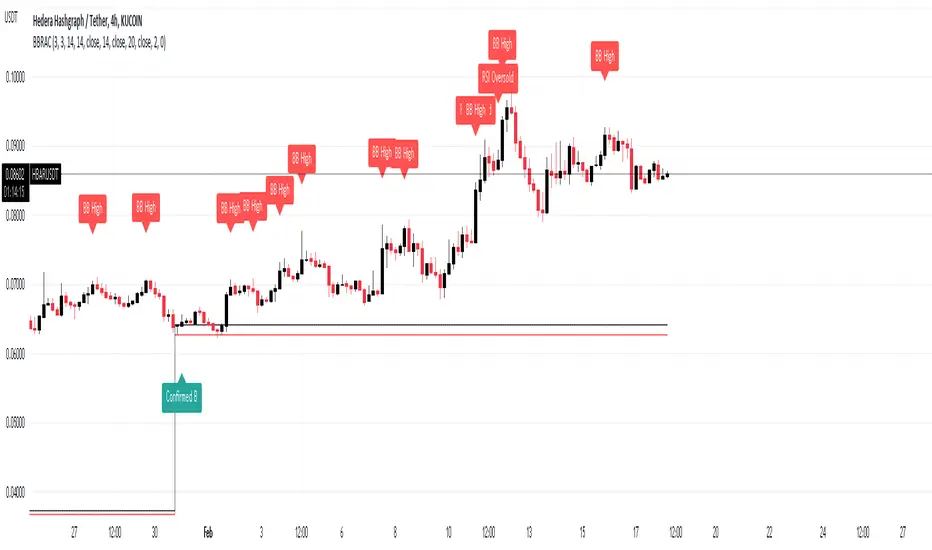
BB Running Away CandleHello,
here is an indicator that can be helpful for your trading that is simple and easy to use.
Our culprit here is a candle that opens and closes below the lower band of Bollinger Band, Black and red lines are put on the high and low of that candle.
Green Arrows are happening when:
1- When candle closes above the black line and Stochastic RSI is in the oversold area >> "Confirmed B"
2- When candle closes above the black line >> "B"
Note that you can choose from the settings whether you want it confirmed or not.
Red Arrows are happening when:
1- Price reached the higher band of Bollinger Bands >> "BB High"
2- Stochastic crosses down from above 80 level >> "Stoch Crossdown"
3- RSI reached above 70 levle >> "RSI Oversold"
Note that you can choose to turn these on or off from the settings.
Settings of indicators are set to default.
NOTE: Alerts are put there however i didn't get the chance to test them, so would like to hear your feedback about them.
THE USE OF THIS INDICATOR IS YOUR OWN RESPONSIBILITY.
wishing you the best.
PitchforkTypesLibrary "PitchforkTypes"
User Defined Types to be used for Pitchfork and Drawing elements of Pitchfork. Depends on DrawingTypes for Point, Line, and LineProperties objects
PitchforkDrawingProperties
Pitchfork Drawing Properties object
Fields:
extend : If set to true, forks are extended towards right. Default is true
fill : Fill forklines with transparent color. Default is true
fillTransparency : Transparency at which fills are made. Only considered when fill is set. Default is 80
forceCommonColor : Force use of common color for forks and fills. Default is false
commonColor : common fill color. Used only if ratio specific fill colors are not available or if forceCommonColor is set to true.
PitchforkDrawing
Pitchfork drawing components
Fields:
medianLine : Median line of the pitchfork
baseLine : Base line of the pitchfork
forkLines : fork lines of the pitchfork
linefills : Linefills between forks
Fork
Fork object property
Fields:
ratio : Fork ratio
forkColor : color of fork. Default is blue
include : flag to include the fork in drawing. Default is true
PitchforkProperties
Pitchfork Properties
Fields:
forks : Array of Fork objects
type : Pitchfork type. Supported values are "regular", "schiff", "mschiff", Default is regular
inside : Flag to identify if to draw inside fork. If set to true, inside fork will be drawn
Pitchfork
Pitchfork object
Fields:
a : Pivot Point A of pitchfork
b : Pivot Point B of pitchfork
c : Pivot Point C of pitchfork
properties : PitchforkProperties object which determines type and composition of pitchfork
dProperties : Drawing properties for pitchfork
lProperties : Common line properties for Pitchfork lines
drawing : PitchforkDrawing object

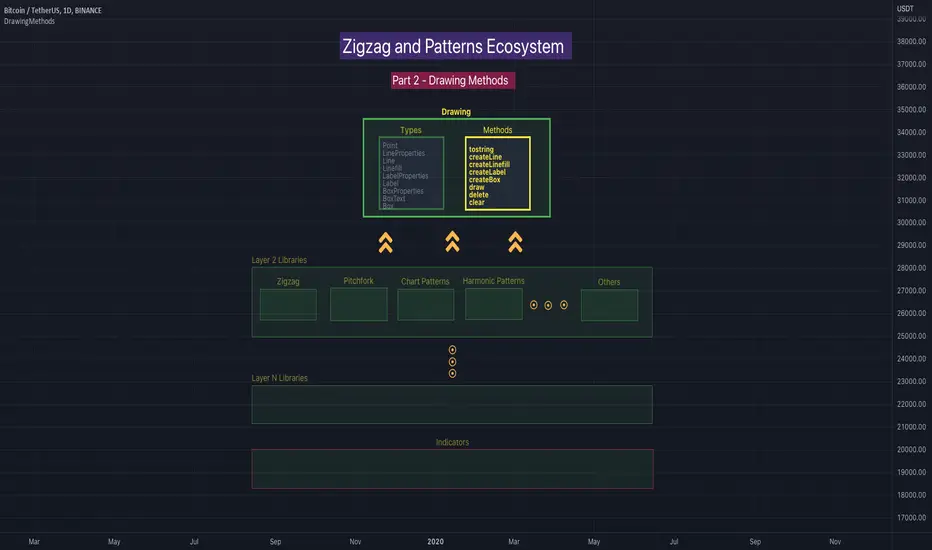
DrawingMethodsLibrary "DrawingMethods"
tostring(this, sortKeys, sortOrder, includeKeys)
Converts DrawingTypes/Point object to string representation
Parameters:
this : DrawingTypes/Point object
sortKeys : If set to true, string output is sorted by keys.
sortOrder : Applicable only if sortKeys is set to true. Positive number will sort them in ascending order whreas negative numer will sort them in descending order. Passing 0 will not sort the keys
includeKeys : Array of string containing selective keys. Optional parmaeter. If not provided, all the keys are considered
Returns: string representation of DrawingTypes/Point
tostring(this, sortKeys, sortOrder, includeKeys)
Converts DrawingTypes/LineProperties object to string representation
Parameters:
this : DrawingTypes/LineProperties object
sortKeys : If set to true, string output is sorted by keys.
sortOrder : Applicable only if sortKeys is set to true. Positive number will sort them in ascending order whreas negative numer will sort them in descending order. Passing 0 will not sort the keys
includeKeys : Array of string containing selective keys. Optional parmaeter. If not provided, all the keys are considered
Returns: string representation of DrawingTypes/LineProperties
tostring(this, sortKeys, sortOrder, includeKeys)
Converts DrawingTypes/Line object to string representation
Parameters:
this : DrawingTypes/Line object
sortKeys : If set to true, string output is sorted by keys.
sortOrder : Applicable only if sortKeys is set to true. Positive number will sort them in ascending order whreas negative numer will sort them in descending order. Passing 0 will not sort the keys
includeKeys : Array of string containing selective keys. Optional parmaeter. If not provided, all the keys are considered
Returns: string representation of DrawingTypes/Line
tostring(this, sortKeys, sortOrder, includeKeys)
Converts DrawingTypes/LabelProperties object to string representation
Parameters:
this : DrawingTypes/LabelProperties object
sortKeys : If set to true, string output is sorted by keys.
sortOrder : Applicable only if sortKeys is set to true. Positive number will sort them in ascending order whreas negative numer will sort them in descending order. Passing 0 will not sort the keys
includeKeys : Array of string containing selective keys. Optional parmaeter. If not provided, all the keys are considered
Returns: string representation of DrawingTypes/LabelProperties
tostring(this, sortKeys, sortOrder, includeKeys)
Converts DrawingTypes/Label object to string representation
Parameters:
this : DrawingTypes/Label object
sortKeys : If set to true, string output is sorted by keys.
sortOrder : Applicable only if sortKeys is set to true. Positive number will sort them in ascending order whreas negative numer will sort them in descending order. Passing 0 will not sort the keys
includeKeys : Array of string containing selective keys. Optional parmaeter. If not provided, all the keys are considered
Returns: string representation of DrawingTypes/Label
tostring(this, sortKeys, sortOrder, includeKeys)
Converts DrawingTypes/Linefill object to string representation
Parameters:
this : DrawingTypes/Linefill object
sortKeys : If set to true, string output is sorted by keys.
sortOrder : Applicable only if sortKeys is set to true. Positive number will sort them in ascending order whreas negative numer will sort them in descending order. Passing 0 will not sort the keys
includeKeys : Array of string containing selective keys. Optional parmaeter. If not provided, all the keys are considered
Returns: string representation of DrawingTypes/Linefill
tostring(this, sortKeys, sortOrder, includeKeys)
Converts DrawingTypes/BoxProperties object to string representation
Parameters:
this : DrawingTypes/BoxProperties object
sortKeys : If set to true, string output is sorted by keys.
sortOrder : Applicable only if sortKeys is set to true. Positive number will sort them in ascending order whreas negative numer will sort them in descending order. Passing 0 will not sort the keys
includeKeys : Array of string containing selective keys. Optional parmaeter. If not provided, all the keys are considered
Returns: string representation of DrawingTypes/BoxProperties
tostring(this, sortKeys, sortOrder, includeKeys)
Converts DrawingTypes/BoxText object to string representation
Parameters:
this : DrawingTypes/BoxText object
sortKeys : If set to true, string output is sorted by keys.
sortOrder : Applicable only if sortKeys is set to true. Positive number will sort them in ascending order whreas negative numer will sort them in descending order. Passing 0 will not sort the keys
includeKeys : Array of string containing selective keys. Optional parmaeter. If not provided, all the keys are considered
Returns: string representation of DrawingTypes/BoxText
tostring(this, sortKeys, sortOrder, includeKeys)
Converts DrawingTypes/Box object to string representation
Parameters:
this : DrawingTypes/Box object
sortKeys : If set to true, string output is sorted by keys.
sortOrder : Applicable only if sortKeys is set to true. Positive number will sort them in ascending order whreas negative numer will sort them in descending order. Passing 0 will not sort the keys
includeKeys : Array of string containing selective keys. Optional parmaeter. If not provided, all the keys are considered
Returns: string representation of DrawingTypes/Box
delete(this)
Deletes line from DrawingTypes/Line object
Parameters:
this : DrawingTypes/Line object
Returns: Line object deleted
delete(this)
Deletes label from DrawingTypes/Label object
Parameters:
this : DrawingTypes/Label object
Returns: Label object deleted
delete(this)
Deletes Linefill from DrawingTypes/Linefill object
Parameters:
this : DrawingTypes/Linefill object
Returns: Linefill object deleted
delete(this)
Deletes box from DrawingTypes/Box object
Parameters:
this : DrawingTypes/Box object
Returns: DrawingTypes/Box object deleted
delete(this)
Deletes lines from array of DrawingTypes/Line objects
Parameters:
this : Array of DrawingTypes/Line objects
Returns: Array of DrawingTypes/Line objects
delete(this)
Deletes labels from array of DrawingTypes/Label objects
Parameters:
this : Array of DrawingTypes/Label objects
Returns: Array of DrawingTypes/Label objects
delete(this)
Deletes linefill from array of DrawingTypes/Linefill objects
Parameters:
this : Array of DrawingTypes/Linefill objects
Returns: Array of DrawingTypes/Linefill objects
delete(this)
Deletes boxes from array of DrawingTypes/Box objects
Parameters:
this : Array of DrawingTypes/Box objects
Returns: Array of DrawingTypes/Box objects
clear(this)
clear items from array of DrawingTypes/Line while deleting underlying objects
Parameters:
this : array
Returns: void
clear(this)
clear items from array of DrawingTypes/Label while deleting underlying objects
Parameters:
this : array
Returns: void
clear(this)
clear items from array of DrawingTypes/Linefill while deleting underlying objects
Parameters:
this : array
Returns: void
clear(this)
clear items from array of DrawingTypes/Box while deleting underlying objects
Parameters:
this : array
Returns: void
draw(this)
Creates line from DrawingTypes/Line object
Parameters:
this : DrawingTypes/Line object
Returns: line created from DrawingTypes/Line object
draw(this)
Creates lines from array of DrawingTypes/Line objects
Parameters:
this : Array of DrawingTypes/Line objects
Returns: Array of DrawingTypes/Line objects
draw(this)
Creates label from DrawingTypes/Label object
Parameters:
this : DrawingTypes/Label object
Returns: label created from DrawingTypes/Label object
draw(this)
Creates labels from array of DrawingTypes/Label objects
Parameters:
this : Array of DrawingTypes/Label objects
Returns: Array of DrawingTypes/Label objects
draw(this)
Creates linefill object from DrawingTypes/Linefill
Parameters:
this : DrawingTypes/Linefill objects
Returns: linefill object created
draw(this)
Creates linefill objects from array of DrawingTypes/Linefill objects
Parameters:
this : Array of DrawingTypes/Linefill objects
Returns: Array of DrawingTypes/Linefill used for creating linefills
draw(this)
Creates box from DrawingTypes/Box object
Parameters:
this : DrawingTypes/Box object
Returns: box created from DrawingTypes/Box object
draw(this)
Creates labels from array of DrawingTypes/Label objects
Parameters:
this : Array of DrawingTypes/Label objects
Returns: Array of DrawingTypes/Label objects
createLabel(this, lblText, tooltip, properties)
Creates DrawingTypes/Label object from DrawingTypes/Point
Parameters:
this : DrawingTypes/Point object
lblText : Label text
tooltip : Tooltip text. Default is na
properties : DrawingTypes/LabelProperties object. Default is na - meaning default values are used.
Returns: DrawingTypes/Label object
createLine(this, other, properties)
Creates DrawingTypes/Line object from one DrawingTypes/Point to other
Parameters:
this : First DrawingTypes/Point object
other : Second DrawingTypes/Point object
properties : DrawingTypes/LineProperties object. Default set to na - meaning default values are used.
Returns: DrawingTypes/Line object
createLinefill(this, other, fillColor, transparency)
Creates DrawingTypes/Linefill object from DrawingTypes/Line object to other DrawingTypes/Line object
Parameters:
this : First DrawingTypes/Line object
other : Other DrawingTypes/Line object
fillColor : fill color of linefill. Default is color.blue
transparency : fill transparency for linefill. Default is 80
Returns: Array of DrawingTypes/Linefill object
createBox(this, other, properties, textProperties)
Creates DrawingTypes/Box object from one DrawingTypes/Point to other
Parameters:
this : First DrawingTypes/Point object
other : Second DrawingTypes/Point object
properties : DrawingTypes/BoxProperties object. Default set to na - meaning default values are used.
textProperties : DrawingTypes/BoxText object. Default is na - meaning no text will be drawn
Returns: DrawingTypes/Box object
createBox(this, properties, textProperties)
Creates DrawingTypes/Box object from DrawingTypes/Line as diagonal line
Parameters:
this : Diagonal DrawingTypes/PoLineint object
properties : DrawingTypes/BoxProperties object. Default set to na - meaning default values are used.
textProperties : DrawingTypes/BoxText object. Default is na - meaning no text will be drawn
Returns: DrawingTypes/Box object
Dynamo
╭━━━╮
╰╮╭╮┃
╱┃┃┃┣╮╱╭┳━╮╭━━┳╮╭┳━━╮
╱┃┃┃┃┃╱┃┃╭╮┫╭╮┃╰╯┃╭╮┃
╭╯╰╯┃╰━╯┃┃┃┃╭╮┃┃┃┃╰╯┃
╰━━━┻━╮╭┻╯╰┻╯╰┻┻┻┻━━╯
╱╱╱╱╭━╯┃
╱╱╱╱╰━━╯
Overview
Dynamo is built to be the Swiss-knife for price-movement & strength detection, it aims to provide a holistic view of the current price across multiple dimensions. This is achieved by combining 3 very specific indicators(RSI, Stochastic & ADX) into a single view. Each of which serve a different purpose, and collectively provide a simple, yet powerful tool to gauge the true nature of price-action.
Background
Dynamo uses 3 technical analysis tools in conjunction to provide better insights into price movement, they are briefly explained below:
Relative Strength Index(RSI)
RSI is a popular indicator that is often used to measure the velocity of price change & the intensity of directional moves. RSI computes the relative strength of the current price by comparing the security’s bullish strength versus bearish strength for a given period, i.e. by comparing average gain to average loss.
It is a range bound(0-100) variable that generates a bullish reading if average gain is higher, and a bullish reading if average loss is higher. Values over 50 are generally considered bullish & values less than 50 indicate a bearish market. Values over 70 indicate an overbought condition, and values below 30 indicate oversold condition.
Stochastic
Stochastic is an indicator that aims to measure the momentum in the market, by comparing most recent closing price of the security to its price range for a given period. It is based on the assumption that price tends to close near the recent high in an up trend, and it closes near the recent low during a down trend.
It is also range bound(0-100), values over 80 indicate overbought condition and values below 20 indicate oversold condition.
Average Directional Index(ADX)
ADX is an indicator that can quantify trend strength, it is derived from two underlying indices, known as Directional Movement Index(DMI). +DMI represents strength of the up trend, and -DMI represents strength of the down trend, and ADX is the average of the two.
ADX is non-directional or trend-neutral, which means, it does not follow the direction of the price, instead ADX will rise only when there is a strong trend, it does not matter if it’s an up trend or a down trend. Typical ranges of ADX are 25-50 for a strong trend, anything below 25 is considered as no trend or weak trend. ADX can frequently shoot upto higher values, but it generally finds exhaustion levels around the 60-75 range.
About the script
All these indicators are very powerful tools, but just like any other indicator they have their limitations. Stochastic & ADX can generate false signals in volatile markets, meaning price wouldn’t always follow through with what’s being indicated. ADX may even fail to generate a signal in less volatile markets, simply because it is based on moving averages, it tends to react slower to price changes. RSI can also lose it’s effectiveness when markets are trending strong, as it can stay in the overbought or oversold ranges for an extended period of time.
Dynamo aims to provide the trader with a much broader perspective by bringing together these contrasting indicators into a single simplified view. When Stochastic becomes less reliable in highly volatile conditions, one can cross validate their deduction by looking at RSI patterns. When RSI gets stuck in overbought or oversold range, one can refer to ADX to get better picture about the current trend. Similarly, various combinations of rules & setups can be formulated to get a more deterministic view, when working with either of these indicators.
There many possible use cases for a tool like this, and it totally depends on how you want to use it. An obvious option is to use it to trigger signals only after it has been confirmed by two or more indicators, for example, RSI & Stochastic make a great combination for cross-over or cross-under strategies. Some of the other options include trend detection, strength detection, reversals or price rejection points, possible duration of a trend, and all of these can very easily be translated into effective entry and exit points for trades.
How to use it
Dynamo is an easy-to-use tool, just add it to your chart and you’re good to start with your market analysis. Output consists of three overlapping plots, each of which tackle price movement from a slightly different angle.
Stochastic: A momentum indicator that plots the current closing price in relation to the price-range over a given period of time.
Can be used to detect the direction of the price movement, potential reversals, or duration of an up/down move.
Plotted as grey coloured histograms in the background.
Relative Strength Index(RSI): RSI is also a momentum indicator that measures the velocity with which the price changes.
Can be used to detect the speed of the price movement, RSI divergences can be a nice way to detect directional changes.
Plotted as an aqua coloured line.
Average Directional Index(ADX): ADX is an indicator that is used to measure the strength of the current trend.
Can be used to measure how strong the price movement is, both up and down, or to establish long terms trends.
Plotted as an orange coloured line.
Features
Provides a well-rounded view of the market movement by amalgamating some of the best strength indicators, helping traders make better informed decisions with minimal effort.
Simplistic plots that aim to convey clean signals, as a result, reducing clutter on the chart, and hopefully in the trader's head too.
Combines different types of indicators into a single view, which leads to an optimised use of the precious screen real-estate.
Final Note
Dynamo is designed to be minimalistic in functionality and in appearance, as it is being built to be a general purpose tool that is not only beginner friendly, but can also be highly-configurable to meet the needs of pro traders.
Thresholds & default values for the indicators are only suggestions based on industry standards, they may not be an exact match for all markets & conditions. Hence, it is advisable for the user to test & adjust these values according their securities and trading styles.
The chart highlights one of many possible setups using this tool, and it can used to create various types of setups & strategies, but it is also worth noting that the usability & the effectiveness of this tool also depends on the user’s understanding & interpretation of the underlying indicators.
Lastly, this tool is only an indicator and should only be perceived that way. It does not guarantee anything, and the user should do their own research before committing to trades based on any indicator.

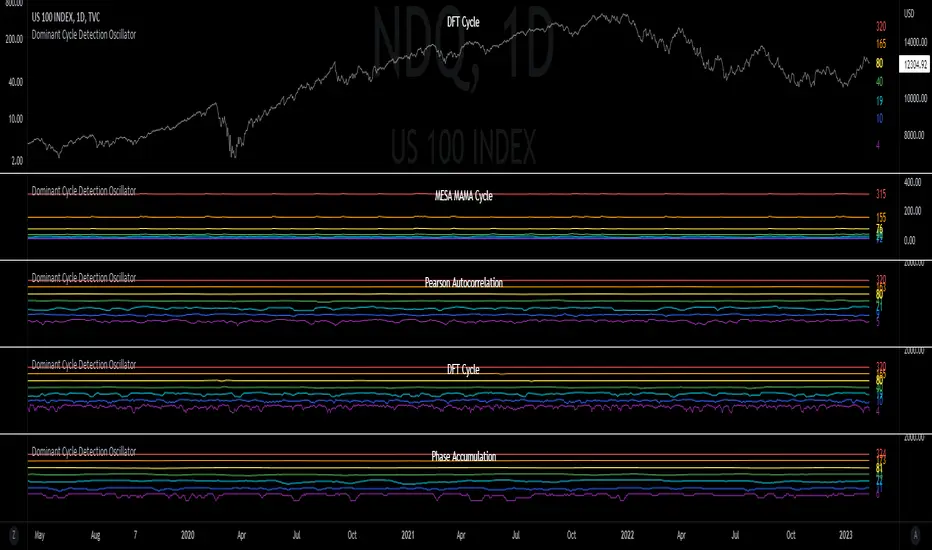
Dominant Cycle Detection OscillatorThis is a Dominant Cycle Detection Oscillator that searches multiple ranges of wavelengths within a spectrum. Choose one of 4 different dominant cycle detection methods (MESA MAMA cycle, Pearson Autocorrelation, Discreet Fourier Transform, and Phase Accumulation) to determine the most dominant cycles and see the historical results. Straight lines can indicate a steady dominant cycle; while Wavy lines might indicate a varying dominant cycle length. The steadier the cycle, the easier it may be to predict future events in that cycle (keep the log scale in mind when considering steadiness). The presence of evenly divisible (or harmonic) cycle lengths may also indicate stronger cycles; for example, 19, 38, and 76 dominant lengths for the 2x, 4x, and 8x cycles. Practically, a trader can use these cycle outputs as the default settings for other Hurst/cycle indicators. For example, if you see dominant cycle oscillator outputs of 38 & 76 for the 4x and 8x cycle respectively, you might want to test/use defaults of 38 & 76 for the 4x & 8x lengths in the bandpass, diamond/semi-circle notation, moving average & envelope, and FLD instead of the defaults 40 & 80 for a more fine-tuned analysis.
Muting the oscillator's historical lines and overlaying the indicator on the chart can visually cue a trader to the cycle lengths without taking up extra panes. The DFT Cycle lengths with muted historical lines have been overlayed on the chart in the photo.
The y-axis scale for this indicator's pane (just the oscillator pane, not the chart) most likely needs to be changed to logarithmic to look normal, but it depends on the search ranges in your settings. There are instructions in the settings. In the photo, the MESA MAMA scale is set to regular (not logarithmic) which demonstrates how difficult it can be to read if not changed.
In the Spectral Analysis chapter of Hurst's book Profit Magic, he recommended doing a Fourier analysis across a spectrum of frequencies. Hurst acknowledged there were many ways to do this analysis but recommended the method described by Lanczos. Currently in this indicator, the closest thing to the method described by Lanczos is the DFT Discreet Fourier Transform method.
Shoutout to @lastguru for the dominant cycle library referenced in this code. He mentioned that he may add more methods in the future.
TradePro's 2 EMA + Stoch RSI + ATR StrategySaw TradePro's "NEW BEST HIGHEST PROFITING STRATEGY WITH CRAZY RESULTS - 2 EMA+ Stochastic RSI+ ATR", and was curious on the back testing results. This strategy is an attempt to recreate it.
This strategy uses 50 / 200 EMAs, Stochastic RSI and ATR.
Long Entry Criteria:
- 50 EMA > 200 EMA
- Price closes below 50 EMA
- Stochastic RSI has gone into oversold < 20
- Stochastic RSI crosses up while making higher low from previous cross up
Short Entry Criteria:
- 50 EMA < 200 EMA
- Price closes above 50 EMA
- Stochastic RSI has gone into overbought > 80
- Stochastic RSI crosses down while making lower high from previous cross down
Stop-loss is set to ATR stop-loss
Take Profit is 2x the risk
All parameters are configurable.
Enjoy~~

Zig Zag Stochastic (ZZS)The "Zig Zag Stochastic" indicator is an indicator that uses a combination of zigzag pivot points and exponential smoothing to calculate a stochastic-like oscillator.
The indicator starts by identifying pivot high and pivot low points in the price data using the Zigzag indicator. These pivot points are then used to calculate the scale_price, which is a ratio of the current close price to the range between the current pivot high and pivot low.
Next, the scale_price is smoothed using exponential smoothing. The user can input the desired length of the smoothing period, with a default value of 14. If the user sets the smoothing length to 0, the indicator will automatically calculate the optimal smoothing length using the MAMA period calculation from the Dominant Cycle Estimators library.
The smoothed scale_price is then used to calculate two lines: the K-line and the D-line, both of which are also smoothed using exponential smoothing. The K-line is the main oscillator line and is similar to the %K line in a traditional stochastic oscillator. The D-line is a signal line, similar to the %D line in a traditional stochastic oscillator.
The indicator plots the smoothed scale_price, the K-line, and the D-line. Additionally, it includes horizontal lines at the 80 and 20 levels, and fills the area between them to help identify overbought and oversold conditions.

Hurst Diamond Notation PivotsThis is a fairly simple indicator for diamond notation of past hi/lo pivot points, a common method in Hurst analysis. The diamonds mark the troughs/peaks of each cycle. They are offset by their lookback and thus will not 'paint' until after they happen so anticipate accordingly. Practically, traders can use the average length of past pivot periods to forecast future pivot periods in time🔮. For example, if the average/dominant number of bars in an 80-bar pivot point period/cycle is 76, then a trader might forecast that the next pivot could occur 76-ish bars after the last confirmed pivot. The numbers/labels on the y-axis display the cycle length used for pivot detection. This indicator doesn't repaint, but it has a lot of lag; Please use it for forecasting instead of entry signals. This indicator scans for new pivots in the form of a rainbow line and circle; once the hi/lo has happened and the lookback has passed then the pivot will be plotted. The rainbow color per wavelength theme seems to be authentic to Hurst (or modern Hurst software) and has been included as a default.

RSI Pull-BackA pull-back occurs whenever the price or the value of an indicator breaks a line and comes back to test it before continuing in the prevailing trend.
The RSI has oversold and overbought levels such as 20 and 80 and whenever the market breaks them returns to normality, we can await a pull-back to them before the reversal continues.
This indicator shows the following signals:
* A bullish signal is generated whenever the RSI surpasses the chosen oversold level then directly shapes a pull-back to it without breaking it again.
* A bearish signal is generated whenever the RSI breaks the chosen overbought level then directly shapes a pull-back to it without surpassing it again.

Strategija TrioThis is a Primo #4 with extra ADX condition to avoid range bound enviroments.
1. ADX must be above 20
2. Price above 50 SMA for long and below 50 SMA for short settings.
3. Short EMA above Middle EMA
4. Pullback and 80 % bounce from Middle EMA within 2 bars
Risk/reward ratio and fund management is eseential, I recomend at least 3/1 and no more than 3 %. Arrows depict the entry bars, Data window shows the Take profit and Stop loss prices
Feel free to adjust it or use it on your own. This is not a financial advice.

Stoch RSI 15 min - multi time frame tableABOUT THIS INDICATOR
This indicator calculates the Stochastic RSI for the time frames 15 min, 30 min, 1h, 4h, and 12h. However, the 15 min time frame should always be the default time frame for your chart.
IMPORTANT
* NOTE! It's extremely important that the chosen time frame for your chart is 15 min. Otherwise the Stochastic RSI for the longer time frames won’t be correctly calculated.
* Stochastic RSI will be calculated and displayed in a table for the time frames: 15 min, 30 min, 1h, 4h, 12h.
* All time frames are based on closed bars except the "15minR" that are realtime updated values calculated on a 15 min time frame.
ABOUT STOCHASTIC RSI
The Stochastic RSI (StochRSI) is a momentum indicator that ranges between 0 and 100. A Stochastic RSI value above 80 is considered overbought and below 20 is considered oversold.
By using different time frames you can get a better idea of what direction the trade could take in a "longer" perspective.
SETTINGS
1.) Length RSI = 14 (default period)
2.) Smoothing parameter of Stochastic RSI (Length Moving Average = 3) . Moving average of stochastic RSI
* By default the displayed Stochastic RSI values are smoothed values of the actual Stochastic RSI. The smoothnes is formed by a calculated moving average of with the length of 3 by default.
If you want Stochastic RSI with a sharper signal (higher risk for "false alarms" being more sensitive) change the Length Moving Average to = 1 (no smoothness at all)
You can see the selected "Length RSI" and "Length Moving Average" on top of the Stochastic RSI table.
Next version of this script will be updated with more a more flexible solution for different time frames.
* NOTE, Tradingview comes with a inbuilt Stochastic RSI. See the the chart below. The blue line in the Stochastic-RSI chart represents (K value = 3) the same value as the script calculate/display in the table.

Impulse Alerts - Riccardo Di GiacomoThis is the Impulse indicator that allows you to receive alerts in the case one of the following situation occurs:
1) Buy Setup
- Price above Exponential Moving Average 260
- Moving Average 21 above Exponential Moving Average 260
- Moving Average 9 above Moving Average 21
- RSI(14) above 50
- Stochastic equal or below 20
2) Sell Setup
- Price below Exponential Moving Average 260
- Moving Average 21 below Exponential Moving Average 260
- Moving Average 9 below Moving Average 21
- RSI(14) below 50
- Stochastic equal or above 80
The Bollinger Bands represents another useful information:
- If the price is near the upper band when the first situation occurs, it is another green light, otherwise be careful
- If the price is near the lower band when the second situation occurs, it is another green light, otherwise be careful

BugiCoThis indicator is designed for shorter time frames - specifically 15 minutes to 1 minute.
It is scalping tool that users William Bollinger setup on various time frames.
This indicator will give you an edge and a way of thinking that you NEVER THOUGHT before because it has a story.
This indicator isolates between 0 and 100. Below around 20 is a buy, above 80 is a sell.
In these locations, try to formulate a scalping strategy with stop loss and risk management. If you don't do that, you will go broke quick in any indicator setup anyways. Be smart...
Story Of This Indicator
~ Took me a while to understand Bollinger Bands and i knew a ton about Fibonacci indicators. So decided to combine fibonacci and bollinger together across different time frames, which is the key. Use as small of a time frame as possible and use it all across the board. The game is designed to rob you either way BUT at least you will have a chance to see what your masters are already taking a look at. There are more complicated tools than this but understand this simple thing "Only way to win in this market to is to do the opposite of the crowd and steal as much money as possible". Create tools that can show you this to "WIN"...
I have a ton of other tools that can change everything for your trading/investing. Reach out to me if you have any questions.
Best wishes
~Megalodon
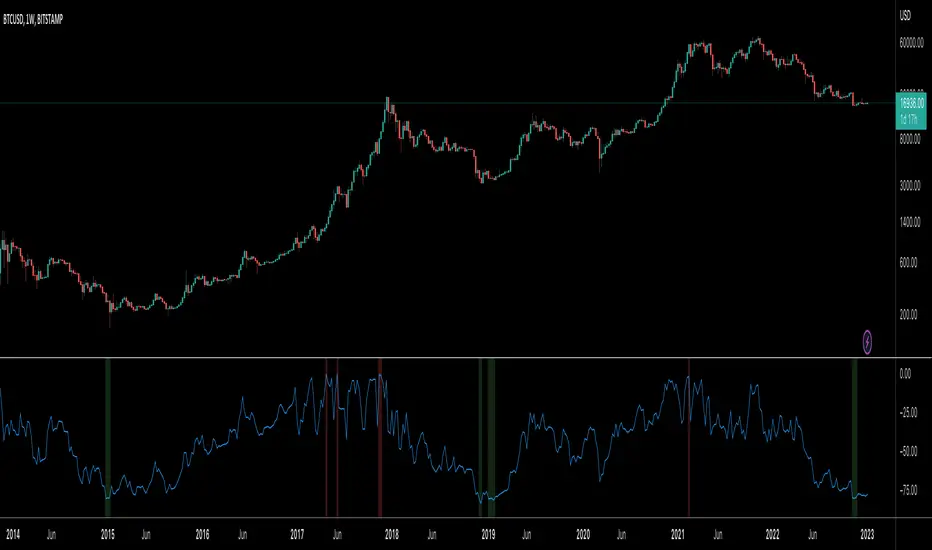
BTC Indicator By Megalodon TradingThis indicator is designed help you see the potential reversal zones and it helps you accumulate for the long run.
This combines price data on any chart. The chart isolates between 0 and -100. Below -80 is a buy, above -20 is a sell location.
In these locations, try to Slowly Buy and Slowly Sell (accumulate...)
Story Of This Indicator
~I was always obsessed with Fibonacci and used Fibonacci all the time. Thus, i wanted to make a tool to see buying locations and selling locations.
Instead of drawing fibonacci's and manually interpreting buy/sell locations, i wanted algorithms to do the job for me. So, i created this algorithm and many more like it.
If you think i did a good job and want to do further work with me, feel free to contact.
I have a ton of other tools that can change everything for your trading/investing.
Best wishes
~Megalodon
[ChasinAlts]Top-Wicked Good S/R LinesHello Tradeurs, as per usual, I hope everyone is having a FAN-FRIGGIN-TASTIC day. With the soon incoming bull market approaching fast(Nov 7, 2022), there are a few ideas that I've really been trying to push out to help nail a few coins as they are near their bottom peak of this closing Bear Market. This one may seem very similar to the last one I posted but I think this one takes the cake...esp when you see the next script from my 'Market Overview' series that I will be publishing shortly after this one as it is utilizing this new script for a market scanner that will be SUPER legit and profitable. Though it is alway nice to be noticed, I'm glad that I'm relatively unpopular so the few people that are now following me can have some time to make some money with some of these scripts I'm trying to pump out for the benefit of the community. I will rarely give my full analysis of how I take in and utilize these scripts but I can tell you, QUITE A FEW of them are money in the bank. Esp these last few I've done/am doing and even more-so the ones that are soon to come (I'm speaking of about the next 3-4 that I will be attempting to pump out in this next VERY IMPORTANT week.). One more thing I'll add before going to the script is a little alpha(Im pretty certain this is the way it is going but NOTHING is EVERY 100% in life). What I believe should be realized is the bottoming out of MANY of the crypto coins at the VERY bottom of a LONG TERM Cup and Handle (so it seems but shat can still change in the blink of an eye). Thus there are quite a few coins that I believe have already bottomed and wont be returning to said bottom for a few years or so but there are also quite a few still at the brink of the bottomest part before the real market breakout occurs. My goal with these scripts coming out this week to help you all find those coins that have yet to hit their very bottom (thus the ATH/ATL script recently published). Going back in history looking for the lowest points of long term Cup & Handles I will point out 2 key things. Near the center/bottomest part of these historical CnH you will see either Double Bottoms OR a Huge dump and then its V-shaped recovery. After these print the point of no return has occurred where only a few coins will be going lower than these Double Bottoms/V-Shaped recoveries. So the time is at hand. Now that many coins are seemingly pumping after this long consolidation, I believe we need to keep a keen eye out for THE FINAL RUG PULL (as soon as enough degenerates are leveraging Long their entire savings.). What Im saying is be ready for this final rug pull to finally be seeing these Double Bottoms/V-Shaped recoveries VERY soon. DO NOT waste all your capital yet and MAKE SURE to use stop losses or else rather than stop losses you will be burdened with MUCH WORSE losses. Im currently not even in the market bc I am waiting on said rug pull. Ok for the Script now.
This script is similar to the last one but with the previous one, one general set of settings can produce VASTLY different results (might have 2 S/R lines on one coin and 80 on another). I wanted to fix that with this script, turn it into a "Market Overview" Scanner and create alerts for the MO Scanner to be able to get alerted any time a coin is passing its largest wick S/R levels bc DULY NOTE...it is VERY rare that a coin will blow past it if it hasn't approached it recently. That means that a small retrace of 3-5%(or more) is EASY to acquire (with leverage that can really add up with how many coins are in the Kucoin Margin Coin list that I have in my scanners). Now, once price does shoot through a level you best be sure to be looking down the line for a retest of the S/R level it blew past before as they are MANY times the retest level and price will be coming back to it before continuing
in the direction it was going. Depending on the TF your using this could be a few hours to a few days to a few weeks...you get it. With this script you can choose to draw S/R lines 2 ways: 1) by having it plot S/R lines on the end of the largest 2(3,4,5..however many you choose) wicks that the chart has access to. For the scanner ill just be putting the largest 2-3 wicks and set alerts when coming up to them/crossing them & 2) having it draw S/R lines on the ends of the largest X% of wicks. it will be erasing the lines and drawing new ones on each new candle occurrence so the same general settings will no longer be producing VASTLY diff amounts of S/R lines and will be way more consistent amongst the coins for better utilization with the scanner (when I publish it). There is also a Wick Max Cutoff % so for those coins that had it's first few hours printing 100% sized wicks...you can choose to ignore them so they are not taking up one of your top spots for the S/R lines. There is similarly a Wick % min Size that can be selected so if you’re using the top % setting, it will help decrease those coins that can be still plotting 30 lines even though the top 3% of the largest wicks are set in the settings. Hope Im being clear but it's easy enough. I believe in you and your capabilities of comprehending it all and getting it all figured out. So this script is for a visualization for the scanner that I will be uploading soon-after. It's always nice to get a few comments if my ideas/scripts have been helpful to you and please don't hold back if you have something to tell me that I screwed up on (I am still rather new to this coding thing but I like to think I at least have some fresh ideas that aren’t out there in the public library). Talk to you soon and may the force be with your trades. Peace and love people...peace and love. -ChasinAlts out.

Sw1tchFX - Average Daily RangeDESCRIPTION AND OVERVIEW
The Average Daily Range is a measure of volatility (typically across 5 days for the FX markets). I originally saw this being used in a trading system called ANTSSYS by Daryll Guppy and some other developers. I couldn't find it anywhere so I decided to build it from scratch.
What this does is allow you to measure volatility across various FX assets (I will apply other asset classes in the future that this is applicable to i.e. Crypto, Commodities, Blue Chip Stocks), and set realistic targets based off that volatility. Overall, this makes much more sense to me in the FX markets rather than support and resistance lines because it's based off the actual movement of the asset class. Market research shows that an asset class has a 80-85% chance to reach 75% of it's Average Daily Range (ADR).
Let's take a look at the daily ADR on the GBPNZD 15m chart. Notice how the values of the ADR act as real support and resistance based off the volatility of the asset. In this case, price did not quite reach the 75% ADR target.
Let's take a look at another example on EURNZD 15m chart. In this case, price hit the 75% target.
It's important to note that these levels do not bound the price. The probability that price exceeds it's 75% ADR is fairly low, but not impossible. Especially during important news events. Let's look at the recent USDCHF 15m chart for example.
Additionally, you can use these values to measure longer term movements (Weekly, and Monthly)
Here is a weekly view:
And a monthly view:
HOW I USE THIS
I use this in conjunction with some other indicators I've developed. Typically, I use range bars since I only care about price, not time. Additionally, averages are smoother when time is not taken into account and only price.
HOW THE CANDLE OPEN AND CLOSE IS CALCULATED
This is done based off of your own specific time zone and from the daily candle. So for me on PST, the daily candle will close at 1400. Once closed, a new ADR value is automatically calculated and added to the chart. There is an option to show past ADR values if you would like to see them or conduct additional research.

UFO + Realtime Divergences (UO x MFI)UFO + Realtime Divergences (UO x MFI) + Alerts
The UFO is a hybrid of two powerful oscillators - the Ultimate Oscillator (UO) and the Money Flow Index (MFI)
Features of the UFO include:
- Optional divergence lines drawn directly onto the oscillator in realtime.
- Configurable alerts to notify you when divergences occur, as well as centerline crossovers.
- Configurable lookback periods to fine tune the divergences drawn in order to suit different trading styles and timeframes.
- Background colouring option to indicate when the oscillator has crossed its centerline.
- Alternate timeframe feature allows you to configure the oscillator to use data from a different timeframe than the chart it is loaded on.
- 2x MTF triple-timeframe Stochastic RSI overbought and oversold confluence signals painted at the top of the panel for use as a confluence for reversal entry trades.
The core calculations of the UFO+ combine the factory settings of the Ultimate Oscillator and Money Flow Index, taking an average of their combined values for its output eg:
UO_Value + MFI_Value / 2
The result is a powerful oscillator capable of detecting high quality divergences, including on very low timeframes and highly volatile markets, it benefits from the higher weighting of the most recent price action provided by the Ultimate Oscillators calculations, as well as the calculation of the MFI, which incorporates volume data. The UFO and its incorporated 2x triple-timeframe MTF Stoch RSI overbought and oversold signals makes it well adapted for low timeframe scalping and regular divergence trades in particular.
The Ultimate Oscillator (UO)
Tradingview describes the Ultimate Oscillator as follows:
“The Ultimate Oscillator indicator (UO) is a technical analysis tool used to measure momentum across three varying timeframes. The problem with many momentum oscillators is that after a rapid advance or decline in price, they can form false divergence trading signals. For example, after a rapid rise in price, a bearish divergence signal may present itself, however price continues to rise. The Ultimate Oscillator attempts to correct this by using multiple timeframes in its calculation as opposed to just one timeframe which is what is used in most other momentum oscillators.”
You can read more about the UO and its calculations here
The Money Flow Index ( MFI )
Investopedia describes the True Strength Indicator as follows:
“The Money Flow Index ( MFI ) is a technical oscillator that uses price and volume data for identifying overbought or oversold signals in an asset. It can also be used to spot divergences which warn of a trend change in price. The oscillator moves between 0 and 100. Unlike conventional oscillators such as the Relative Strength Index ( RSI ), the Money Flow Index incorporates both price and volume data, as opposed to just price. For this reason, some analysts call MFI the volume-weighted RSI .”
You can read more about the MFI and its calculations here
The Stochastic RSI (relating to the built-in MTF Stoch RSI feature)
The popular oscillator has been described as follows:
“The Stochastic RSI is an indicator used in technical analysis that ranges between zero and one (or zero and 100 on some charting platforms) and is created by applying the Stochastic oscillator formula to a set of relative strength index ( RSI ) values rather than to standard price data. Using RSI values within the Stochastic formula gives traders an idea of whether the current RSI value is overbought or oversold. The Stochastic RSI oscillator was developed to take advantage of both momentum indicators in order to create a more sensitive indicator that is attuned to a specific security's historical performance rather than a generalized analysis of price change.”
You can read more about the Stochastic RSI and its calculations here
How do traders use overbought and oversold levels in their trading?
The oversold level, that is when the Stochastic RSI is above the 80 level is typically interpreted as being 'overbought', and below the 20 level is typically considered 'oversold'. Traders will often use the Stochastic RSI at an overbought level as a confluence for entry into a short position, and the Stochastic RSI at an oversold level as a confluence for an entry into a long position. These levels do not mean that price will necessarily reverse at those levels in a reliable way, however. This is why this version of the Stoch RSI employs the triple timeframe overbought and oversold confluence, in an attempt to add a more confluence and reliability to this usage of the Stoch RSI .
What are divergences?
Divergence is when the price of an asset is moving in the opposite direction of a technical indicator, such as an oscillator, or is moving contrary to other data. Divergence warns that the current price trend may be weakening, and in some cases may lead to the price changing direction.
There are 4 main types of divergence, which are split into 2 categories;
regular divergences and hidden divergences. Regular divergences indicate possible trend reversals, and hidden divergences indicate possible trend continuation.
Regular bullish divergence: An indication of a potential trend reversal, from the current downtrend, to an uptrend.
Regular bearish divergence: An indication of a potential trend reversal, from the current uptrend, to a downtrend.
Hidden bullish divergence: An indication of a potential uptrend continuation.
Hidden bearish divergence: An indication of a potential downtrend continuation.
How do traders use divergences in their trading?
A divergence is considered a leading indicator in technical analysis , meaning it has the ability to indicate a potential price move in the short term future.
Hidden bullish and hidden bearish divergences, which indicate a potential continuation of the current trend are sometimes considered a good place for traders to begin, since trend continuation occurs more frequently than reversals, or trend changes.
When trading regular bullish divergences and regular bearish divergences, which are indications of a trend reversal, the probability of it doing so may increase when these occur at a strong support or resistance level . A common mistake new traders make is to get into a regular divergence trade too early, assuming it will immediately reverse, but these can continue to form for some time before the trend eventually changes, by using forms of support or resistance as an added confluence, such as when price reaches a moving average, the success rate when trading these patterns may increase.
Typically, traders will manually draw lines across the swing highs and swing lows of both the price chart and the oscillator to see whether they appear to present a divergence, this indicator will draw them for you, quickly and clearly, and can notify you when they occur.
Setting alerts.
With this indicator you can set alerts to notify you when any/all of the above types of divergences occur, on any chart timeframe you choose.
Configurable pivot period.
You can adjust the default pivot lookback values to suit your prefered trading style and timeframe. If you like to trade a shorter time frame, lowering the default lookback values will make the divergences drawn more sensitive to short term price action.
Disclaimer: This script includes code from the stock UO and MFI by Tradingview as well as the Divergence for Many Indicators v4 by LonesomeTheBlue.

Chef MomentumChef momentum is a simple stochastic indicator that uses the hull moving average (hma). The oscillator can be used like most oscillators available.
Default setting:
%K length: 25
%K smoothing: 100
The user can adapt the parameters to study other values.
how to use :
When the length of the stoch K crossover hline 25 , a green circle appears which indicates the potential arrival of momentum.
When the length of the stock K crossover hline 80 , a red circle appears indicating the potential end of the momentum.

Bearish Market Indicator V2Definition
Have you ever wonder whether if the stock/index/market is "bearish" ? A Bearish Market Indicator (B.M.I) is not a new concept, the definition is simply 20% lower from the recent (term: short-term, recent: usually within a year, a.k.a 1 year) highs (closing price with in the recent period or within in a year or simply a 52-Week High). It is called “bearish” by definition when the closing price is below 20% from the highest price within the year (52-Week high: Green Line). To visualize the “20%” below the recent highs, there is a plot (line: light yellow color in the middle) called a Bearish Market By Definition Value. For example, the SPX 500 has been in a bearish market which is why there is a purple color highlight over the 52-Week High (green line) since September 21, 2022 because the closing price is below the Bearish Market By Definition Value (light yellow color) or “20% below the recent highs”. Finally, there is a red line under in the graph and it is the lowest price within a year. So when you hear, “this ticker is at a 52-Week Low”, you know what it means.
Line Summary:
Green Color Line = 52-Week High
Yellow Color Line = 20% away from the 52-Week High or Bearish Market By Definition Value
Red Color Line = 52-Week Low
Color Summary:
Red Color = Bad
Saturated Red Color = Very Bad
Purple Color = Bearish (It may look pink: red + purple)
White Color = Less Bad (That’s because there is no certainty only probability)
Green Color = Not too Bad (That’s because there is no certainty only probability)
Now to more complicated Metrics
>> If you do not like the technical indicators, go to the indicator settings, uncheck the tables. Otherwise, please continue reading. <<
Pre-requisites
+ Understand that the indicators are lagging indicators.
+ Using it under “D” or “Day” interval
+ Already Understand: Moving Averages, Stochastic-RSI, RSI, Super Trend and MACD.
+ Please be aware that this might not be compatible with traders!
Indicators
This B.M.I is fused (comprised, combined) with multiple indicators:
- Moving Averages
I would not rely just on the Moving Averages (MA) since it is a lagging indicator. The values are derived by finding the differences with respect to the MAs (between the closing price and with the respect MA).
- Stochastic-RSI
Stochastic and RSI combo with RSI-Color coating. The first value is the rsi-stochastic-k followed by the rsi-stochastic-d both are compartmentalized with “|”.
Parameter:
Numbers > 80 Not Good
Numbers < 20 Is it time? (You can manually verify the lines (k, d) or the values from them)
- Relative Strength Index (RSI)
The first value is the rsi followed by the rsi-ma both are compartmentalized with “|”. It is also coated with RSI-color.
Parameter:
Numbers > 70 Overbought | Color Red
If the RSI > RSI’s MA = Green
If the RSI < RSI’s MA = Red
Numbers < 30 Oversold | Color Red
- Moving Averages Convergence Divergence (MACD)
The first value is the MACD-line followed by the signal-line both are compartmentalized with “|”.
Macd-line > signal line = green
Macd-line < signal line = red
- Supertrend (please look up from the documentation; i can not embed the link)
Think of this way, you’re riding a wave. If the wave is climbing, expect the price to follow.
Direction < 0 = Green
Direction > 0 = Red
- Other Trend similar to supertrend
This is similar to the Super Trend according the some. Imagine you’re drawing a trend line manually within 6 months.
Within the period, the line gets smoothed over and over til the n=9.
> If the closing is less than the 9th value, it implies the trend is slowing down.
Usage
Adjustments
+ Since there are different holidays from different countries, you can change the BMI-Period from the indicator settings “BMI-4khansolo”.
+ You can hide Technical Indicator Tables, it is also under the settings (see above).
> This will show red over the 52-Week high if it tests for positive .
Purpose
Do you like eating the same food over and over? No! I love different food! I also love a variety of indicators. Especially, I love having MULTIPLE indicators presented in one canvas at the same time (personalized).
After spending a lot of time, I want to share my “FOOD” which is made of different ingredients (indicators) with someone who appreciates food! This Makes me a chef isn't it? Yes! Chef!
Questions?
If you have questions or spotted errors, please comment them below so that I can improve.
Sources
All the materials (i.e., functions like ta.rsi, etc...) used in here are available in the platform.
All the references or sources materials are commented with the code since the I am not allowed to put them here.

RF+ Divergence Scalping SystemRF+ Divergence Scalping System + Custom Signals + Alerts.
This chart overlay indicator has been developed for the low timeframe divergence scalper.
Built upon the realtime divergence drawing code from the Divergence for Many indicator originally authored by Lonsometheblue, this chart overlay indicator bundles several additional unique features and modifications to serve as an all-in-one divergence scalping system. The current key features at the time of publishing are listed below (features are optional and can be enabled or disabled):
- Fully configurable realtime divergence drawing and alerting feature that can draw divergences directly on the chart using data sourced from up to 11 oscillators selected by the user, which have been included specifically for their ability to detect divergences, including oscillators not presently included in the original Divergence for Many indicator, such as the Ultimate Oscillator and TSI.
- Optional on chart table showing a summary of key statuses of various indicators, and nearby divergences.
- 2 x Range Filters with custom settings used for low timeframe trend detection.
- 3 x configurable multi-timeframe Stochastic RSI overbought and oversold signals with presentation options.
- On-chart pivot points drawn automatically.
- Automatically adjusted pivot period for up to 4 configurable time frames to fine tune divergences drawn for optimal divergence detection.
- Real-price line for use with Heikin Ashi candles, with styling options.
- Real-price close dots for use with Heikin Ashi candles, with styling options.
- A selection of custom signals that can be printed on-chart and alerted.
- Sessions indicator for the London, New York, Tokyo and Sydney trading sessions, including daylight savings toggle, and unique ‘invert background color’ option, which colours the entire chart - except the trading session you have selected, leaving your chart clear of distracting background color.
- Up to 4 fully configurable moving averages.
- Additional configurable settings for numerous built in indicators, allowing you to alter the lengths and source types, including the UO, TSI, MFI, TSV, 2 x Range Filters.
- Configurable RSI Trend detection signal filter used in a number of the signals, which filters buy signals where the RSI is over the RSI moving average, and only prints sell signals where RSI is under the moving average.
- Customisable on-chart watermark, with inputs for a custom title, subtitle, and also an optional symbol | timeframe | date feature.
The Oscillators able to be selected for use in drawing divergences at the time of publishing are as follows:
- Ultimate Oscillator (UO)
- True Strength Indicator (TSI)
- Money Flow Index (MFI)
- Cumulative Delta Volume (CDV)
- Time Segmented Volume (TSV)
- Commodity Channel Index (CCI)
- Awesome Oscillator
- Relative Strength Index (RSI)
- Stochastic
- On Balance Volume (OBV)
- MACD Histogram
What are divergences?
Divergence is when the price of an asset is moving in the opposite direction of a technical indicator, such as an oscillator, or is moving contrary to other data. Divergence warns that the current price trend may be weakening, and in some cases may lead to the price changing direction.
There are 4 main types of divergence, which are split into 2 categories;
regular divergences and hidden divergences. Regular divergences indicate possible trend reversals, and hidden divergences indicate possible trend continuation.
Regular bullish divergence: An indication of a potential trend reversal, from the current downtrend, to an uptrend.
Regular bearish divergence: An indication of a potential trend reversal, from the current uptrend, to a downtrend.
Hidden bullish divergence: An indication of a potential uptrend continuation.
Hidden bearish divergence: An indication of a potential downtrend continuation.
Setting alerts.
With this indicator you can set alerts to notify you when any/all of the above types of divergences occur, on any chart timeframe you choose, also when the triple timeframe Stochastic RSI overbought and oversold confluences occur, as well as when custom signals are printed.
Configurable pivot period values.
You can adjust the default pivot period values to suit your prefered trading style and timeframe. If you like to trade a shorter time frame, lowering the default lookback values will make the divergences drawn more sensitive to short term price action. By default, this indicator has enabled the automatic adjustment of the pivot periods for 4 configurable time frames, in a bid to optimize the divergences drawn when the indicator is loaded onto any of the 4 time frames selected. These time frames and their associated pivot periods can be fully reconfigured within the settings menu. By default, these have been further optimized for the low timeframe scalper trading on the 1-15 minute time frames.
How do traders use divergences in their trading?
A divergence is considered a leading indicator in technical analysis , meaning it has the ability to indicate a potential price move in the short term future.
Hidden bullish and hidden bearish divergences, which indicate a potential continuation of the current trend are sometimes considered a good place for traders to begin, since trend continuation occurs more frequently than reversals, or trend changes.
When trading regular bullish divergences and regular bearish divergences, which are indications of a trend reversal, the probability of it doing so may increase when these occur at a strong support or resistance level . A common mistake new traders make is to get into a regular divergence trade too early, assuming it will immediately reverse, but these can continue to form for some time before the trend eventually changes, by using forms of support or resistance as an added confluence, such as when price reaches a moving average, the success rate when trading these patterns may increase.
Typically, traders will manually draw lines across the swing highs and swing lows of both the price chart and the oscillator to see whether they appear to present a divergence, this indicator will draw them for you, quickly and clearly, and can notify you when they occur.
How do traders use overbought and oversold levels in their trading?
The oversold level is when the Stochastic RSI is above the 80 level is typically interpreted as being 'overbought', and below the 20 level is typically considered 'oversold'. Traders will often use the Stochastic RSI at, or crossing down from an overbought level as a confluence for entry into a short position, and the Stochastic RSI at, or crossing up from an oversold level as a confluence for an entry into a long position. These levels do not mean that price will necessarily reverse at those levels in a reliable way, however. This is why this version of the Stoch RSI employs the triple timeframe overbought and oversold confluence, in an attempt to add a more confluence and reliability to this usage of the Stoch RSI.
This indicator is intended for use in conjunction with related panel indicators including the TSI+ (True Strength Indicator + Realtime Divergences), UO+ (Ultimate Oscillator + Realtime Divergences), and optionally the STRSI+ (MTF Stochastic RSI + Realtime Divergences) and MFI+ (Money Flow Index + Realtime Divergences) available via this authors’ Tradingview profile, under the scripts section. The realtime divergence drawing code will not identify all divergences, so it is suggested that you also have panel indicators to observe. Each panel indicator also offers additional means of entry confirmation into divergence trades, for example, the Stochastic can indicate when it is crossing down from overbought or up from oversold, the TSi can indicate when the 2 TSI bands cross over one another upward or downward, and the UO and MFI can indicate an entry confluence when they are nearing, or crossing their centerlines, for more confidence in your divergence trade entries.
Additional information on the settings for this indicator can be found via the tooltips within the settings menu itself. Further information on feature updates, and usage tips & tricks will be added to the comments section below in due course.
Disclaimer: This indicator uses code adapted from the Divergence for Many v4 indicator authored by Lonesometheblue, and several stock indicators authored by Tradingview. With many thanks.

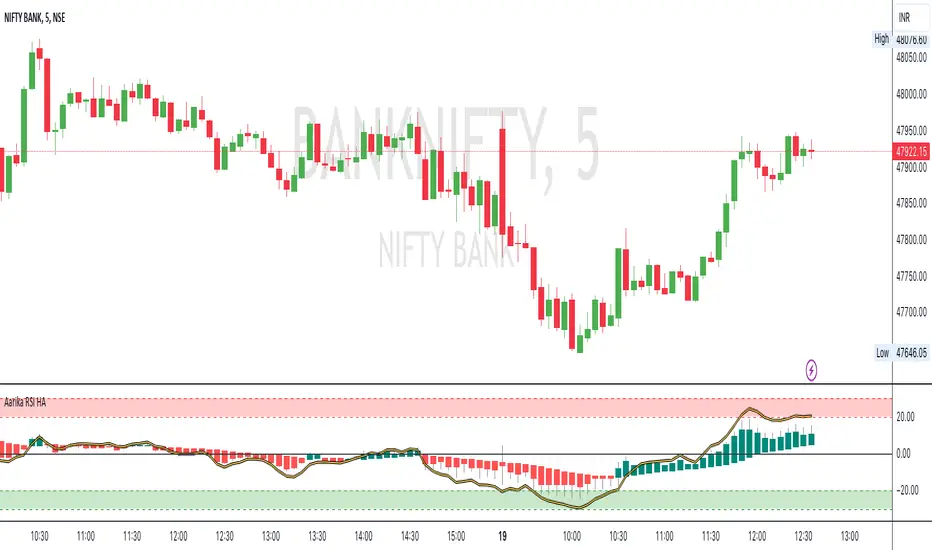
Aarika RSIHello traders, purpose of creating this indicator is simply trying to analyse the trend of any symbol.
This indicator can be used on any script like Indices, Stocks, Future, Currency & Crypto.
This RSI version is much simpler to identify the trend of the script than that of traditional RSI trendline. Rather than showing a line, this RSI indicates bars for better and clear visibility of RSI levels.
This is a modified version of © ParkF. I have modified it to simplest possible manner.
How to trade:
RSI level 80, I consider this as extreme-bought which means high chance if bear market from this point on any given timeframe. Whereas 20 is considered as extreme-sold and have a chance to go higher from the current level.
I recommend you to study this RSI before putting it into practice.
Always start with small target and then go for big one by trailing your profit. This is not a Holy Grail indicator which always gives profit but if you practice this indicator with consistency, your portfolio may give good returns.
Use proper money management for any trade. Go for paper trade and observe how this indicator behaves and once satisfied then only take real trade.
Disclaimer: Please make sure you study this indicator on different timeframes because inserted set of data may act differently on different scripts and may vary from timeframe to timeframe.
We advice you to use this indicator for trend-analysis and study purpose only. Author/publisher of this indicator is not responsible for your profit or loss if you use this indicator for trading purpose one way or another.
N.B.: We do not recommend using HeikinAshi charting for this particular indicator as the data inputs may behave differently than expected. If you have any query, you may comment below.