Vortex Range Breakout SystemThis is a Vortex Based Visual System,
Which can help you identify the Vortex Crosses based Range Breakouts/ Breakdown, over the price Scale,
How its made ?
The vortex Crosses are projected over the Price
on Same Time frame {Green and Red Filled area}
-> green Area means : Vortex Crossover Range
-> red Area means : Vortex Crossunder Range
and on Higher Timeframe
Vortex Cross Levels are Plotted, which you see as :
Blue and Orange Lines
Default Configs
Vortex Period is 14
Higher Timeframe Option is set to 60 mins
You can change the Higher timeframe to any minutes which suits your need
Also If you want to change the Higher Timeframe in Days
just know
1D = 24*60 min, = 1140mins
Enjoy!
Cari dalam skrip untuk "豪24配债"

[ALERTS] MA Cross HildiIch habe nur einige Modifikationen vorgenommen, so dass es meinen Bedürfnissen gerecht wird. Das Skript dient lediglich dazu die gleiche Einstellungen auf mehreren Konten nutzen zu können. Allein die Farbe und die Symbole habe ich noch nicht Automatisiert übertragen.
mfg Hildi Channel

Ether (Ethereum) CME Gaps [NeoButane]Detects gaps in trading for CME's "Ether" cash-settled futures. This will show gaps as they happen on the 24/7 charts that crypto exchanges use. It is not usable on CME's tickers themselves, as gaps in trading are not displayed.
This indicator will only display if viewing an ETH chart.
More information on the CME ETH futures here:
www.cmegroup.com
Based on:
What's different: CME's BTC and ETH markets trade the same hours, but one may hit a limit breaker while there may be a case where the other does not.

Phoenix Ascending 2.201Hi Everyone!
It's time to make this indicator public to relieve myself of replying to requests for access. There has been an update to this indicator; in which a Stochastic RSI was added to this indicator. Please follow the directions to SETUP the indicator in the SETUP VIDEO provided below.
Phoenix Ascending 2.201 and Bollinger Bands Setup Video.
The following are BASIC rules for the Phoenix 2.201 Indicator. More advanced rules and the requirements for those rules can be found in my publications in my public profile. Unfortunately, I do not have organized videos created on how to use this indicator in full but will be available in the future.
IMPORTANT: The BASIC rules below are beneficial but these are NOT all the rules. More rules and requirements for those rules will be available in the future.
RULE NO. 1
We PREFER the Blue LSMA to be at 80% or higher for SAFE EXIT (SHORT) bets.
We PREFER the Blue LSMA to be at 20% or lower for SAFE ENTRY (LONG) bets.
Rule No. 2
ANY time the red line is approaching a green line that’s moving UPWARD,
Be prepared to make an ENTRY (LONG) when the red line is about to touch the green line that’s moving upward.
One can look at a lower time frame to get a better idea of how much longer you may have
To wait for the red line to touch the green line. In many cases, you may make ENTRY (LONG)
Just before the red line actually touches the green line that’s moving up in that higher time frame
You were initially using as your COMPASS. I currently have the 1-Month TF as a compass for EURUSD.
Rule No. 3
ANY time the red line is approaching a green line that’s moving DOWNWARD,
Be prepared to make an EXIT (SHORT) when the red line is about to touch the green line that’s moving downward.
One can look at a lower time frame to get a better idea of how much longer you may have
To wait for the red line to touch the green line. In many cases, you may make your EXIT (SHORT)
Just before the red line actually touches the green line that’s moving downward in that higher time frame
You were initially using as your COMPASS. I currently have the 1-Month TF as a compass for EURUSD.
Rule No. 4
The Green Line and/or Ghost Line can often help one determine when an upward or downward move in a particular time frame
Is nearly exhausted and about to reverse.
Example for Upside Exhaustion about to reverse to the Downside:
When the Green Line and/or Ghost line is at 80% level or higher, this is a good indicator to inform
Us the current upside move may be approaching exhaustion. You can look at a higher time frame to try to gain
More insight as to whether this will only be a brief dip down in the lower time frame IF the higher time frame you
Went to reveals there is a lot more room remaining for the Green and/or Ghost Lines to reach the 80% or higher level.
Example for Downside Exhaustion about to reverse to the Upside:
When the Green Line and/or Ghost line is at 20% level or lower, this is a good indicator to inform
Us the current downside move may be approaching exhaustion. You can look at a higher time frame to try to gain
More insight as to whether this will only be a brief dip up in the lower time frame IF the higher time frame you
Went to reveals there is a lot more room remaining for the Green and/or Ghost Lines to reach the 20% or lower level.
Rule No. 5
The same rules you see in Rule No. 4 also apply to the Stochastic RSI. Keep in mind I changed the colors of the
Stochastic RSI to the following: Red default changed to Purple and Blue changed changed to Black to avoid confusing
Them with the lines in Godmode.
When the Stochastic RSI is at 80% or higher level, we need to be on guard for a reversal to the downside.
When the Stochastic RSI is at 20% or lower level, we need to be on guard for a reversal to the upside.
EXTREMELY IMPORTANT to apply these rules in GROUPS OF TIME FRAMES.
"TYPES" OF TIME FRAME GROUP TRADING SIGNALS
Scalping Group Signals: Signals provided for this group involve analyzing the following two groups of time frames. Short Term Group as a compass and Scalping Group for confirmation and more precise entry/exit.
Scalping Group: 6min. 12min. 23min & 45min.
Short Term Group: 90min. 3hr. 6hr. & 12hr.
Short Term Group Signals: Signals provided for this group involve analyzing the following two groups of time frames. NearTerm Group as a compass and Short Term Group for confirmation and more precise entry/exit.
Short Term Group: 90min. 3hr. 6hr. & 12hr.
Near Term Group: 24hr. 2-Day, 3-Day & 4-Day
Near Term Group Signals: Signals provided for this group involve analyzing the following two groups of time frames. Mid Term Group as a compass and Near Term Group for confirmation and more precise entry/exit.
Near Term Group: 24hr. 2-Day, 3-Day & 4-Day
Mid Term Group: 3-Day, 6-Day, 9-Day & 12-Day
Mid Term Group Signals: Signals provided for this group involve analyzing the following two groups of time frames. Long Term Group as a compass and Mid Term Group for confirmation and more precise entry/exit.
Mid Term Group: 3-Day, 6-Day, 9-Day & 12-Day
Long Term Group: 1-Week, 2-Week, 3-Week & 4-Week
Long Term Group Signals: Signals provided for this group involve analyzing the following two groups of time frames. Macro Term Group as a compass and Long Term Group for confirmation and more precise entry/exit.
Long Term Group: 1-Week, 2-Week, 3-Week & 4-Week
Macro Term Group: 1-Month, 2-Month, 3-Month & 4-Month
Macro Term Group Signals: Signals provided for this group involve analyzing the following two groups of time frames. Macro Term Group as a compass and Long Term Group for confirmation and more precise entry/exit.
Macro Term Group: 1-Month, 2-Month, 3-Month & 4-Month
Super Macro Group: 3-Month , 6-Month, 12-Month & 24-Month

Realized Volatility (annualized for any time frame)Plots standard deviation of returns (realized volatility), and annualizes it for the selected timeframe. Suitable for forex/cryptocurrencies which trade 24/7.

VPoC per barThis study prints the current bar VPoC as an horizontal line.
It's aimed originally at BTCUSDT pair and 15m timeframe.
HOW IT WORKS
Zoom In mode: This is the default mode.
The study zooms in into the latest 15 1-minute bar candles in order to calculate the 15 minute candle VPoC.
Zoom Out mode: The VPoC from the last n bars from the current timeframe that match desired timeframe is shown on each bar.
In either case you are recommended to click on the '...' button associated to this study
and select 'Visual Order. Bring to Front.' so that it's properly shown in your chart.
HOW IT WORKS - Zoom In mode
Make sure that '(VP) Zoom into the VP timeframe' setting is set to true.
Choose the zoomed in timeframe where to calculate VPoC from thanks to the '(VP) Zoomed timeframe {1 minute}' setting.
Change '(VP) Zoomed in timeframe bars per current timeframe bar {15}' to its appropiated value. You just need to divide the current timeframe minutes per the zoomed in timeframe minutes per bar. E.g. If you are in 60 minute timeframe and you want to zoom in into 5 minute timeframe: 60 / 5 = 12 . You will write 12 here.
HOW IT WORKS - Zoom Out mode
Make sure that '(VP) Zoom into the VP timeframe' setting is set to false.
If you are using the Zoom out mode you might want to set '(VP) Print VPoC price as discrete lines {True}' to false.
Either choose the zoommed out timeframe where to calculate VPoC from thanks to the '(VP) Zoomed timeframe {1 minute}' setting or turn on the '(VP) Use number of bars (not VP timeframe)' setting in order to use '(VP) Number of bars {100}' as a custom number of bars.
WARNING - Zoom In mode last bar
The way that PineScript handles security function in last bar might result on the last bar not being accurate enough.
SETTINGS
__ SETTINGS - Volume Profile
(VP) Zoomed timeframe {1 minute}: Timeframe in which to zoom in or zoom out to calculate an accurate VPoC for the current timeframe.
(VP) Zoomed in timeframe bars per current timeframe bar {15}: Check 'HOW IT WORKS - Zoom In mode' above. Note : It is only used in 'Zoom in' mode.
(VP) Number of bars {100}: If 'Use number of bars (not VP timeframe)' is turned on this setting is used to calculate session VPoC. Note : It is only used in 'Zoom out' mode.
(VP) Price levels {24}: Price levels for calculating VPoC.
__ SETTINGS - MAIN TURN ON/OFF OPTIONS
(VP) Print VPoC price {True}: Show VPoC price
(VP) Zoom into the VP timeframe: When set to true the VPoC is calculated by zooming into the lower timeframe. When set to false a higher timeframe (or number of bars) is used.
(VP) Realtime Zoom in (Beta): Enable real time zoom for the last bar. It's beta because it would only work with zoomed in timeframe under 60 minutes. And when ratio between zoomout and zoomin is less than 60. Note : It is only used in 'Zoom in' mode.
(VP) Use number of bars (not VP timeframe): Uses 'Number of bars {100}' setting instead of 'Volume Profile timeframe' setting for calculating session VPoC. Note : It is only used in 'Zoom out' mode.
(VP) Print VPoC price as discrete lines {True}: When set to true the VPoC is shown as an small line in the center of each bar. When set to the false the VPoC line is printed as a normal line.
__ SETTINGS - EXTRA
(VP) VPoC color: Change the VPoC color
(VP) VPoC line width {1}: Change VPoC line width (in pixels).
(VP) Use number of bars (not VP timeframe): Uses 'Number of bars {100}' setting instead of 'Volume Profile timeframe' setting for calculating session VPoC. Note : It is only used in 'Zoom out' mode.
(VP) Print VPoC price as discrete lines {True}: When set to true the VPoC is shown as an small line in the center of each bar. When set to the false the VPoC line is printed as a normal line.
CREDITS
I have reused and adapted some code from
"Poor man's volume profile" study
which it's from TradingView IldarAkhmetgaleev user.

Voss Predictor (A Peek Into the Future) - Dr. John EhlersI have been sitting on this for over a year, but I now present this "Voss Predictive Filter" multicator employing PSv4.0 upon initial release, originally formulated by the great and empowering Dr. John Ehlers for TASC - August 2019 Traders Tips. This is a slightly modified version of the original indicator John Ehlers designed. My improved implementation is an all-in-one combination of three indicators, consisting of Ehlers' 2-pole bandpass filter, fed into the Voss predictor, and my Correlation Color. I also purposefully attempted to make this indicator work on both "Light" and "Dark" charts equally well.
You can search for this indicator's white paper, entitled "A PEEK INTO THE FUTURE By John Ehlers", on his site in the educational reference section. It's VERY important that you fully grasp how this indicator works and when it doesn't during trending price movements. According to "TV House Rules", I can't link directly to his white paper on his web site. Technically he's a vendor, even though it has been divulged to me, that he is intending to retire after his last and final wØℾk$#Øp, where he is publicly disseminating the bulk of his unpublished proprietary code that drives his other website VERY SOON.
I love John Ehlers in a respectfully appreciative manner and he is my hero in life! I simply don't revel about pretended celebrities and supposed rock stars. I will never be able to adequately explain to you how much he has influenced me AND this website as it currently exists AND what is in store for the future of the ever evolving "Power of Pine". His inspiring legacy of code poetry shall forever be immortally enshrined here on TV and influence it.
Back to the topic of interest, this script originating from John Ehlers' mind... This indicator helps to anticipate cyclic turning points via negative group delay. It is NOT a predictive crystal ball. Do not become cluelessly disillusioned by it's title. I need to explain.
For example, this indicator could not have anticipated that the bold faced lie of "15 Days to Slow the Spread" of the CHImeravirus "plandemic" in the USA, would turn into our factual reality of multi state mandated orders demanding months of unconstitutional prison cell styled lockdowns with closures and the absurd criminalization of not wearing a mouth mask made from underwear while not being evidently ill, additionally combined with 24/7 black magick mass hypnosis spoon feeding non-scientific fear based psychological propaganda from the world's "finest" epidemiological data analysts and misleaders, eventually decimating the world's markets into zombie economies with abhorrent results of long term massive unemployment and financial hardship on a chart scale never before witnessed. Yep, it's NOT capable of predetermining any of that. I just wanted to make that very clear by example in a metaphorical manner many people can relate to concerning Voss' ability to anticipate.
The indicator consists of a bandpass filter coupled to the Voss predictor. Also, one thing about the Voss predictor, it can catch minute turning points or even false ones as explained in the white paper. So... I included my Correlation Color as a fitting companion to aid you in filtering out false signals during trending price movements. The Voss Predictive Filter should never be used alone, be forewarned!
Features List Includes:
Dark Background - Easily disabled in indicator Settings->Style for "Light" charts or with Pine commenting
AND a few more... Why list them, when you have the source code to explore!
When available time provides itself, I will consider your inquiries, thoughts, and concepts presented below in the comments section, should you have any questions or comments regarding this indicator. When my indicators achieve more prevalent use by TV members , I may implement more ideas when they present themselves as worthy additions. Have a profitable future everyone!

Lagged Donchian Channel + EMAThis strategy is based on a lagged 24 periods Donchian Channel and a 200 periods EMA .
The enter positions are calculated this way :
Bull entry
1. we wait for the close of a candle below the channel and it must be below the 200 EMA
2. the following candle must be a green one and close in the lagged channel
3. we put a long order at the close of the second candle, a stop loss at the low of last 3 candles and a x3 take profit
Bear entry
1. we wait for the close of a candle above the channel and it must be above the 200 EMA
2. the following candle must be a red one and close in the lagged channel
3. we put a short order at the close of the second candle, a stop loss at the high of last 3 candles and a x3 take profit
For both long or short positions :
If the order is not filled, it's cancelled if the price reach 50% of the TP or if the price reach the stop loss level
The position is closed if a new bear/bull condition appears in the other side of the position (if a bear appears when you're long and inversement)
Features :
Position calculator's included with leverage option
Labels of position can be plotted or not
Bull/Bear channels can be plotted with red and green filled
All parameters can be changed for backtesting
Better results have been got with defaults parameters on LTCUSDTPERP in H1 timeframe => profit factor of 2.84 with almost 100 positions.
Hope this strategy will be useful and it would be cool if I could get feedback, comments or better combinations of parameters !!
Don't hesitate to like and leave a comment ;)
@Mysteriown

Vervoort SmoothingThis script has both the Triple Exponential Moving Average (TEMA) and zero lag sma written as functions. Both from Capturing Profit with Technical Analysis (24-25) by Sylvain Vervoort.
Best regards,
capam

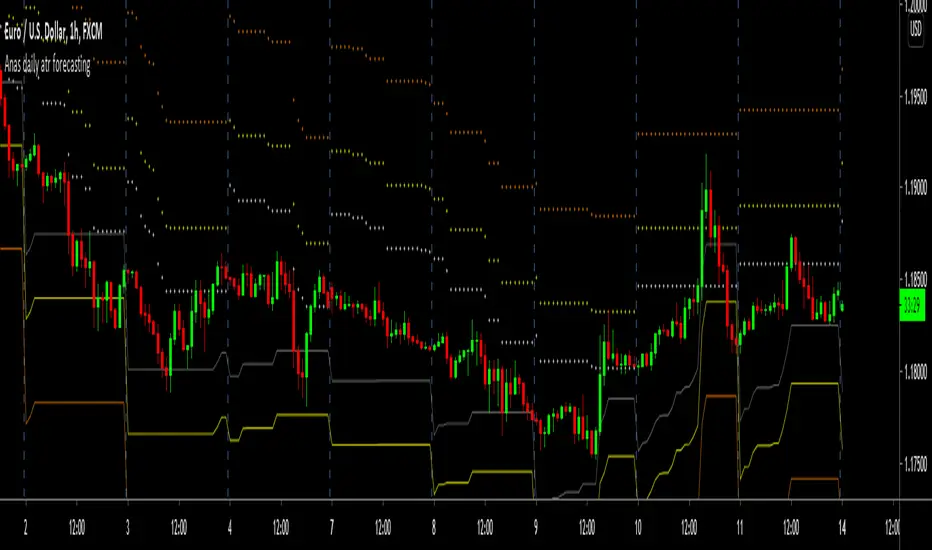
Anas daily atr forecastingthis indicator is used to forecast the coming day ATR by using hourly ATR and multiply by 24 hour then multiply with common Fibonacci retracement of 0.68 and 0.38 alternately
and it tracks the intraday price oscillation , so if first target reached its recommended for breakeven , 2nd target is the forecasted ATR and its recommended take profit for intraday
if there is a strong news and its expected to have strong movement last target is recommended .
Price breaksThis indicator displays the High/Low/Close of the previous day/week/month as horizontal lines. Of course, everything is configurable but to keep it simple and non-intrusive it only displays:
month's H/L/C levels on D time frame (drawn as circles)
week's levels on 4h (as crosses)
day's levels on 1h (as line)
These levels act as support / resistance over and over again, see current (08/24/2020) BTCUSD chart, the previous month's close (blue circles) did act as support and held on 08/11, also prev month's high (red circles) was not broken on 08/21. Once these levels break we might see lower prices but so far both of them act as good support to consider.

MA Streak Can Show When a Run Is Getting Long in the ToothMoving averages are one of the most common indicators in the world of technical analysis. And they’re often the ingredients of more complex indicators like MACD.
Today’s script shows how long prices have been moving in a given direction. Similar to our earlier Price Streak script, MA Streak counts the number of sessions that the average is rising or falling. It then plots the result in green (positive, rising) or red (negative, falling).
Because it uses a moving average instead of individual candles, this smooths out short-term noise to illustrate how long prices have been moving in a given direction.
Users can designate which price value (open, high, low, etc) to use under the Source input. They can also chose one of five moving average types. (See the code for a complete guide.)
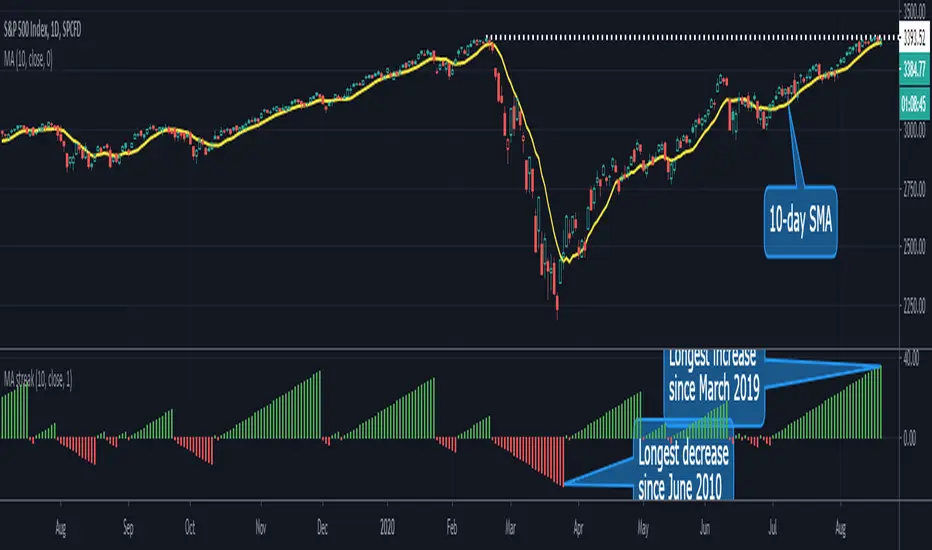
Today’s chart shows that the S&P 500’s 10-day simple moving average (SMA) has been rising for 36 sessions. It’s the longest upside run since March 2019. Given the fact that the index is flirting with its pre-Covid highs, MA Streak may suggest the current rally is getting long in the tooth.
It's also noteworthy that the coronavirus correction in February and March saw the 10-day SMA drop for 24 straight sessions, which was its longest decline since June 2010.
Weeknights Donchian CloudDonchian Channel Trading system visualised as a cloud.
Regular/Quick inputs;
Length: 20
Entry Length: 20
Stop Length: 10
Alternate/Slower Inputs;
Length: 55
Entry Length: 55
Stop Length: 20
For a more in-depth review, look up "Turtle Trading" rules
The simplest way to use the cloud;
-When the cloud flips from above to below (support), close any shorts and open a long
-When the cloud flips from below to above (resistance), close any longs and open a short
-Cloud is flipped based on a breakout on the high / low
-Most effectively used on the daily, but can be used on any time frame
-For traditional markets, an input of 20 is most commonly used
-For 24/7 markets, an input of 28 is most commonly used
-Find an input that makes the most sense to you!
I appreciate any feedback, feel free to message me on twitter / comment!
Twitter ; @ImWeeknight
Credit to user KivancOzbilgic for helping with the script
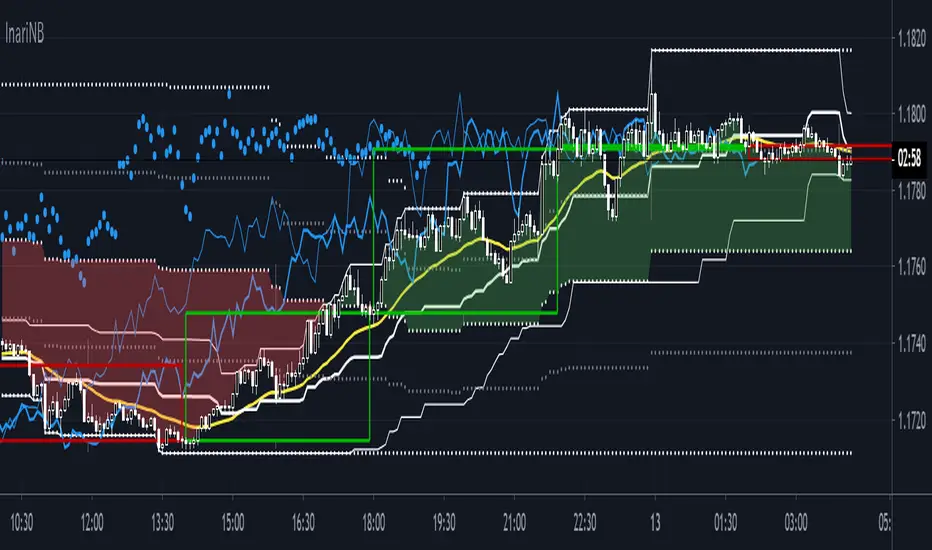
InariN BasicInariN is original work by N jijii.
I think InariN is modern interpretation of Ichimoku Cloud.
Please read script "InariN simple" for basic usage.
Multi time flame candles in this script is great work Candlestick Plot MTF by mortdiggiddy.
Supplementary explanation :
N jijii decided basic numbers as Ichimoku.
"I" first swing is 9. Only first swing is 9 because all numbers is consisted of nine numbers except start point 0 (his philosophy).
The second and subsequent is 8 because tangent point of previous swing is not counted (his philosophy).
"V" second swing is 9 + 8 = 17. "N" third swing is 9 + 8 + 8 = 25.
"N N = N2" is 25 +24 = 49. "N4" is 97. "N9"is 217.
He used basic numbers for parameters.
I think his idea is unique but the important point is this basic numbers are about popular numbers traders usually use and we can use as the same.
N2 and N9 spans is slightly difficult to use (Ichimoku lagging span).
Basically N span is used to measure Time Retracement and momentum.
If you want to practice Time Retracement , please check script "Ichimoku Time Retracement".
Enjoy!!
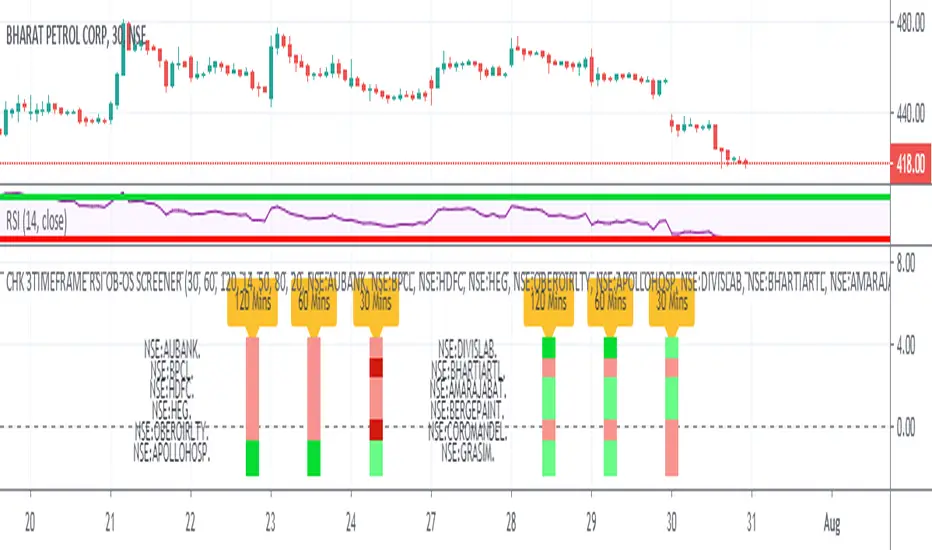
CHK 3TIMEFRAME RSI OB-OS SCREENER Sharing RSI Screener. It shows RSI Situation for 12 Stocks.
User can replace the stocks as per their respective exchange
User can select 3 Time Frames of his/her choice
User can change the OverBought / OverSold Values to 70/30. This indicator uses 80/20.
RSI BELOW 50 = PINK COLOR
OVERSOLD = MAROON COLOR
RSI ABOVE 50 = LIGHT GREEN COLOR
OVERBOUGHT = DARK GREEN COLOR
For Example : This Chart and the Indicator snapshot shows, the stock BPCL is Oversold for the 30 Min TimeFrame
For Example : The indicator snapshot shows, the stocks HDFC and AUBANK have their RSI's below 50 across the 30 Min / 60 Min / 120 Min
TimeFrames
Please give it some time to load, and every time you change Resolution.
Add another one, to have a screener screening 24 stocks :)
ICT Killzone For Crypto Markets.Adjusted for Crypto 24/7 markets
Adjusted for UTC
i have hidden the asian open range and daily bars on my charts , you can choose to have them on
Less screen clutter
London Open 8:00 - 4:30 - Killzone 7:00 - 9:00
NewYork Open 9:30 - 4:00 Killzone 8:00 - 10:00
Shanghai open 9:15 Killzone 8:00 - 10:00
NOT MY ORIGINAL SCRIPT. JUST MODIFIED VERSION

Ehlers Instantaneous Trendline V2 [CC]The Instantaneous Trendline was created by John Ehlers (Cybernetic Analysis For Stocks And Futures pg 24) and this is an updated version of his original Instantaneous Trendline that works much better in my opinion. Buy when the indicator line turns green and sell when it turns red.
Let me know what other scripts you would like to see me publish or if you want something custom done!

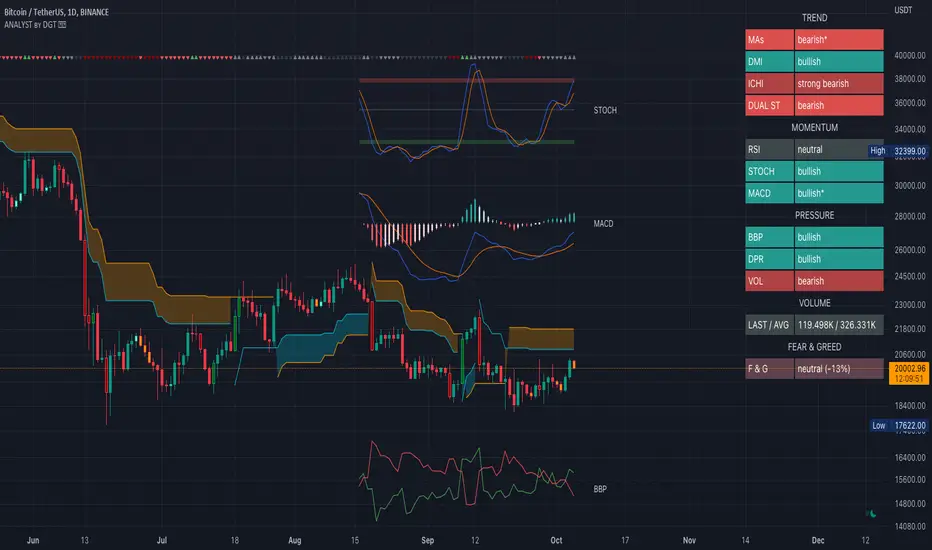
Technical Analyst by DGTWho needs a Technical Analyst?
yes I can hear someone is asking for, and here is one that can help you with technical analysis
The analyst will present a technical anlaysis report at a glance calculated by the most popular technical indicators , and the good part, the anlayst will do it voluntarily
technical skills of the analyst:
- experienced an all markets
- ability to interpret moving averages
- ability to interpret volume changes
- ability to interpret trend folowing indicators such as:
* directional movement index (dmi), identify trend strength and trend direction
* complex ichimoku cloud , identify trend stregth, and tk crosses
- ability to interpret oscillators such as:
* relative strength index, identify oversold overbought levels, identify the rsi flow
* commodity channel index, identify oversold overbought levels
* awesome identify if grawing or falling
* macd if bullish or bearish, and macd histogram if grawing or falling
- ability to calculate probability and its trend
- non-stop hardworker,
- available 7/24,
- highly dedicated always on duty,
- open for new ideas and willing to learn
- upon request the analyst will create reports with custom settings of your choise
the analyst is not a decition maker, trading success is all about following your trading strategy and the analyst aims to help with the presented reports calculated by the most popular technical indicators
the analyst supports 9 of the popular technical indicators and is willing to learn more , please share your comments and feedbacks and help the analyst improve skills
cheers!
Disclaimer : The script is for informational and educational purposes only. Use of the script does not constitutes professional and/or financial advice. You alone the sole responsibility of evaluating the script output and risks associated with the use of the script. In exchange for using the script, you agree not to hold dgtrd TradingView user liable for any possible claim for damages arising from any decision you make based on use of the script
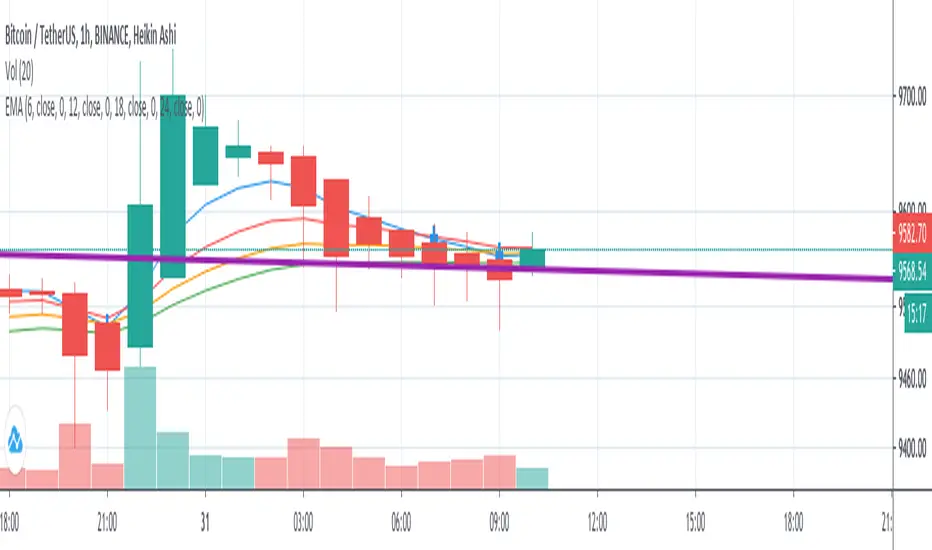
EMA 4 => 30Min & 1Hi use this script in 1h and 30min chart with this setting:
ema 6, ema 12, ema 18 & ema 24 and use adx and di, macd and cci indicator to get confirmation.
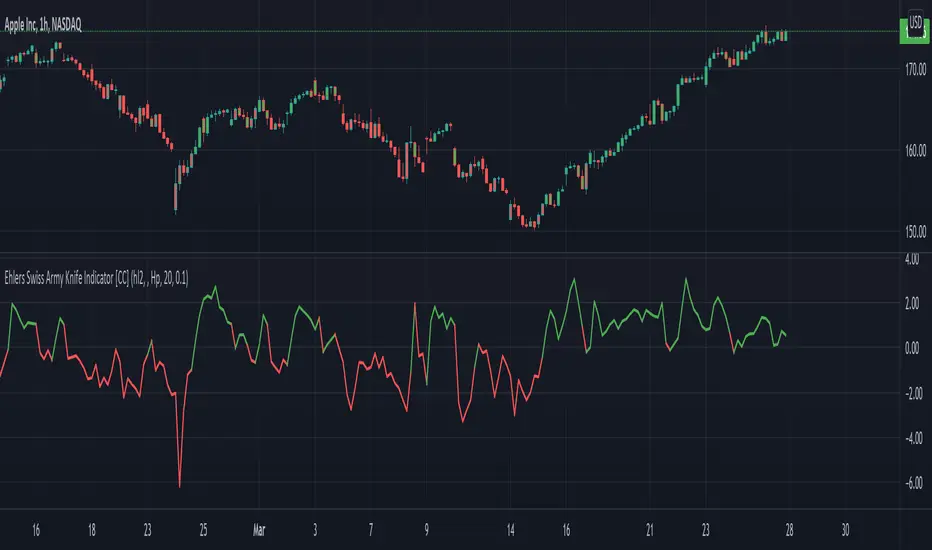
Ehlers Swiss Army Knife Indicator [CC]The Swiss Army Knife Indicator was created by John Ehlers (Stocks & Commodities V. 24:1 (28-31, 50-53)) and it is 9 different filters in one big mega indicator! This is my first attempt at allowing you all to select different timeframes, to choose if you allow repainting or not, or by letting you choose which indicator you want to see on the chart. I know this may cause problems so feel free to send me a pm if you are stuck or if you have any questions!
This was a custom request so please let me know if you want to see me publish any other scripts or if you want something custom done!
Note: I'm republishing this because the original script couldn't be found in searches so this will fix that.
Crypto Trading Hours UTC based on Berlin time (UTC +2)Although crypto markets trade 24/7, there are spikes in volume according to the general hours at which different parts of the world do the majority of their trading.
This Script highlights the US, European and Asian markets when they are most active. The normal market hours are always from 08:00 to 16:30 local time.
US market opens at 8:00 Silicon Valley local time, and closes at 16:30 New York local time.
European market opens at 8:00 London local time, and closes at 16:30 Frankfurt local time.
Asian market opens at 8:00 Hong Kong local time, and closes at 16:30 Sydney local time.

[FN] Session Range & Date Range For BacktestingThis has been done before in different ways, however, my goal is to publish a single, simplified copy/paste version of the idea so you can quickly and easily incorporate it into your strategy backtesting.
You can designate weekdays, weekdays + weekends for 24/7 markets, and also session range.
So, you trade bitcoin? It works. CME futures? It works. You are a discretionary trader so the only signals that matter are the ones that happen when you're awake? It works. Copy and paste.
The goal is that its that easy. You'll have to let me know if it is. glhf everyone.
If I'm not mistaken, you should be able to copy/paste this directly into your strategy script (Paste it in before your entry declarations). Just leave out the last 2 lines where the bgcolor() is declared... unless you want the background color lit up, that's up to you. It's just for demonstration purposes in this script.
After you've pasted it in, then in your strategy.entry() function you are adding: to the strategy.entry() function.
e.g:
strategy.entry("Long", strategy.long, qty=1, when = ENTRY_SIGNAL and signal_backtest())
Shoutouts to @zenandtheartoftrading and @allanster for providing the basis of this code that I put together here. We stand on the shoulders of giants.

Short Term Trade FiltersThis Panel consists of supporting filters to be used together with the "Short Term Trade Setups" panel.
These filters are described in the the book (Swedish):
"Boken om Gerillatrading" by Johan Hellström, Peter Nilsson, Johnny Torssell
The panel consists of three rows defined as:
Market Trend : 'green' if a positive Market Trend (choose the relevant to you!)
Turn Of the Month (TOM) : 'green' for the days between the 24:th and the 3:d of the month
Volatility : High-Volatility(yellow), Medium-Vol(orange), Low-Vol(red)
The filters, that can be used independently, will improve the result of the trade signal.
According to the book, 'High-Volatility' is the most important followed by 'TOM'
and then a positive 'Market Trend'.
NOTE: The Market Filter is a daily MA-365 of the relevant Stock Index, or a MA-200 of the price, choose accordingly!
