Infinite EMA with Alpha Control♾️ Infinite EMA with Alpha Control
What Makes This EMA "Infinite"?
Unlike traditional EMA indicators that are limited to typical periods (1-5000), this Infinite EMA breaks all boundaries. You can create EMAs with periods of 1,000, 10,000, or even 1,000,000 bars - that's why it's called "infinite"! Also Infinite EMA starts working immediately from the very first bar on your chart
Why This EMA is "Infinite":
1. Mathematically: When N → ∞, alpha → 0, meaning infinitely long "memory"
2. Practically: You can set any period - even 100,000 bars
3. Flexibility: Alpha allows precise control over the "forgetting speed"
How Does It Work?
The magic lies in the Alpha parameter. While regular EMAs use fixed formulas, this indicator gives you direct control over the EMA's "memory" through Alpha values:
• High Alpha (0.1-0.2): Fast reaction, short memory
• Medium Alpha (0.01-0.05): Balanced response
• Low Alpha (0.0001-0.001): Extremely slow reaction, very long memory
• Ultra-low Alpha (0.000001): Almost frozen in time
The Mathematical Formula:
Alpha = 2 / (Period + 1)
This means you can achieve any EMA period by adjusting Alpha, giving you infinite flexibility!
Expanded "Infinite EMA" Table:
Period EMA (N) - Alpha (Rounded) - Alpha (Exact) - Description
10 - 0.1818 - 0.181818... - Fast EMA
20 - 0.0952 - 0.095238... - Short-term
50 - 0.0392 - 0.039215... - Medium-term
100 - 0.0198 - 0.019801... - Long-term
200 - 0.0100 - 0.009950... - Standard long-term
500 - 0.0040 - 0.003996... - Very long-term
1,000 - 0.0020 - 0.001998... - Super long-term
2,000 - 0.0010 - 0.000999... - Ultra long-term
5,000 - 0.0004 - 0.000399... - Mega long-term
10,000 - 0.0002 - 0.000199... - Giga long-term
25,000 - 0.00008 - 0.000079... - Century-scale EMA
50,000 - 0.00004 - 0.000039... - Practically motionless
100,000 - 0.00002 - 0.000019... - "Glacial" EMA
500,000 - 0.000004 - 0.000003... - Geological timescale
1,000,000 - 0.000002 - 0.000001... - Approaching constant
5,000,000 - 0.0000004 - 0.0000003... - Virtually static
10,000,000 - 0.0000002 - 0.0000001... - Nearly flat line
100,000,000 - 0.00000002 - 0.00000001... - Mathematical infinity
Formula: Alpha = 2/(N+1) where N is the EMA period
Key Features:
Dual EMA System: Run fast and slow EMAs simultaneously
Crossover Signals: Automatic buy/sell signals with customizable alerts
Alpha Control: Direct mathematical control over EMA behavior
Infinite Periods: From 1 to 100,000,000+ bars
Visual Customization: Colors, fills, backgrounds, signal sizes
Instant Start: Works accurately from the very first bar
Update Intervals: Control calculation frequency for noise reduction
Why Choose Infinite EMA?
1. Unlimited Flexibility: Any period you can imagine
2. Mathematical Precision: Direct alpha control for exact behavior
3. Professional Grade: Suitable for all trading styles
4. Easy to Use: Simple settings with powerful results
5. No Warm-up Period: Accurate values from bar #1
Simple Explanation:
Think of EMA as a "memory system":
• High Alpha = Short memory (forgets quickly, reacts fast)
• Low Alpha = Long memory (remembers everything, moves slowly)
With Infinite EMA, you can set the "memory length" to anything from seconds to centuries!
⚡ Instant Start Feature - EMA from First Bar
Immediate Calculation from Bar #1
Unlike traditional EMA indicators that require a "warm-up period" of N bars before showing accurate values, Infinite EMA starts working immediately from the very first bar on your chart.
How It Works:
Traditional EMA Problem:
• Standard 200-period EMA: Needs 200+ bars to become accurate
• First 200 bars: Shows incorrect/unstable values
• Result: Large portions of historical data are unusable
Infinite EMA Solution:
Bar #1: EMA = Current Price (perfect starting point)
Bar #2: EMA = Alpha × Price + (1-Alpha) × Previous EMA
Bar #3: EMA = Alpha × Price + (1-Alpha) × Previous EMA
...and so on
Key Benefits:
No Warm-up Period: Start trading signals from day one
Full Chart Coverage: Every bar has a valid EMA value
Historical Accuracy: Backtesting works on entire dataset
New Markets: Works perfectly on newly listed assets
Short Datasets: Effective even with limited historical data
Practical Impact:
Scenario Traditional EMA Infinite EMA
New cryptocurrency Unusable for first 200 days ✅ Works from day 1
Limited data (< 200 bars) Inaccurate values ✅ Fully functional
Backtesting Must skip first 200 bars ✅ Test entire history
Real-time trading Wait for stabilization ✅ Trade immediately
Technical Implementation:
if barstate.isfirst
EMA := currentPrice // Perfect initialization
else
EMA := alpha × currentPrice + (1-alpha) × previousEMA
This smart initialization ensures mathematical accuracy from the very first calculation, eliminating the traditional EMA "ramp-up" problem.
Why This Matters:
For Backesters: Use 100% of available data
For Live Trading: Get signals immediately on any timeframe
For Researchers: Analyze complete datasets without gaps
Bottom Line: Infinite EMA is ready to work the moment you add it to your chart - no waiting, no warm-up, no exceptions!
Unlike traditional EMAs that require a "warm-up period" of 200+ bars before showing accurate values, Infinite EMA starts working immediately from bar #1.
This breakthrough eliminates the common problem where the first portion of your chart shows unreliable EMA data. Whether you're analyzing a newly listed cryptocurrency, working with limited historical data, or backtesting strategies, every single bar provides mathematically accurate EMA values.
No more waiting periods, no more unusable data sections - just instant, reliable trend analysis from the moment you apply the indicator to any chart.
🔄 Update Interval Bars Feature
The Update Interval feature allows you to control how frequently the EMA recalculates, providing flexible noise filtering without changing the core mathematics.
Set to 1 for standard behavior (updates every bar), or increase to 5-10 for smoother signals that update less frequently. Higher intervals reduce market noise and false signals but introduce slightly more lag. This is particularly useful on volatile timeframes where you want the EMA's directional bias without every minor price fluctuation affecting the calculation.
Perfect for swing traders who prefer cleaner, more stable trend lines over hyper-responsive indicators.
Conclusion
The Infinite EMA transforms the traditional EMA from a fixed-period tool into a precision instrument with unlimited flexibility. By understanding the Alpha-Period relationship, traders can create custom EMAs that perfectly match their trading style, timeframe, and market conditions.
The "infinite" nature comes from the ability to set any period imaginable - from ultra-fast 2-bar EMAs to glacially slow 10-million-bar EMAs, all controlled through a single Alpha parameter.
________________________________________
Whether you're a beginner looking for simple trend following or a professional researcher analyzing century-long patterns, Infinite EMA adapts to your needs. The power of infinite periods is now in your hands! 🚀
Go forward to the horizon. When you reach it, a new one will open up.
- J. P. Morgan
Cari dalam skrip untuk "量比大于10+外盘大于内盘+股票市场含义"

IU Indicators DashboardDESCRIPTION
The IU Indicators Dashboard is a comprehensive multi-stock monitoring tool that provides real-time technical analysis for up to 10 different stocks simultaneously. This powerful indicator creates a customizable table overlay that displays the trend status of multiple technical indicators across your selected stocks, giving you an instant overview of market conditions without switching between charts.
Perfect for portfolio monitoring, sector analysis, and quick market screening, this dashboard consolidates critical technical data into one easy-to-read interface with color-coded trend signals.
USER INPUTS
Stock Selection (10 Configurable Stocks):
- Stock 1-10: Customize any symbols (Default: NSE:CDSL, NSE:RELIANCE, NSE:VEDL, NSE:TCS, NSE:BEL, NSE:BHEL, NSE:TATAPOWER, NSE:TATASTEEL, NSE:ITC, NSE:LT)
Technical Indicator Parameters:
- EMA 1 Length: First Exponential Moving Average period (Default: 20)
- EMA 2 Length: Second Exponential Moving Average period (Default: 50)
- EMA 3 Length: Third Exponential Moving Average period (Default: 200)
- RSI Length: Relative Strength Index calculation period (Default: 14)
- SuperTrend Length: SuperTrend indicator period (Default: 10)
- SuperTrend Factor: SuperTrend multiplier factor (Default: 3.0)
Visual Customization:
- Table Size: Choose from Normal, Tiny, Small, or Large
- Table Background Color: Customize dashboard background
- Table Frame Color: Set frame border color
- Table Border Color: Configure border styling
- Text Color: Set text display color
- Bullish Color: Color for positive/bullish signals (Default: Green)
- Bearish Color: Color for negative/bearish signals (Default: Red)
LOGIC OF THE INDICATOR
The dashboard employs a multi-timeframe analysis approach using five key technical indicators:
1. Triple EMA Analysis
- Compares current price against three different EMA periods (20, 50, 200)
- Bullish Signal: Price above EMA level
- Bearish Signal: Price below EMA level
- Provides short-term, medium-term, and long-term trend perspective
2. RSI Momentum Analysis
- Uses 14-period RSI with 50-level threshold
- Bullish Signal: RSI > 50 (upward momentum)
- Bearish Signal: RSI < 50 (downward momentum)
- Identifies momentum strength and potential reversals
3. SuperTrend Direction
- Utilizes SuperTrend with configurable length and factor
- Bullish Signal: SuperTrend direction = -1 (uptrend)
- Bearish Signal: SuperTrend direction = 1 (downtrend)
- Provides clear trend direction with volatility-adjusted signals
4. MACD Histogram Analysis
- Uses standard MACD (12, 26, 9) histogram values
- Bullish Signal: Histogram > 0 (bullish momentum)
- Bearish Signal: Histogram < 0 (bearish momentum)
- Identifies momentum shifts and trend confirmations
5. Real-time Data Processing
- Implements request.security() for multi-symbol data retrieval
- Uses barstate.isrealtime logic for accurate live data
- Processes data only on the last bar for optimal performance
WHY IT IS UNIQUE
Multi-Stock Monitoring
- Monitor up to 10 different stocks simultaneously on a single chart
- No need to switch between multiple charts or timeframes
Highly Customizable Interface
- Full color customization for personalized visual experience
- Adjustable table size and positioning
- Clean, professional dashboard design
Real-time Analysis
- Live data processing with proper real-time handling
- Instant visual feedback through color-coded signals
- Optimized performance with smart data retrieval
Comprehensive Technical Coverage
- Combines trend-following, momentum, and volatility indicators
- Multiple timeframe perspective through different EMA periods
- Balanced approach using both lagging and leading indicators
Flexible Configuration
- Easy symbol switching for different markets (NSE, BSE, NYSE, NASDAQ)
- Adjustable indicator parameters for different trading styles
- Suitable for both swing trading and position trading
HOW USERS CAN BENEFIT FROM IT
Portfolio Management
- Quick Portfolio Health Check: Instantly assess the technical status of your entire stock portfolio
- Diversification Analysis: Monitor stocks across different sectors to ensure balanced exposure
- Risk Management: Identify which positions are showing bearish signals for potential exit strategies
- Rebalancing Decisions: Spot strongest performers for potential position increases
Market Screening and Analysis
- Sector Rotation: Compare different sector stocks to identify rotation opportunities
- Relative Strength Analysis: Quickly identify which stocks are outperforming or underperforming
- Market Breadth Assessment: Gauge overall market sentiment by monitoring diverse stock selections
- Trend Confirmation: Validate market trends by observing multiple stock behaviors
Time-Efficient Trading
- Single-Glance Analysis: Get complete technical overview without chart-hopping
- Pre-Market Preparation: Quickly assess overnight changes across multiple positions
- Intraday Monitoring: Track multiple opportunities simultaneously during trading hours
- End-of-Day Review: Efficiently review all watched stocks for next-day planning
Strategic Decision Making
- Entry Point Identification: Spot stocks showing bullish alignment across multiple indicators
- Exit Signal Recognition: Identify positions showing deteriorating technical conditions
- Swing Trading Opportunities: Find stocks with favorable technical setups for swing trades
- Long-term Investment Guidance: Use 200 EMA signals for long-term position decisions
Educational Benefits
- Pattern Recognition: Learn how different indicators behave across various market conditions
- Correlation Analysis: Understand how stocks move relative to each other
- Technical Analysis Learning: Observe multiple indicator interactions in real-time
- Market Sentiment Understanding: Develop better market timing skills through multi-stock observation
Workflow Optimization
- Reduced Chart Clutter: Keep your main chart clean while monitoring multiple stocks
- Faster Analysis: Complete technical analysis of 10 stocks in seconds instead of minutes
- Consistent Methodology: Apply the same technical criteria across all monitored stocks
- Alert Integration: Easy visual identification of stocks requiring immediate attention
This indicator is designed for traders and investors who want to maximize their market awareness while minimizing analysis time. Whether you're managing a portfolio, screening for opportunities, or learning technical analysis, the IU Indicators Dashboard provides the comprehensive overview you need for better trading decisions.
DISCLAIMER :
This indicator is not financial advice, it's for educational purposes only highlighting the power of coding( pine script) in TradingView, I am not a SEBI-registered advisor. Trading and investing involve risk, and you should consult with a qualified financial advisor before making any trading decisions. I do not guarantee profits or take responsibility for any losses you may incur.

Real 10Y Yield (DGS10 - T10YIE)The Real 10Y Yield (DGS10 – T10YIE) indicator computes the inflation-adjusted U.S. 10-year Treasury yield by subtracting the 10-year breakeven inflation rate (T10YIE) from the nominal 10-year Treasury yield (DGS10), both sourced directly from FRED. By filtering out inflation expectations, this script reveals the true, real borrowing cost over a 10-year horizon—one of the most reliable gauges of overall risk sentiment and capital–market health.
How It Works
Data Inputs
• DGS10 (Nominal 10-Year Treasury Yield)
• T10YIE (10-Year Breakeven Inflation Rate)
Both series are fetched on a daily timeframe via request.security from FRED.
Real Yield Calculation
pine
Copy
Edit
real10y = DGS10 – T10YIE
A positive value indicates that nominal yields exceed inflation expectations (real yields are positive), while a negative value signals deep-negative real rates.
Thresholds & Coloring
• Bullish Zone: Real yield < –0.1 %
• Bearish Zone: Real yield > +0.1 %
The background turns green when real yields drop below –0.1 %, reflecting an ultra-accommodative environment that historically aligns with risk-on rallies. It turns red when real yields exceed +0.1 %, indicating expensive real borrowing costs and a potential shift toward risk-off.
Alerts
• Deep-Negative Real Yields (Bullish): Triggers when real yield < –0.1 %
• High Real Yields (Bearish): Triggers when real yield > +0.1 %
Why It’s Powerful
Forward-Looking Sentiment Gauge
Real yields incorporate both market-implied inflation and nominal rates, making them a leading indicator for risk appetite, equity flows, and crypto demand.
Clear, Actionable Zones
The –0.1 % / +0.1 % thresholds cleanly delineate structurally bullish vs. bearish regimes, removing noise and false signals common in nominal-only yield studies.
Macro & Cross-Asset Confluence
Combine with equity indices, dollar strength (DXY), or credit spreads for a fully contextual macro view. When real yields break deeper negative alongside weakening dollar, it often precedes stretch in risk assets.
Automatic Alerts
Never miss regime shifts—alerts notify you the moment real yields breach key zones, so you can align your strategy with prevailing macro momentum.
How to Use
Add to a separate pane for unobstructed visibility.
Monitor breaks beneath –0.1 % for early “risk-on” signals in stocks, commodities, and crypto.
Watch for climbs above +0.1 % to hedge or rotate into defensive assets.
Combine with your existing trend-following or mean-reversion strategies to improve timing around major market turning points.
–––
Feel free to adjust the threshold lines to your preferred sensitivity (e.g., tighten to ±0.05 %), or overlay with moving averages to smooth out whipsaws. This script is ideal for macro traders, portfolio managers, and quantitative quants who demand a distilled, inflation-adjusted view of real rates.

Multi-Timeframe EMA Alignment + Listing InfoEnhanced EMA Alignment Checks
Original 4-EMA rows: Check 10EMA ≥ 20EMA ≥ 50EMA ≥ 200EMA for all timeframes
New 3-EMA rows: Check 10EMA ≥ 20EMA ≥ 50EMA (without 200EMA requirement) for weekly and monthly timeframes
Visual Distinction
White background: 4-EMA alignment rows (standard check)
Yellow background: 3-EMA alignment rows (less restrictive check)
Asterisk notation: "1W*" and "1M*" indicate the 3-EMA version
Complete Table Layout
1H: 4-EMA alignment (10≥20≥50≥200)
1D: 4-EMA alignment (10≥20≥50≥200)
1W: 4-EMA alignment (10≥20≥50≥200)
1M: 4-EMA alignment (10≥20≥50≥200)
1W* : 3-EMA alignment (10≥20≥50) - NEW
1M* : 3-EMA alignment (10≥20≥50) - NEW
Separator line
Since List: Weeks/months since listing
Benefits of This Setup:
Comprehensive Analysis: You can now see both strict (4-EMA) and relaxed (3-EMA) trend conditions
Better Entry Signals: The 3-EMA alignment might trigger earlier than 4-EMA, providing potential early entry signals
Trend Strength Assessment: When both 3-EMA and 4-EMA are aligned, it indicates very strong trend conditions
Flexible Strategy: You can use 3-EMA for trend following and 4-EMA for confirmation
The table now provides a complete multi-timeframe trend analysis with both conservative and aggressive alignment criteria, giving you more flexibility in your trading decisions.

KST Strategy [Skyrexio]Overview
KST Strategy leverages Know Sure Thing (KST) indicator in conjunction with the Williams Alligator and Moving average to obtain the high probability setups. KST is used for for having the high probability to enter in the direction of a current trend when momentum is rising, Alligator is used as a short term trend filter, while Moving average approximates the long term trend and allows trades only in its direction. Also strategy has the additional optional filter on Choppiness Index which does not allow trades if market is choppy, above the user-specified threshold. Strategy has the user specified take profit and stop-loss numbers, but multiplied by Average True Range (ATR) value on the moment when trade is open. The strategy opens only long trades.
Unique Features
ATR based stop-loss and take profit. Instead of fixed take profit and stop-loss percentage strategy utilizes user chosen numbers multiplied by ATR for its calculation.
Configurable Trading Periods. Users can tailor the strategy to specific market windows, adapting to different market conditions.
Optional Choppiness Index filter. Strategy allows to choose if it will use the filter trades with Choppiness Index and set up its threshold.
Methodology
The strategy opens long trade when the following price met the conditions:
Close price is above the Alligator's jaw line
Close price is above the filtering Moving average
KST line of Know Sure Thing indicator shall cross over its signal line (details in justification of methodology)
If the Choppiness Index filter is enabled its value shall be less than user defined threshold
When the long trade is executed algorithm defines the stop-loss level as the low minus user defined number, multiplied by ATR at the trade open candle. Also it defines take profit with close price plus user defined number, multiplied by ATR at the trade open candle. While trade is in progress, if high price on any candle above the calculated take profit level or low price is below the calculated stop loss level, trade is closed.
Strategy settings
In the inputs window user can setup the following strategy settings:
ATR Stop Loss (by default = 1.5, number of ATRs to calculate stop-loss level)
ATR Take Profit (by default = 3.5, number of ATRs to calculate take profit level)
Filter MA Type (by default = Least Squares MA, type of moving average which is used for filter MA)
Filter MA Length (by default = 200, length for filter MA calculation)
Enable Choppiness Index Filter (by default = true, setting to choose the optional filtering using Choppiness index)
Choppiness Index Threshold (by default = 50, Choppiness Index threshold, its value shall be below it to allow trades execution)
Choppiness Index Length (by default = 14, length used in Choppiness index calculation)
KST ROC Length #1 (by default = 10, value used in KST indicator calculation, more information in Justification of Methodology)
KST ROC Length #2 (by default = 15, value used in KST indicator calculation, more information in Justification of Methodology)
KST ROC Length #3 (by default = 20, value used in KST indicator calculation, more information in Justification of Methodology)
KST ROC Length #4 (by default = 30, value used in KST indicator calculation, more information in Justification of Methodology)
KST SMA Length #1 (by default = 10, value used in KST indicator calculation, more information in Justification of Methodology)
KST SMA Length #2 (by default = 10, value used in KST indicator calculation, more information in Justification of Methodology)
KST SMA Length #3 (by default = 10, value used in KST indicator calculation, more information in Justification of Methodology)
KST SMA Length #4 (by default = 15, value used in KST indicator calculation, more information in Justification of Methodology)
KST Signal Line Length (by default = 10, value used in KST indicator calculation, more information in Justification of Methodology)
User can choose the optimal parameters during backtesting on certain price chart.
Justification of Methodology
Before understanding why this particular combination of indicator has been chosen let's briefly explain what is KST, Williams Alligator, Moving Average, ATR and Choppiness Index.
The KST (Know Sure Thing) is a momentum oscillator developed by Martin Pring. It combines multiple Rate of Change (ROC) values, smoothed over different timeframes, to identify trend direction and momentum strength. First of all, what is ROC? ROC (Rate of Change) is a momentum indicator that measures the percentage change in price between the current price and the price a set number of periods ago.
ROC = 100 * (Current Price - Price N Periods Ago) / Price N Periods Ago
In our case N is the KST ROC Length inputs from settings, here we will calculate 4 different ROCs to obtain KST value:
KST = ROC1_smooth × 1 + ROC2_smooth × 2 + ROC3_smooth × 3 + ROC4_smooth × 4
ROC1 = ROC(close, KST ROC Length #1), smoothed by KST SMA Length #1,
ROC2 = ROC(close, KST ROC Length #2), smoothed by KST SMA Length #2,
ROC3 = ROC(close, KST ROC Length #3), smoothed by KST SMA Length #3,
ROC4 = ROC(close, KST ROC Length #4), smoothed by KST SMA Length #4
Also for this indicator the signal line is calculated:
Signal = SMA(KST, KST Signal Line Length)
When the KST line rises, it indicates increasing momentum and suggests that an upward trend may be developing. Conversely, when the KST line declines, it reflects weakening momentum and a potential downward trend. A crossover of the KST line above its signal line is considered a buy signal, while a crossover below the signal line is viewed as a sell signal. If the KST stays above zero, it indicates overall bullish momentum; if it remains below zero, it points to bearish momentum. The KST indicator smooths momentum across multiple timeframes, helping to reduce noise and provide clearer signals for medium- to long-term trends.
Next, let’s discuss the short-term trend filter, which combines the Williams Alligator and Williams Fractals. Williams Alligator
Developed by Bill Williams, the Alligator is a technical indicator that identifies trends and potential market reversals. It consists of three smoothed moving averages:
Jaw (Blue Line): The slowest of the three, based on a 13-period smoothed moving average shifted 8 bars ahead.
Teeth (Red Line): The medium-speed line, derived from an 8-period smoothed moving average shifted 5 bars forward.
Lips (Green Line): The fastest line, calculated using a 5-period smoothed moving average shifted 3 bars forward.
When the lines diverge and align in order, the "Alligator" is "awake," signaling a strong trend. When the lines overlap or intertwine, the "Alligator" is "asleep," indicating a range-bound or sideways market. This indicator helps traders determine when to enter or avoid trades.
The next indicator is Moving Average. It has a lot of different types which can be chosen to filter trades and the Least Squares MA is used by default settings. Let's briefly explain what is it.
The Least Squares Moving Average (LSMA) — also known as Linear Regression Moving Average — is a trend-following indicator that uses the least squares method to fit a straight line to the price data over a given period, then plots the value of that line at the most recent point. It draws the best-fitting straight line through the past N prices (using linear regression), and then takes the endpoint of that line as the value of the moving average for that bar. The LSMA aims to reduce lag and highlight the current trend more accurately than traditional moving averages like SMA or EMA.
Key Features:
It reacts faster to price changes than most moving averages.
It is smoother and less noisy than short-term EMAs.
It can be used to identify trend direction, momentum, and potential reversal points.
ATR (Average True Range) is a volatility indicator that measures how much an asset typically moves during a given period. It was introduced by J. Welles Wilder and is widely used to assess market volatility, not direction.
To calculate it first of all we need to get True Range (TR), this is the greatest value among:
High - Low
abs(High - Previous Close)
abs(Low - Previous Close)
ATR = MA(TR, n) , where n is number of periods for moving average, in our case equals 14.
ATR shows how much an asset moves on average per candle/bar. A higher ATR means more volatility; a lower ATR means a calmer market.
The Choppiness Index is a technical indicator that quantifies whether the market is trending or choppy (sideways). It doesn't indicate trend direction — only the strength or weakness of a trend. Higher Choppiness Index usually approximates the sideways market, while its low value tells us that there is a high probability of a trend.
Choppiness Index = 100 × log10(ΣATR(n) / (MaxHigh(n) - MinLow(n))) / log10(n)
where:
ΣATR(n) = sum of the Average True Range over n periods
MaxHigh(n) = highest high over n periods
MinLow(n) = lowest low over n periods
log10 = base-10 logarithm
Now let's understand how these indicators work in conjunction and why they were chosen for this strategy. KST indicator approximates current momentum, when it is rising and KST line crosses over the signal line there is high probability that short term trend is reversing to the upside and strategy allows to take part in this potential move. Alligator's jaw (blue) line is used as an approximation of a short term trend, taking trades only above it we want to avoid trading against trend to increase probability that long trade is going to be winning.
Almost the same for Moving Average, but it approximates the long term trend, this is just the additional filter. If we trade in the direction of the long term trend we increase probability that higher risk to reward trade will hit the take profit. Choppiness index is the optional filter, but if it turned on it is used for approximating if now market is in sideways or in trend. On the range bounded market the potential moves are restricted. We want to decrease probability opening trades in such condition avoiding trades if this index is above threshold value.
When trade is open script sets the stop loss and take profit targets. ATR approximates the current volatility, so we can make a decision when to exit a trade based on current market condition, it can increase the probability that strategy will avoid the excessive stop loss hits, but anyway user can setup how many ATRs to use as a stop loss and take profit target. As was said in the Methodology stop loss level is obtained by subtracting number of ATRs from trade opening candle low, while take profit by adding to this candle's close.
Backtest Results
Operating window: Date range of backtests is 2023.01.01 - 2025.05.01. It is chosen to let the strategy to close all opened positions.
Commission and Slippage: Includes a standard Binance commission of 0.1% and accounts for possible slippage over 5 ticks.
Initial capital: 10000 USDT
Percent of capital used in every trade: 60%
Maximum Single Position Loss: -5.53%
Maximum Single Profit: +8.35%
Net Profit: +5175.20 USDT (+51.75%)
Total Trades: 120 (56.67% win rate)
Profit Factor: 1.747
Maximum Accumulated Loss: 1039.89 USDT (-9.1%)
Average Profit per Trade: 43.13 USDT (+0.6%)
Average Trade Duration: 27 hours
These results are obtained with realistic parameters representing trading conditions observed at major exchanges such as Binance and with realistic trading portfolio usage parameters.
How to Use
Add the script to favorites for easy access.
Apply to the desired timeframe and chart (optimal performance observed on 1h BTC/USDT).
Configure settings using the dropdown choice list in the built-in menu.
Set up alerts to automate strategy positions through web hook with the text: {{strategy.order.alert_message}}
Disclaimer:
Educational and informational tool reflecting Skyrexio commitment to informed trading. Past performance does not guarantee future results. Test strategies in a simulated environment before live implementation.

Grothendieck-Teichmüller Geometric SynthesisDskyz's Grothendieck-Teichmüller Geometric Synthesis (GTGS)
THEORETICAL FOUNDATION: A SYMPHONY OF GEOMETRIES
The 🎓 GTGS is built upon a revolutionary premise: that market dynamics can be modeled as geometric and topological structures. While not a literal academic implementation—such a task would demand computational power far beyond current trading platforms—it leverages core ideas from advanced mathematical theories as powerful analogies and frameworks for its algorithms. Each component translates an abstract concept into a practical market calculation, distinguishing GTGS by identifying deeper structural patterns rather than relying on standard statistical measures.
1. Grothendieck-Teichmüller Theory: Deforming Market Structure
The Theory : Studies symmetries and deformations of geometric objects, focusing on the "absolute" structure of mathematical spaces.
Indicator Analogy : The calculate_grothendieck_field function models price action as a "deformation" from its immediate state. Using the nth root of price ratios (math.pow(price_ratio, 1.0/prime)), it measures market "shape" stretching or compression, revealing underlying tensions and potential shifts.
2. Topos Theory & Sheaf Cohomology: From Local to Global Patterns
The Theory : A framework for assembling local properties into a global picture, with cohomology measuring "obstructions" to consistency.
Indicator Analogy : The calculate_topos_coherence function uses sine waves (math.sin) to represent local price "sections." Summing these yields a "cohomology" value, quantifying price action consistency. High values indicate coherent trends; low values signal conflict and uncertainty.
3. Tropical Geometry: Simplifying Complexity
The Theory : Transforms complex multiplicative problems into simpler, additive, piecewise-linear ones using min(a, b) for addition and a + b for multiplication.
Indicator Analogy : The calculate_tropical_metric function applies tropical_add(a, b) => math.min(a, b) to identify the "lowest energy" state among recent price points, pinpointing critical support levels non-linearly.
4. Motivic Cohomology & Non-Commutative Geometry
The Theory : Studies deep arithmetic and quantum-like properties of geometric spaces.
Indicator Analogy : The motivic_rank and spectral_triple functions compute weighted sums of historical prices to capture market "arithmetic complexity" and "spectral signature." Higher values reflect structured, harmonic price movements.
5. Perfectoid Spaces & Homotopy Type Theory
The Theory : Abstract fields dealing with p-adic numbers and logical foundations of mathematics.
Indicator Analogy : The perfectoid_conv and type_coherence functions analyze price convergence and path identity, assessing the "fractal dust" of price differences and price path cohesion, adding fractal and logical analysis.
The Combination is Key : No single theory dominates. GTGS ’s Unified Field synthesizes all seven perspectives into a comprehensive score, ensuring signals reflect deep structural alignment across mathematical domains.
🎛️ INPUTS: CONFIGURING THE GEOMETRIC ENGINE
The GTGS offers a suite of customizable inputs, allowing traders to tailor its behavior to specific timeframes, market sectors, and trading styles. Below is a detailed breakdown of key input groups, their functionality, and optimization strategies, leveraging provided tooltips for precision.
Grothendieck-Teichmüller Theory Inputs
🧬 Deformation Depth (Absolute Galois) :
What It Is : Controls the depth of Galois group deformations analyzed in market structure.
How It Works : Measures price action deformations under automorphisms of the absolute Galois group, capturing market symmetries.
Optimization :
Higher Values (15-20) : Captures deeper symmetries, ideal for major trends in swing trading (4H-1D).
Lower Values (3-8) : Responsive to local deformations, suited for scalping (1-5min).
Timeframes :
Scalping (1-5min) : 3-6 for quick local shifts.
Day Trading (15min-1H) : 8-12 for balanced analysis.
Swing Trading (4H-1D) : 12-20 for deep structural trends.
Sectors :
Stocks : Use 8-12 for stable trends.
Crypto : 3-8 for volatile, short-term moves.
Forex : 12-15 for smooth, cyclical patterns.
Pro Tip : Increase in trending markets to filter noise; decrease in choppy markets for sensitivity.
🗼 Teichmüller Tower Height :
What It Is : Determines the height of the Teichmüller modular tower for hierarchical pattern detection.
How It Works : Builds modular levels to identify nested market patterns.
Optimization :
Higher Values (6-8) : Detects complex fractals, ideal for swing trading.
Lower Values (2-4) : Focuses on primary patterns, faster for scalping.
Timeframes :
Scalping : 2-3 for speed.
Day Trading : 4-5 for balanced patterns.
Swing Trading : 5-8 for deep fractals.
Sectors :
Indices : 5-8 for robust, long-term patterns.
Crypto : 2-4 for rapid shifts.
Commodities : 4-6 for cyclical trends.
Pro Tip : Higher towers reveal hidden fractals but may slow computation; adjust based on hardware.
🔢 Galois Prime Base :
What It Is : Sets the prime base for Galois field computations.
How It Works : Defines the field extension characteristic for market analysis.
Optimization :
Prime Characteristics :
2 : Binary markets (up/down).
3 : Ternary states (bull/bear/neutral).
5 : Pentagonal symmetry (Elliott waves).
7 : Heptagonal cycles (weekly patterns).
11,13,17,19 : Higher-order patterns.
Timeframes :
Scalping/Day Trading : 2 or 3 for simplicity.
Swing Trading : 5 or 7 for wave or cycle detection.
Sectors :
Forex : 5 for Elliott wave alignment.
Stocks : 7 for weekly cycle consistency.
Crypto : 3 for volatile state shifts.
Pro Tip : Use 7 for most markets; 5 for Elliott wave traders.
Topos Theory & Sheaf Cohomology Inputs
🏛️ Temporal Site Size :
What It Is : Defines the number of time points in the topological site.
How It Works : Sets the local neighborhood for sheaf computations, affecting cohomology smoothness.
Optimization :
Higher Values (30-50) : Smoother cohomology, better for trends in swing trading.
Lower Values (5-15) : Responsive, ideal for reversals in scalping.
Timeframes :
Scalping : 5-10 for quick responses.
Day Trading : 15-25 for balanced analysis.
Swing Trading : 25-50 for smooth trends.
Sectors :
Stocks : 25-35 for stable trends.
Crypto : 5-15 for volatility.
Forex : 20-30 for smooth cycles.
Pro Tip : Match site size to your average holding period in bars for optimal coherence.
📐 Sheaf Cohomology Degree :
What It Is : Sets the maximum degree of cohomology groups computed.
How It Works : Higher degrees capture complex topological obstructions.
Optimization :
Degree Meanings :
1 : Simple obstructions (basic support/resistance).
2 : Cohomological pairs (double tops/bottoms).
3 : Triple intersections (complex patterns).
4-5 : Higher-order structures (rare events).
Timeframes :
Scalping/Day Trading : 1-2 for simplicity.
Swing Trading : 3 for complex patterns.
Sectors :
Indices : 2-3 for robust patterns.
Crypto : 1-2 for rapid shifts.
Commodities : 3-4 for cyclical events.
Pro Tip : Degree 3 is optimal for most trading; higher degrees for research or rare event detection.
🌐 Grothendieck Topology :
What It Is : Chooses the Grothendieck topology for the site.
How It Works : Affects how local data integrates into global patterns.
Optimization :
Topology Characteristics :
Étale : Finest topology, captures local-global principles.
Nisnevich : A1-invariant, good for trends.
Zariski : Coarse but robust, filters noise.
Fpqc : Faithfully flat, highly sensitive.
Sectors :
Stocks : Zariski for stability.
Crypto : Étale for sensitivity.
Forex : Nisnevich for smooth trends.
Indices : Zariski for robustness.
Timeframes :
Scalping : Étale for precision.
Swing Trading : Nisnevich or Zariski for reliability.
Pro Tip : Start with Étale for precision; switch to Zariski in noisy markets.
Unified Field Configuration Inputs
⚛️ Field Coupling Constant :
What It Is : Sets the interaction strength between geometric components.
How It Works : Controls signal amplification in the unified field equation.
Optimization :
Higher Values (0.5-1.0) : Strong coupling, amplified signals for ranging markets.
Lower Values (0.001-0.1) : Subtle signals for trending markets.
Timeframes :
Scalping : 0.5-0.8 for quick, strong signals.
Swing Trading : 0.1-0.3 for trend confirmation.
Sectors :
Crypto : 0.5-1.0 for volatility.
Stocks : 0.1-0.3 for stability.
Forex : 0.3-0.5 for balance.
Pro Tip : Default 0.137 (fine structure constant) is a balanced starting point; adjust up in choppy markets.
📐 Geometric Weighting Scheme :
What It Is : Determines the framework for combining geometric components.
How It Works : Adjusts emphasis on different mathematical structures.
Optimization :
Scheme Characteristics :
Canonical : Equal weighting, balanced.
Derived : Emphasizes higher-order structures.
Motivic : Prioritizes arithmetic properties.
Spectral : Focuses on frequency domain.
Sectors :
Stocks : Canonical for balance.
Crypto : Spectral for volatility.
Forex : Derived for structured moves.
Indices : Motivic for arithmetic cycles.
Timeframes :
Day Trading : Canonical or Derived for flexibility.
Swing Trading : Motivic for long-term cycles.
Pro Tip : Start with Canonical; experiment with Spectral in volatile markets.
Dashboard and Visual Configuration Inputs
📋 Show Enhanced Dashboard, 📏 Size, 📍 Position :
What They Are : Control dashboard visibility, size, and placement.
How They Work : Display key metrics like Unified Field , Resonance , and Signal Quality .
Optimization :
Scalping : Small size, Bottom Right for minimal chart obstruction.
Swing Trading : Large size, Top Right for detailed analysis.
Sectors : Universal across markets; adjust size based on screen setup.
Pro Tip : Use Large for analysis, Small for live trading.
📐 Show Motivic Cohomology Bands, 🌊 Morphism Flow, 🔮 Future Projection, 🔷 Holographic Mesh, ⚛️ Spectral Flow :
What They Are : Toggle visual elements representing mathematical calculations.
How They Work : Provide intuitive representations of market dynamics.
Optimization :
Timeframes :
Scalping : Enable Morphism Flow and Spectral Flow for momentum.
Swing Trading : Enable all for comprehensive analysis.
Sectors :
Crypto : Emphasize Morphism Flow and Future Projection for volatility.
Stocks : Focus on Cohomology Bands for stable trends.
Pro Tip : Disable non-essential visuals in fast markets to reduce clutter.
🌫️ Field Transparency, 🔄 Web Recursion Depth, 🎨 Mesh Color Scheme :
What They Are : Adjust visual clarity, complexity, and color.
How They Work : Enhance interpretability of visual elements.
Optimization :
Transparency : 30-50 for balanced visibility; lower for analysis.
Recursion Depth : 6-8 for balanced detail; lower for older hardware.
Color Scheme :
Purple/Blue : Analytical focus.
Green/Orange : Trading momentum.
Pro Tip : Use Neon Purple for deep analysis; Neon Green for active trading.
⏱️ Minimum Bars Between Signals :
What It Is : Minimum number of bars required between consecutive signals.
How It Works : Prevents signal clustering by enforcing a cooldown period.
Optimization :
Higher Values (10-20) : Fewer signals, avoids whipsaws, suited for swing trading.
Lower Values (0-5) : More responsive, allows quick reversals, ideal for scalping.
Timeframes :
Scalping : 0-2 bars for rapid signals.
Day Trading : 3-5 bars for balance.
Swing Trading : 5-10 bars for stability.
Sectors :
Crypto : 0-3 for volatility.
Stocks : 5-10 for trend clarity.
Forex : 3-7 for cyclical moves.
Pro Tip : Increase in choppy markets to filter noise.
Hardcoded Parameters
Tropical, Motivic, Spectral, Perfectoid, Homotopy Inputs : Fixed to optimize performance but influence calculations (e.g., tropical_degree=4 for support levels, perfectoid_prime=5 for convergence).
Optimization : Experiment with codebase modifications if advanced customization is needed, but defaults are robust across markets.
🎨 ADVANCED VISUAL SYSTEM: TRADING IN A GEOMETRIC UNIVERSE
The GTTMTSF ’s visuals are direct representations of its mathematics, designed for intuitive and precise trading decisions.
Motivic Cohomology Bands :
What They Are : Dynamic bands ( H⁰ , H¹ , H² ) representing cohomological support/resistance.
Color & Meaning : Colors reflect energy levels ( H⁰ tightest, H² widest). Breaks into H¹ signal momentum; H² touches suggest reversals.
How to Trade : Use for stop-loss/profit-taking. Band bounces with Dashboard confirmation are high-probability setups.
Morphism Flow (Webbing) :
What It Is : White particle streams visualizing market momentum.
Interpretation : Dense flows indicate strong trends; sparse flows signal consolidation.
How to Trade : Follow dominant flow direction; new flows post-consolidation signal trend starts.
Future Projection Web (Fractal Grid) :
What It Is : Fibonacci-period fractal projections of support/resistance.
Color & Meaning : Three-layer lines (white shadow, glow, colored quantum) with labels showing price, topological class, anomaly strength (φ), resonance (ρ), and obstruction ( H¹ ). ⚡ marks extreme anomalies.
How to Trade : Target ⚡/● levels for entries/exits. High-anomaly levels with weakening Unified Field are reversal setups.
Holographic Mesh & Spectral Flow :
What They Are : Visuals of harmonic interference and spectral energy.
How to Trade : Bright mesh nodes or strong Spectral Flow warn of building pressure before price movement.
📊 THE GEOMETRIC DASHBOARD: YOUR MISSION CONTROL
The Dashboard translates complex mathematics into actionable intelligence.
Unified Field & Signals :
FIELD : Master value (-10 to +10), synthesizing all geometric components. Extreme readings (>5 or <-5) signal structural limits, often preceding reversals or continuations.
RESONANCE : Measures harmony between geometric field and price-volume momentum. Positive amplifies bullish moves; negative amplifies bearish moves.
SIGNAL QUALITY : Confidence meter rating alignment. Trade only STRONG or EXCEPTIONAL signals for high-probability setups.
Geometric Components :
What They Are : Breakdown of seven mathematical engines.
How to Use : Watch for convergence. A strong Unified Field is reliable when components (e.g., Grothendieck , Topos , Motivic ) align. Divergence warns of trend weakening.
Signal Performance :
What It Is : Tracks indicator signal performance.
How to Use : Assesses real-time performance to build confidence and understand system behavior.
🚀 DEVELOPMENT & UNIQUENESS: BEYOND CONVENTIONAL ANALYSIS
The GTTMTSF was developed to analyze markets as evolving geometric objects, not statistical time-series.
Why This Is Unlike Anything Else :
Theoretical Depth : Uses geometry and topology, identifying patterns invisible to statistical tools.
Holistic Synthesis : Integrates seven deep mathematical frameworks into a cohesive Unified Field .
Creative Implementation : Translates PhD-level mathematics into functional Pine Script , blending theory and practice.
Immersive Visualization : Transforms charts into dynamic geometric landscapes for intuitive market understanding.
The GTTMTSF is more than an indicator; it’s a new lens for viewing markets, for traders seeking deeper insight into hidden order within chaos.
" Where there is matter, there is geometry. " - Johannes Kepler
— Dskyz , Trade with insight. Trade with anticipation.

Langlands-Operadic Möbius Vortex (LOMV)Langlands-Operadic Möbius Vortex (LOMV)
Where Pure Mathematics Meets Market Reality
A Revolutionary Synthesis of Number Theory, Category Theory, and Market Dynamics
🎓 THEORETICAL FOUNDATION
The Langlands-Operadic Möbius Vortex represents a groundbreaking fusion of three profound mathematical frameworks that have never before been combined for market analysis:
The Langlands Program: Harmonic Analysis in Markets
Developed by Robert Langlands (Fields Medal recipient), the Langlands Program creates bridges between number theory, algebraic geometry, and harmonic analysis. In our indicator:
L-Function Implementation:
- Utilizes the Möbius function μ(n) for weighted price analysis
- Applies Riemann zeta function convergence principles
- Calculates quantum harmonic resonance between -2 and +2
- Measures deep mathematical patterns invisible to traditional analysis
The L-Function core calculation employs:
L_sum = Σ(return_val × μ(n) × n^(-s))
Where s is the critical strip parameter (0.5-2.5), controlling mathematical precision and signal smoothness.
Operadic Composition Theory: Multi-Strategy Democracy
Category theory and operads provide the mathematical framework for composing multiple trading strategies into a unified signal. This isn't simple averaging - it's mathematical composition using:
Strategy Composition Arity (2-5 strategies):
- Momentum analysis via RSI transformation
- Mean reversion through Bollinger Band mathematics
- Order Flow Polarity Index (revolutionary T3-smoothed volume analysis)
- Trend detection using Directional Movement
- Higher timeframe momentum confirmation
Agreement Threshold System: Democratic voting where strategies must reach consensus before signal generation. This prevents false signals during market uncertainty.
Möbius Function: Number Theory in Action
The Möbius function μ(n) forms the mathematical backbone:
- μ(n) = 1 if n is a square-free positive integer with even number of prime factors
- μ(n) = -1 if n is a square-free positive integer with odd number of prime factors
- μ(n) = 0 if n has a squared prime factor
This creates oscillating weights that reveal hidden market periodicities and harmonic structures.
🔧 COMPREHENSIVE INPUT SYSTEM
Langlands Program Parameters
Modular Level N (5-50, default 30):
Primary lookback for quantum harmonic analysis. Optimized by timeframe:
- Scalping (1-5min): 15-25
- Day Trading (15min-1H): 25-35
- Swing Trading (4H-1D): 35-50
- Asset-specific: Crypto 15-25, Stocks 30-40, Forex 35-45
L-Function Critical Strip (0.5-2.5, default 1.5):
Controls Riemann zeta convergence precision:
- Higher values: More stable, smoother signals
- Lower values: More reactive, catches quick moves
- High frequency: 0.8-1.2, Medium: 1.3-1.7, Low: 1.8-2.3
Frobenius Trace Period (5-50, default 21):
Galois representation lookback for price-volume correlation:
- Measures harmonic relationships in market flows
- Scalping: 8-15, Day Trading: 18-25, Swing: 25-40
HTF Multi-Scale Analysis:
Higher timeframe context prevents trading against major trends:
- Provides market bias and filters signals
- Improves win rates by 15-25% through trend alignment
Operadic Composition Parameters
Strategy Composition Arity (2-5, default 4):
Number of algorithms composed for final signal:
- Conservative: 4-5 strategies (higher confidence)
- Moderate: 3-4 strategies (balanced approach)
- Aggressive: 2-3 strategies (more frequent signals)
Category Agreement Threshold (2-5, default 3):
Democratic voting minimum for signal generation:
- Higher agreement: Fewer but higher quality signals
- Lower agreement: More signals, potential false positives
Swiss-Cheese Mixing (0.1-0.5, default 0.382):
Golden ratio φ⁻¹ based blending of trend factors:
- 0.382 is φ⁻¹, optimal for natural market fractals
- Higher values: Stronger trend following
- Lower values: More contrarian signals
OFPI Configuration:
- OFPI Length (5-30, default 14): Order Flow calculation period
- T3 Smoothing (3-10, default 5): Advanced exponential smoothing
- T3 Volume Factor (0.5-1.0, default 0.7): Smoothing aggressiveness control
Unified Scoring System
Component Weights (sum ≈ 1.0):
- L-Function Weight (0.1-0.5, default 0.3): Mathematical harmony emphasis
- Galois Rank Weight (0.1-0.5, default 0.2): Market structure complexity
- Operadic Weight (0.1-0.5, default 0.3): Multi-strategy consensus
- Correspondence Weight (0.1-0.5, default 0.2): Theory-practice alignment
Signal Threshold (0.5-10.0, default 5.0):
Quality filter producing:
- 8.0+: EXCEPTIONAL signals only
- 6.0-7.9: STRONG signals
- 4.0-5.9: MODERATE signals
- 2.0-3.9: WEAK signals
🎨 ADVANCED VISUAL SYSTEM
Multi-Dimensional Quantum Aura Bands
Five-layer resonance field showing market energy:
- Colors: Theme-matched gradients (Quantum purple, Holographic cyan, etc.)
- Expansion: Dynamic based on score intensity and volatility
- Function: Multi-timeframe support/resistance zones
Morphism Flow Portals
Category theory visualization showing market topology:
- Green/Cyan Portals: Bullish mathematical flow
- Red/Orange Portals: Bearish mathematical flow
- Size/Intensity: Proportional to signal strength
- Recursion Depth (1-8): Nested patterns for flow evolution
Fractal Grid System
Dynamic support/resistance with projected L-Scores:
- Multiple Timeframes: 10, 20, 30, 40, 50-period highs/lows
- Smart Spacing: Prevents level overlap using ATR-based minimum distance
- Projections: Estimated signal scores when price reaches levels
- Usage: Precise entry/exit timing with mathematical confirmation
Wick Pressure Analysis
Rejection level prediction using candle mathematics:
- Upper Wicks: Selling pressure zones (purple/red lines)
- Lower Wicks: Buying pressure zones (purple/green lines)
- Glow Intensity (1-8): Visual emphasis and line reach
- Application: Confluence with fractal grid creates high-probability zones
Regime Intensity Heatmap
Background coloring showing market energy:
- Black/Dark: Low activity, range-bound markets
- Purple Glow: Building momentum and trend development
- Bright Purple: High activity, strong directional moves
- Calculation: Combines trend, momentum, volatility, and score intensity
Six Professional Themes
- Quantum: Purple/violet for general trading and mathematical focus
- Holographic: Cyan/magenta optimized for cryptocurrency markets
- Crystalline: Blue/turquoise for conservative, stability-focused trading
- Plasma: Gold/magenta for high-energy volatility trading
- Cosmic Neon: Bright neon colors for maximum visibility and aggressive trading
📊 INSTITUTIONAL-GRADE DASHBOARD
Unified AI Score Section
- Total Score (-10 to +10): Primary decision metric
- >5: Strong bullish signals
- <-5: Strong bearish signals
- Quality ratings: EXCEPTIONAL > STRONG > MODERATE > WEAK
- Component Analysis: Individual L-Function, Galois, Operadic, and Correspondence contributions
Order Flow Analysis
Revolutionary OFPI integration:
- OFPI Value (-100% to +100%): Real buying vs selling pressure
- Visual Gauge: Horizontal bar chart showing flow intensity
- Momentum Status: SHIFTING, ACCELERATING, STRONG, MODERATE, or WEAK
- Trading Application: Flow shifts often precede major moves
Signal Performance Tracking
- Win Rate Monitoring: Real-time success percentage with emoji indicators
- Signal Count: Total signals generated for frequency analysis
- Current Position: LONG, SHORT, or NONE with P&L tracking
- Volatility Regime: HIGH, MEDIUM, or LOW classification
Market Structure Analysis
- Möbius Field Strength: Mathematical field oscillation intensity
- CHAOTIC: High complexity, use wider stops
- STRONG: Active field, normal position sizing
- MODERATE: Balanced conditions
- WEAK: Low activity, consider smaller positions
- HTF Trend: Higher timeframe bias (BULL/BEAR/NEUTRAL)
- Strategy Agreement: Multi-algorithm consensus level
Position Management
When in trades, displays:
- Entry Price: Original signal price
- Current P&L: Real-time percentage with risk level assessment
- Duration: Bars in trade for timing analysis
- Risk Level: HIGH/MEDIUM/LOW based on current exposure
🚀 SIGNAL GENERATION LOGIC
Balanced Long/Short Architecture
The indicator generates signals through multiple convergent pathways:
Long Entry Conditions:
- Score threshold breach with algorithmic agreement
- Strong bullish order flow (OFPI > 0.15) with positive composite signal
- Bullish pattern recognition with mathematical confirmation
- HTF trend alignment with momentum shifting
- Extreme bullish OFPI (>0.3) with any positive score
Short Entry Conditions:
- Score threshold breach with bearish agreement
- Strong bearish order flow (OFPI < -0.15) with negative composite signal
- Bearish pattern recognition with mathematical confirmation
- HTF trend alignment with momentum shifting
- Extreme bearish OFPI (<-0.3) with any negative score
Exit Logic:
- Score deterioration below continuation threshold
- Signal quality degradation
- Opposing order flow acceleration
- 10-bar minimum between signals prevents overtrading
⚙️ OPTIMIZATION GUIDELINES
Asset-Specific Settings
Cryptocurrency Trading:
- Modular Level: 15-25 (capture volatility)
- L-Function Precision: 0.8-1.3 (reactive to price swings)
- OFPI Length: 10-20 (fast correlation shifts)
- Cascade Levels: 5-7, Theme: Holographic
Stock Index Trading:
- Modular Level: 25-35 (balanced trending)
- L-Function Precision: 1.5-1.8 (stable patterns)
- OFPI Length: 14-20 (standard correlation)
- Cascade Levels: 4-5, Theme: Quantum
Forex Trading:
- Modular Level: 35-45 (smooth trends)
- L-Function Precision: 1.6-2.1 (high smoothing)
- OFPI Length: 18-25 (disable volume amplification)
- Cascade Levels: 3-4, Theme: Crystalline
Timeframe Optimization
Scalping (1-5 minute charts):
- Reduce all lookback parameters by 30-40%
- Increase L-Function precision for noise reduction
- Enable all visual elements for maximum information
- Use Small dashboard to save screen space
Day Trading (15 minute - 1 hour):
- Use default parameters as starting point
- Adjust based on market volatility
- Normal dashboard provides optimal information density
- Focus on OFPI momentum shifts for entries
Swing Trading (4 hour - Daily):
- Increase lookback parameters by 30-50%
- Higher L-Function precision for stability
- Large dashboard for comprehensive analysis
- Emphasize HTF trend alignment
🏆 ADVANCED TRADING STRATEGIES
The Mathematical Confluence Method
1. Wait for Fractal Grid level approach
2. Confirm with projected L-Score > threshold
3. Verify OFPI alignment with direction
4. Enter on portal signal with quality ≥ STRONG
5. Exit on score deterioration or opposing flow
The Regime Trading System
1. Monitor Aether Flow background intensity
2. Trade aggressively during bright purple periods
3. Reduce position size during dark periods
4. Use Möbius Field strength for stop placement
5. Align with HTF trend for maximum probability
The OFPI Momentum Strategy
1. Watch for momentum shifting detection
2. Confirm with accelerating flow in direction
3. Enter on immediate portal signal
4. Scale out at Fibonacci levels
5. Exit on flow deceleration or reversal
⚠️ RISK MANAGEMENT INTEGRATION
Mathematical Position Sizing
- Use Galois Rank for volatility-adjusted sizing
- Möbius Field strength determines stop width
- Fractal Dimension guides maximum exposure
- OFPI momentum affects entry timing
Signal Quality Filtering
- Trade only STRONG or EXCEPTIONAL quality signals
- Increase position size with higher agreement levels
- Reduce risk during CHAOTIC Möbius field periods
- Respect HTF trend alignment for directional bias
🔬 DEVELOPMENT JOURNEY
Creating the LOMV was an extraordinary mathematical undertaking that pushed the boundaries of what's possible in technical analysis. This indicator almost didn't happen. The theoretical complexity nearly proved insurmountable.
The Mathematical Challenge
Implementing the Langlands Program required deep research into:
- Number theory and the Möbius function
- Riemann zeta function convergence properties
- L-function analytical continuation
- Galois representations in finite fields
The mathematical literature spans decades of pure mathematics research, requiring translation from abstract theory to practical market application.
The Computational Complexity
Operadic composition theory demanded:
- Category theory implementation in Pine Script
- Multi-dimensional array management for strategy composition
- Real-time democratic voting algorithms
- Performance optimization for complex calculations
The Integration Breakthrough
Bringing together three disparate mathematical frameworks required:
- Novel approaches to signal weighting and combination
- Revolutionary Order Flow Polarity Index development
- Advanced T3 smoothing implementation
- Balanced signal generation preventing directional bias
Months of intensive research culminated in breakthrough moments when the mathematics finally aligned with market reality. The result is an indicator that reveals market structure invisible to conventional analysis while maintaining practical trading utility.
🎯 PRACTICAL IMPLEMENTATION
Getting Started
1. Apply indicator with default settings
2. Select appropriate theme for your markets
3. Observe dashboard metrics during different market conditions
4. Practice signal identification without trading
5. Gradually adjust parameters based on observations
Signal Confirmation Process
- Never trade on score alone - verify quality rating
- Confirm OFPI alignment with intended direction
- Check fractal grid level proximity for timing
- Ensure Möbius field strength supports position size
- Validate against HTF trend for bias confirmation
Performance Monitoring
- Track win rate in dashboard for strategy assessment
- Monitor component contributions for optimization
- Adjust threshold based on desired signal frequency
- Document performance across different market regimes
🌟 UNIQUE INNOVATIONS
1. First Integration of Langlands Program mathematics with practical trading
2. Revolutionary OFPI with T3 smoothing and momentum detection
3. Operadic Composition using category theory for signal democracy
4. Dynamic Fractal Grid with projected L-Score calculations
5. Multi-Dimensional Visualization through morphism flow portals
6. Regime-Adaptive Background showing market energy intensity
7. Balanced Signal Generation preventing directional bias
8. Professional Dashboard with institutional-grade metrics
📚 EDUCATIONAL VALUE
The LOMV serves as both a practical trading tool and an educational gateway to advanced mathematics. Traders gain exposure to:
- Pure mathematics applications in markets
- Category theory and operadic composition
- Number theory through Möbius function implementation
- Harmonic analysis via L-function calculations
- Advanced signal processing through T3 smoothing
⚖️ RESPONSIBLE USAGE
This indicator represents advanced mathematical research applied to market analysis. While the underlying mathematics are rigorously implemented, markets remain inherently unpredictable.
Key Principles:
- Use as part of comprehensive trading strategy
- Implement proper risk management at all times
- Backtest thoroughly before live implementation
- Understand that past performance does not guarantee future results
- Never risk more than you can afford to lose
The mathematics reveal deep market structure, but successful trading requires discipline, patience, and sound risk management beyond any indicator.
🔮 CONCLUSION
The Langlands-Operadic Möbius Vortex represents a quantum leap forward in technical analysis, bringing PhD-level pure mathematics to practical trading while maintaining visual elegance and usability.
From the harmonic analysis of the Langlands Program to the democratic composition of operadic theory, from the number-theoretic precision of the Möbius function to the revolutionary Order Flow Polarity Index, every component works in mathematical harmony to reveal the hidden order within market chaos.
This is more than an indicator - it's a mathematical lens that transforms how you see and understand market structure.
Trade with mathematical precision. Trade with the LOMV.
*"Mathematics is the language with which God has written the universe." - Galileo Galilei*
*In markets, as in nature, profound mathematical beauty underlies apparent chaos. The LOMV reveals this hidden order.*
— Dskyz, Trade with insight. Trade with anticipation.

DCA Investment Tracker Pro [tradeviZion]DCA Investment Tracker Pro: Educational DCA Analysis Tool
An educational indicator that helps analyze Dollar-Cost Averaging strategies by comparing actual performance with historical data calculations.
---
💡 Why I Created This Indicator
As someone who practices Dollar-Cost Averaging, I was frustrated with constantly switching between spreadsheets, calculators, and charts just to understand how my investments were really performing. I wanted to see everything in one place - my actual performance, what I should expect based on historical data, and most importantly, visualize where my strategy could take me over the long term .
What really motivated me was watching friends and family underestimate the incredible power of consistent investing. When Napoleon Bonaparte first learned about compound interest, he reportedly exclaimed "I wonder it has not swallowed the world" - and he was right! Yet most people can't visualize how their $500 monthly contributions today could become substantial wealth decades later.
Traditional DCA tracking tools exist, but they share similar limitations:
Require manual data entry and complex spreadsheets
Use fixed assumptions that don't reflect real market behavior
Can't show future projections overlaid on actual price charts
Lose the visual context of what's happening in the market
Make compound growth feel abstract rather than tangible
I wanted to create something different - a tool that automatically analyzes real market history, detects volatility periods, and shows you both current performance AND educational projections based on historical patterns right on your TradingView charts. As Warren Buffett said: "Someone's sitting in the shade today because someone planted a tree a long time ago." This tool helps you visualize your financial tree growing over time.
This isn't just another calculator - it's a visualization tool that makes the magic of compound growth impossible to ignore.
---
🎯 What This Indicator Does
This educational indicator provides DCA analysis tools. Users can input investment scenarios to study:
Theoretical Performance: Educational calculations based on historical return data
Comparative Analysis: Study differences between actual and theoretical scenarios
Historical Projections: Theoretical projections for educational analysis (not predictions)
Performance Metrics: CAGR, ROI, and other analytical metrics for study
Historical Analysis: Calculates historical return data for reference purposes
---
🚀 Key Features
Volatility-Adjusted Historical Return Calculation
Analyzes 3-20 years of actual price data for any symbol
Automatically detects high-volatility stocks (meme stocks, growth stocks)
Uses median returns for volatile stocks, standard CAGR for stable stocks
Provides conservative estimates when extreme outlier years are detected
Smart fallback to manual percentages when data insufficient
Customizable Performance Dashboard
Educational DCA performance analysis with compound growth calculations
Customizable table sizing (Tiny to Huge text options)
9 positioning options (Top/Middle/Bottom + Left/Center/Right)
Theme-adaptive colors (automatically adjusts to dark/light mode)
Multiple display layout options
Future Projection System
Visual future growth projections
Timeframe-aware calculations (Daily/Weekly/Monthly charts)
1-30 year projection options
Shows projected portfolio value and total investment amounts
Investment Insights
Performance vs benchmark comparison
ROI from initial investment tracking
Monthly average return analysis
Investment milestone alerts (25%, 50%, 100% gains)
Contribution tracking and next milestone indicators
---
📊 Step-by-Step Setup Guide
1. Investment Settings 💰
Initial Investment: Enter your starting lump sum (e.g., $60,000)
Monthly Contribution: Set your regular DCA amount (e.g., $500/month)
Return Calculation: Choose "Auto (Stock History)" for real data or "Manual" for fixed %
Historical Period: Select 3-20 years for auto calculations (default: 10 years)
Start Year: When you began investing (e.g., 2020)
Current Portfolio Value: Your actual portfolio worth today (e.g., $150,000)
2. Display Settings 📊
Table Sizes: Choose from Tiny, Small, Normal, Large, or Huge
Table Positions: 9 options - Top/Middle/Bottom + Left/Center/Right
Visibility Toggles: Show/hide Main Table and Stats Table independently
3. Future Projection 🔮
Enable Projections: Toggle on to see future growth visualization
Projection Years: Set 1-30 years ahead for analysis
Live Example - NASDAQ:META Analysis:
Settings shown: $60K initial + $500/month + Auto calculation + 10-year history + 2020 start + $150K current value
---
🔬 Pine Script Code Examples
Core DCA Calculations:
// Calculate total invested over time
months_elapsed = (year - start_year) * 12 + month - 1
total_invested = initial_investment + (monthly_contribution * months_elapsed)
// Compound growth formula for initial investment
theoretical_initial_growth = initial_investment * math.pow(1 + annual_return, years_elapsed)
// Future Value of Annuity for monthly contributions
monthly_rate = annual_return / 12
fv_contributions = monthly_contribution * ((math.pow(1 + monthly_rate, months_elapsed) - 1) / monthly_rate)
// Total expected value
theoretical_total = theoretical_initial_growth + fv_contributions
Volatility Detection Logic:
// Detect extreme years for volatility adjustment
extreme_years = 0
for i = 1 to historical_years
yearly_return = ((price_current / price_i_years_ago) - 1) * 100
if yearly_return > 100 or yearly_return < -50
extreme_years += 1
// Use median approach for high volatility stocks
high_volatility = (extreme_years / historical_years) > 0.2
calculated_return = high_volatility ? median_of_returns : standard_cagr
Performance Metrics:
// Calculate key performance indicators
absolute_gain = actual_value - total_invested
total_return_pct = (absolute_gain / total_invested) * 100
roi_initial = ((actual_value - initial_investment) / initial_investment) * 100
cagr = (math.pow(actual_value / initial_investment, 1 / years_elapsed) - 1) * 100
---
📊 Real-World Examples
See the indicator in action across different investment types:
Stable Index Investments:
AMEX:SPY (SPDR S&P 500) - Shows steady compound growth with standard CAGR calculations
Classic DCA success story: $60K initial + $500/month starting 2020. The indicator shows SPY's historical 10%+ returns, demonstrating how consistent broad market investing builds wealth over time. Notice the smooth theoretical growth line vs actual performance tracking.
MIL:VUAA (Vanguard S&P 500 UCITS) - Shows both data limitation and solution approaches
Data limitation example: VUAA shows "Manual (Auto Failed)" and "No Data" when default 10-year historical setting exceeds available data. The indicator gracefully falls back to manual percentage input while maintaining all DCA calculations and projections.
MIL:VUAA (Vanguard S&P 500 UCITS) - European ETF with successful 5-year auto calculation
Solution demonstration: By adjusting historical period to 5 years (matching available data), VUAA auto calculation works perfectly. Shows how users can optimize settings for newer assets. European market exposure with EUR denomination, demonstrating DCA effectiveness across different markets and currencies.
NYSE:BRK.B (Berkshire Hathaway) - Quality value investment with Warren Buffett's proven track record
Value investing approach: Berkshire Hathaway's legendary performance through DCA lens. The indicator demonstrates how quality companies compound wealth over decades. Lower volatility than tech stocks = standard CAGR calculations used.
High-Volatility Growth Stocks:
NASDAQ:NVDA (NVIDIA Corporation) - Demonstrates volatility-adjusted calculations for extreme price swings
High-volatility example: NVIDIA's explosive AI boom creates extreme years that trigger volatility detection. The indicator automatically switches to "Median (High Vol): 50%" calculations for conservative projections, protecting against unrealistic future estimates based on outlier performance periods.
NASDAQ:TSLA (Tesla) - Shows how 10-year analysis can stabilize volatile tech stocks
Stable long-term growth: Despite Tesla's reputation for volatility, the 10-year historical analysis (34.8% CAGR) shows consistent enough performance that volatility detection doesn't trigger. Demonstrates how longer timeframes can smooth out extreme periods for more reliable projections.
NASDAQ:META (Meta Platforms) - Shows stable tech stock analysis using standard CAGR calculations
Tech stock with stable growth: Despite being a tech stock and experiencing the 2022 crash, META's 10-year history shows consistent enough performance (23.98% CAGR) that volatility detection doesn't trigger. The indicator uses standard CAGR calculations, demonstrating how not all tech stocks require conservative median adjustments.
Notice how the indicator automatically detects high-volatility periods and switches to median-based calculations for more conservative projections, while stable investments use standard CAGR methods.
---
📈 Performance Metrics Explained
Current Portfolio Value: Your actual investment worth today
Expected Value: What you should have based on historical returns (Auto) or your target return (Manual)
Total Invested: Your actual money invested (initial + all monthly contributions)
Total Gains/Loss: Absolute dollar difference between current value and total invested
Total Return %: Percentage gain/loss on your total invested amount
ROI from Initial Investment: How your starting lump sum has performed
CAGR: Compound Annual Growth Rate of your initial investment (Note: This shows initial investment performance, not full DCA strategy)
vs Benchmark: How you're performing compared to the expected returns
---
⚠️ Important Notes & Limitations
Data Requirements: Auto mode requires sufficient historical data (minimum 3 years recommended)
CAGR Limitation: CAGR calculation is based on initial investment growth only, not the complete DCA strategy
Projection Accuracy: Future projections are theoretical and based on historical returns - actual results may vary
Timeframe Support: Works ONLY on Daily (1D), Weekly (1W), and Monthly (1M) charts - no other timeframes supported
Update Frequency: Update "Current Portfolio Value" regularly for accurate tracking
---
📚 Educational Use & Disclaimer
This analysis tool can be applied to various stock and ETF charts for educational study of DCA mathematical concepts and historical performance patterns.
Study Examples: Can be used with symbols like AMEX:SPY , NASDAQ:QQQ , AMEX:VTI , NASDAQ:AAPL , NASDAQ:MSFT , NASDAQ:GOOGL , NASDAQ:AMZN , NASDAQ:TSLA , NASDAQ:NVDA for learning purposes.
EDUCATIONAL DISCLAIMER: This indicator is a study tool for analyzing Dollar-Cost Averaging strategies. It does not provide investment advice, trading signals, or guarantees. All calculations are theoretical examples for educational purposes only. Past performance does not predict future results. Users should conduct their own research and consult qualified financial professionals before making any investment decisions.
---
© 2025 TradeVizion. All rights reserved.

AWR R & LR Oscillator with plots & tableHello trading viewers !
I'm glad to share with you one of my favorite indicator. It's the aggregate of many things. It is partly based on an indicator designed by gentleman goat. Many thanks to him.
1. Oscillator and Correlation Calculations
Overview and Functionality: This part of the indicator computes up to 10 Pearson correlation coefficients between a chosen source (typically the close price, though this is user-configurable) and the bar index over various periods. Starting with an initial period defined by the startPeriod parameter and increasing by a set increment (periodIncrement), each correlation coefficient is calculated using the built-in ta.correlation function over successive ranges. These coefficients are stored in an array, and the indicator calculates their average (avgPR) to provide a complete view of the market trend strength.
Display Features: Each individual coefficient, as well as the overall average, is plotted on the chart using a specific color. Horizontal lines (both dashed and solid) are drawn at levels 0, ±0.8, and ±1, serving as visual thresholds. Additionally, conditional fills in red or blue highlight when values exceed these thresholds, helping the user quickly identify potential extreme conditions (such as overbought or oversold situations).
2. Visual Signals and Automated Alerts
Graphical Signal Enhancements: To reinforce the analysis, the indicator uses graphical elements like emojis and shape markers. For example:
If all 10 curves drop below -0.79, a 🌋 emoji appears at the bottom of the chart;
When curves 2 through 10 are below -0.79, a ⛰️ emoji is displayed below the bar, potentially serving as a buy signal accompanied by an alert condition;
Likewise, symmetrical conditions for correlations exceeding 0.79 produce corresponding emojis (🤿 and 🏖️) at the top or bottom of the chart.
Alerts and Notifications: Using these visual triggers, several alertcondition statements are defined within the script. This allows users to set up TradingView alerts and receive real-time notifications whenever the market reaches these predefined critical zones identified by the multi-period analysis.
3. Regression Channel Analysis
Principles and Calculations: In addition to the oscillator, the indicator implements an analysis of regression channels. For each of the 8 configurable channels, the user can set a range of periods (for example, min1 to max1, etc.). The function calc_regression_channel iterates through the defined period range to find the optimal period that maximizes a statistical measure derived from a regression parameter calculated by the function r(p). Once this optimal period is identified, the indicator computes two key points (A and B) which define the main regression line, and then creates a channel based on the calculated deviation (an RMSE multiplied by a user-defined factor).
The regression channels are not displayed on the chart but are used to plot shapes & fullfilled a table.
Blue shapes are plotted when 6th channel or 7th channel are lower than 3 deviations
Yellow shapes are plotted when 6th channel or 7th channel are higher than 3 deviations
4. Scores, Conditions, and the Summary Table
Scoring System: The indicator goes further by assigning scores across multiple analytical categories, such as:
1. BigPear Score
What It Represents: This score is based on a longer-term moving average of the Pearson correlation values (SMA 100 of the average of the 10 curves of correlation of Pearson). The BigPear category is designed to capture where this longer-term average falls within specific ranges.
Conditions: The script defines nine boolean conditions (labeled BigPear1up through BigPear9up for the “up” direction).
Here's the rules :
BigPear1up = (bigsma_avgPR <= 0.5 and bigsma_avgPR > 0.25)
BigPear2up = (bigsma_avgPR <= 0.25 and bigsma_avgPR > 0)
BigPear3up = (bigsma_avgPR <= 0 and bigsma_avgPR > -0.25)
BigPear4up = (bigsma_avgPR <= -0.25 and bigsma_avgPR > -0.5)
BigPear5up = (bigsma_avgPR <= -0.5 and bigsma_avgPR > -0.65)
BigPear6up = (bigsma_avgPR <= -0.65 and bigsma_avgPR > -0.7)
BigPear7up = (bigsma_avgPR <= -0.7 and bigsma_avgPR > -0.75)
BigPear8up = (bigsma_avgPR <= -0.75 and bigsma_avgPR > -0.8)
BigPear9up = (bigsma_avgPR <= -0.8)
Conditions: The script defines nine boolean conditions (labeled BigPear1down through BigPear9down for the “down” direction).
BigPear1down = (bigsma_avgPR >= -0.5 and bigsma_avgPR < -0.25)
BigPear2down = (bigsma_avgPR >= -0.25 and bigsma_avgPR < 0)
BigPear3down = (bigsma_avgPR >= 0 and bigsma_avgPR < 0.25)
BigPear4down = (bigsma_avgPR >= 0.25 and bigsma_avgPR < 0.5)
BigPear5down = (bigsma_avgPR >= 0.5 and bigsma_avgPR < 0.65)
BigPear6down = (bigsma_avgPR >= 0.65 and bigsma_avgPR < 0.7)
BigPear7down = (bigsma_avgPR >= 0.7 and bigsma_avgPR < 0.75)
BigPear8down = (bigsma_avgPR >= 0.75 and bigsma_avgPR < 0.8)
BigPear9down = (bigsma_avgPR >= 0.8)
Weighting:
If BigPear1up is true, 1 point is added; if BigPear2up is true, 2 points are added; and so on up to 9 points from BigPear9up.
Total Score:
The positive score (posScoreBigPear) is the sum of these weighted conditions.
Similarly, there is a negative score (negScoreBigPear) that is calculated using a mirrored set of conditions (named BigPear1down to BigPear9down), each contributing a negative weight (from -1 to -9).
In essence, the BigPear score tells you—in a weighted cumulative way—where the longer-term correlation average falls relative to predefined thresholds.
2. Pear Score
What It Represents: This category uses the immediate average of the Pearson correlations (avgPR) rather than a longer-term smoothed version. It reflects a more current picture of the market’s correlation behavior.
How It’s Calculated:
Conditions: There are nine conditions defined for the “up” scenario (named Pear1up through Pear9up), which partition the range of avgPR into intervals. For instance:
Pear1up = (avgPR > -0.2 and avgPR <= 0)
Pear2up = (avgPR > -0.4 and avgPR <= -0.2)
Pear3up = (avgPR > -0.5 and avgPR <= -0.4)
Pear4up = (avgPR > -0.6 and avgPR <= -0.5)
Pear5up = (avgPR > -0.65 and avgPR <= -0.6)
Pear6up = (avgPR > -0.7 and avgPR <= -0.65)
Pear7up = (avgPR > -0.75 and avgPR <= -0.7)
Pear8up = (avgPR > -0.8 and avgPR <= -0.75)
Pear9up = (avgPR > -1 and avgPR <= -0.8)
There are nine conditions defined for the “down” scenario (named Pear1down through Pear9down), which partition the range of avgPR into intervals. For instance:
Pear1down = (avgPR >= 0 and avgPR < 0.2)
Pear2down = (avgPR >= 0.2 and avgPR < 0.4)
Pear3down = (avgPR >= 0.4 and avgPR < 0.5)
Pear4down = (avgPR >= 0.5 and avgPR < 0.6)
Pear5down = (avgPR >= 0.6 and avgPR < 0.65)
Pear6down = (avgPR >= 0.65 and avgPR < 0.7)
Pear7down = (avgPR >= 0.7 and avgPR < 0.75)
Pear8down = (avgPR >= 0.75 and avgPR < 0.8)
Pear9down = (avgPR >= 0.8 and avgPR <= 1)
Weighting:
Each condition has an associated weight, such as 0.9 for Pear1up, 1.9 for Pear2up, and so on, up to 9 for Pear9up.
Sum up :
Pear1up = 0.9
Pear2up = 1.9
Pear3up = 2.9
Pear4up = 3.9
Pear5up = 4.99
Pear6up = 6
Pear7up = 7
Pear8up = 8
Pear9up = 9
Total Score:
The positive score (posScorePear) is the sum of these values for each condition that returns true.
A corresponding negative score (negScorePear) is calculated using conditions for when avgPR falls on the positive side, with similar weights in the negative direction.
This score quantifies the current correlation reading by translating its relative level into a numeric score through a weighted sum.
3. Trendpear Score
What It Represents: The Trendpear score is more dynamic as it compares the current avgPR with its short-term moving average (sma_avgPR / 14 periods ) and also considers its relationship with an even longer moving average (bigsma_avgPR / 100 periods). It is meant to capture the trend or momentum in the correlation behavior.
How It’s Calculated:
Conditions: Nine conditions (from Trendpear1up to Trendpear9up) are defined to check:
Whether avgPR is below, equal to, or above sma_avgPR by different margins;
Whether it is trending upward (i.e., it is higher than its previous value).
Here are the rules
Trendpear1up = (avgPR <= sma_avgPR -0.2) and (avgPR >= avgPR )
Trendpear2up = (avgPR > sma_avgPR -0.2) and (avgPR <= sma_avgPR -0.07) and (avgPR >= avgPR )
Trendpear3up = (avgPR > sma_avgPR -0.07) and (avgPR <= sma_avgPR -0.03) and (avgPR >= avgPR )
Trendpear4up = (avgPR > sma_avgPR -0.03) and (avgPR <= sma_avgPR -0.02) and (avgPR >= avgPR )
Trendpear5up = (avgPR > sma_avgPR -0.02) and (avgPR <= sma_avgPR -0.01) and (avgPR >= avgPR )
Trendpear6up = (avgPR > sma_avgPR -0.01) and (avgPR <= sma_avgPR -0.001) and (avgPR >= avgPR )
Trendpear7up = (avgPR >= sma_avgPR) and (avgPR >= avgPR ) and (avgPR <= bigsma_avgPR)
Trendpear8up = (avgPR >= sma_avgPR) and (avgPR >= avgPR ) and (avgPR >= bigsma_avgPR -0.03)
Trendpear9up = (avgPR >= sma_avgPR) and (avgPR >= avgPR ) and (avgPR >= bigsma_avgPR)
Weighting:
The weights here are not linear. For example, the lightest condition may add 0.1 point, whereas the most extreme condition (e.g., when avgPR is not only above the moving average but also reaches a high proportion relative to bigsma_avgPR) might add as much as 90 points.
Trendpear1up = 0.1
Trendpear2up = 0.2
Trendpear3up = 0.3
Trendpear4up = 0.4
Trendpear5up = 0.5
Trendpear6up = 0.69
Trendpear7up = 7
Trendpear8up = 8.9
Trendpear9up = 90
Total Score:
The positive score (posScoreTrendpear) is the sum of the weights from all conditions that are satisfied.
A negative counterpart (negScoreTrendpear) exists similarly for when the trend indicates a downward bias.
Trendpear integrates both the level and the direction of change in the correlations, giving a strong numeric indication when the market starts to diverge from its short-term average.
4. Deviation Score
What It Represents: The “Écart” score quantifies how far the asset’s price deviates from the boundaries defined by the regression channels. This metric can indicate if the price is excessively deviating—which might signal an eventual reversion—or confirming a breakout.
How It’s Calculated:
Conditions: For each channel (with at least seven channels contributing to the scoring from the provided code), there are three levels of deviation:
First tier (EcartXup): Checks if the price is below the upper boundary but above a second boundary.
Second tier (EcartXup2): Checks if the price has dropped further, between a lower and a more extreme boundary.
Third tier (EcartXup3): Checks if the price is below the most extreme limit.
Weighting:
Each tier within a channel has a very small weight for the lowest severities (for example, 0.0001 for the first tier, 0.0002 for the second, 0.0003 for the third) with weights increasing with the channel index.
First channel : 0.0001 to 0.0003 (very short term)
Second channel : 0.001 to 0.003 (short term)
Third channel : 0.01 to 0.03 (short mid term)
4th channel : 0.1 to 0.3 ( mid term)
5th channel: 1 to 3 (long mid term)
6th channel : 10 to 30 (long term)
7th channel : 100 to 300 (very long term)
Total Score:
The overall positive score (posScoreEcart) is the sum of all the weights for conditions met among the first, second, and third tiers.
The corresponding negative score (negScoreEcart) is calculated similarly (using conditions when the price is above the channel boundaries), with the weights being the same in magnitude but negative in sign.
This layered scoring method allows the indicator to reflect both minor and major deviations in a gradated and cumulative manner.
Example :
Score + = 321.0001
Score - = -0.111
The asset price is really overextended in long term view, not for mid term & short term expect the in the very short term.
Score + = 0.0033
Score - = -1.11
The asset price is really extended in short term view, not for mid term (even a bit underextended) & long term is neutral
5. Slope Score
What It Represents: The Slope score captures the trend direction and steepness of the regression channels. It reflects whether the regression line (and hence the underlying trend) is sloping upward or downward.
How It’s Calculated:
Conditions:
if the slope has a uptrend = 1
if the slope has a downtrend = -1
Weighting:
First channel : 0.0001 to 0.0003 (very short term)
Second channel : 0.001 to 0.003 (short term)
Third channel : 0.01 to 0.03 (short mid term)
4th channel : 0.1 to 0.3 ( mid term)
5th channel: 1 to 3 (long mid term)
6th channel : 10 to 30 (long term)
7th channel : 100 to 300 (very long term)
The positive slope conditions incrementally add weights from 0.0001 for the smallest positive slopes to 100 for the largest among the seven checks. And negative for the downward slopes.
The positive score (posScoreSlope) is the sum of all the weights from the upward slope conditions that are met.
The negative score (negScoreSlope) sums the negative weights when downward conditions are met.
Example :
Score + = 111
Score - = -0.1111
Trend is up for longterm & down for mid & short term
The slope score therefore emphasizes both the magnitude and the direction of the trend as indicated by the regression channels, with an intentional asymmetry that flags strong downtrends more aggressively.
Summary
For each category—BigPear, Pear, Trendpear, Écart, and Slope—the indicator evaluates a defined set of conditions. Each condition is a binary test (true/false) based on different thresholds or comparisons (for example, comparing the current value to a moving average or a channel boundary). When a condition is true, its assigned weight is added to the cumulative score for that category. These individual scores, both positive and negative, are then displayed in a table, making it easy for the trader to see at a glance where the market stands according to each analytical dimension.
This comprehensive, weighted approach allows the indicator to encapsulate several layers of market information into a single set of scores, aiding in the identification of potential trading opportunities or market reversals.
5. Practical Use and Application
How to Use the Indicator:
Interpreting the Signals:
On your chart, observe the following components:
The individual correlation curves and their average, plotted with visual thresholds;
Visual markers (such as emojis and shape markers) that signal potential oversold or overbought conditions
The summary table that aggregates the scores from each category, offering a quick glance at the market’s state.
Trading Alerts and Decisions: Set your TradingView alerts through the alertcondition functions provided by the indicator. This way, you receive immediate notifications when critical conditions are met, allowing you to react as soon as the market reaches key levels. This tool is especially beneficial for advanced traders who want to combine multiple technical dimensions to optimize entry and exit points with a confluence of signals.
Conclusion and Additional Insights
In summary, this advanced indicator innovatively combines multi-scale Pearson correlation analysis (via multiple linear regressions) with robust regression channel analysis. It offers a deep and nuanced view of market dynamics by delivering clear visual signals and a comprehensive numerical summary through a built-in score table.
Combine this indicator with other tools (e.g., oscillators, moving averages, volume indicators) to enhance overall strategy robustness.

Topological Market Stress (TMS) - Quantum FabricTopological Market Stress (TMS) - Quantum Fabric
What Stresses The Market?
Topological Market Stress (TMS) represents a revolutionary fusion of algebraic topology and quantum field theory applied to financial markets. Unlike traditional indicators that analyze price movements linearly, TMS examines the underlying topological structure of market data—detecting when the very fabric of market relationships begins to tear, warp, or collapse.
Drawing inspiration from the ethereal beauty of quantum field visualizations and the mathematical elegance of topological spaces, this indicator transforms complex mathematical concepts into an intuitive, visually stunning interface that reveals hidden market dynamics invisible to conventional analysis.
Theoretical Foundation: Topology Meets Markets
Topological Holes in Market Structure
In algebraic topology, a "hole" represents a fundamental structural break—a place where the normal connectivity of space fails. In markets, these topological holes manifest as:
Correlation Breakdown: When traditional price-volume relationships collapse
Volatility Clustering Failure: When volatility patterns lose their predictive power
Microstructure Stress: When market efficiency mechanisms begin to fail
The Mathematics of Market Topology
TMS constructs a topological space from market data using three key components:
1. Correlation Topology
ρ(P,V) = correlation(price, volume, period)
Hole Formation = 1 - |ρ(P,V)|
When price and volume decorrelate, topological holes begin forming.
2. Volatility Clustering Topology
σ(t) = volatility at time t
Clustering = correlation(σ(t), σ(t-1), period)
Breakdown = 1 - |Clustering|
Volatility clustering breakdown indicates structural instability.
3. Market Efficiency Topology
Efficiency = |price - EMA(price)| / ATR
Measures how far price deviates from its efficient trajectory.
Multi-Scale Topological Analysis
Markets exist across multiple temporal scales simultaneously. TMS analyzes topology at three distinct scales:
Micro Scale (3-15 periods): Immediate structural changes, market microstructure stress
Meso Scale (10-50 periods): Trend-level topology, medium-term structural shifts
Macro Scale (50-200 periods): Long-term structural topology, regime-level changes
The final stress metric combines all scales:
Combined Stress = 0.3×Micro + 0.4×Meso + 0.3×Macro
How TMS Works
1. Topological Space Construction
Each market moment is embedded in a multi-dimensional topological space where:
- Price efficiency forms one dimension
- Correlation breakdown forms another
- Volatility clustering breakdown forms the third
2. Hole Detection Algorithm
The indicator continuously scans this topological space for:
Hole Formation: When stress exceeds the formation threshold
Hole Persistence: How long structural breaks maintain
Hole Collapse: Sudden topology restoration (regime shifts)
3. Quantum Visualization Engine
The visualization system translates topological mathematics into intuitive quantum field representations:
Stress Waves: Main line showing topological stress intensity
Quantum Glow: Surrounding field indicating stress energy
Fabric Integrity: Background showing structural health
Multi-Scale Rings: Orbital representations of different timeframes
4. Signal Generation
Stable Topology (✨): Normal market structure, standard trading conditions
Stressed Topology (⚡): Increased structural tension, heightened volatility expected
Topological Collapse (🕳️): Major structural break, regime shift in progress
Critical Stress (🌋): Extreme conditions, maximum caution required
Inputs & Parameters
🕳️ Topological Parameters
Analysis Window (20-200, default: 50)
Primary period for topological analysis
20-30: High-frequency scalping, rapid structure detection
50: Balanced approach, recommended for most markets
100-200: Long-term position trading, major structural shifts only
Hole Formation Threshold (0.1-0.9, default: 0.3)
Sensitivity for detecting topological holes
0.1-0.2: Very sensitive, detects minor structural stress
0.3: Balanced, optimal for most market conditions
0.5-0.9: Conservative, only major structural breaks
Density Calculation Radius (0.1-2.0, default: 0.5)
Radius for local density estimation in topological space
0.1-0.3: Fine-grained analysis, sensitive to local changes
0.5: Standard approach, balanced sensitivity
1.0-2.0: Broad analysis, focuses on major structural features
Collapse Detection (0.5-0.95, default: 0.7)
Threshold for detecting sudden topology restoration
0.5-0.6: Very sensitive to regime changes
0.7: Balanced, reliable collapse detection
0.8-0.95: Conservative, only major regime shifts
📊 Multi-Scale Analysis
Enable Multi-Scale (default: true)
- Analyzes topology across multiple timeframes simultaneously
- Provides deeper insight into market structure at different scales
- Essential for understanding cross-timeframe topology interactions
Micro Scale Period (3-15, default: 5)
Fast scale for immediate topology changes
3-5: Ultra-fast, tick/minute data analysis
5-8: Fast, 5m-15m chart optimization
10-15: Medium-fast, 30m-1H chart focus
Meso Scale Period (10-50, default: 20)
Medium scale for trend topology analysis
10-15: Short trend structures
20-25: Medium trend structures (recommended)
30-50: Long trend structures
Macro Scale Period (50-200, default: 100)
Slow scale for structural topology
50-75: Medium-term structural analysis
100: Long-term structure (recommended)
150-200: Very long-term structural patterns
⚙️ Signal Processing
Smoothing Method (SMA/EMA/RMA/WMA, default: EMA) Method for smoothing stress signals
SMA: Simple average, stable but slower
EMA: Exponential, responsive and recommended
RMA: Running average, very smooth
WMA: Weighted average, balanced approach
Smoothing Period (1-10, default: 3)
Period for signal smoothing
1-2: Minimal smoothing, noisy but fast
3-5: Balanced, recommended for most applications
6-10: Heavy smoothing, slow but very stable
Normalization (Fixed/Adaptive/Rolling, default: Adaptive)
Method for normalizing stress values
Fixed: Static 0-1 range normalization
Adaptive: Dynamic range adjustment (recommended)
Rolling: Rolling window normalization
🎨 Quantum Visualization
Fabric Style Options:
Quantum Field: Flowing energy visualization with smooth gradients
Topological Mesh: Mathematical topology with stepped lines
Phase Space: Dynamical systems view with circular markers
Minimal: Clean, simple display with reduced visual elements
Color Scheme Options:
Quantum Gradient: Deep space blue → Quantum red progression
Thermal: Black → Hot orange thermal imaging style
Spectral: Purple → Gold full spectrum colors
Monochrome: Dark gray → Light gray elegant simplicity
Multi-Scale Rings (default: true)
- Display orbital rings for different time scales
- Visualizes how topology changes across timeframes
- Provides immediate visual feedback on cross-scale dynamics
Glow Intensity (0.0-1.0, default: 0.6)
Controls the quantum glow effect intensity
0.0: No glow, pure line display
0.6: Balanced, recommended setting
1.0: Maximum glow, full quantum field effect
📋 Dashboard & Alerts
Show Dashboard (default: true)
Real-time topology status display
Current market state and trading recommendations
Stress level visualization and fabric integrity status
Show Theory Guide (default: true)
Educational panel explaining topological concepts
Dashboard interpretation guide
Trading strategy recommendations
Enable Alerts (default: true)
Extreme stress detection alerts
Topological collapse notifications
Hole formation and recovery signals
Visual Logic & Interpretation
Main Visualization Elements
Quantum Stress Line
Primary indicator showing topological stress intensity
Color intensity reflects current market state
Line style varies based on selected fabric style
Glow effect indicates stress energy field
Equilibrium Line
Silver line showing average stress level
Reference point for normal market conditions
Helps identify when stress is elevated or suppressed
Upper/Lower Bounds
Red upper bound: High stress threshold
Green lower bound: Low stress threshold
Quantum fabric fill between bounds shows stress field
Multi-Scale Rings
Aqua circles : Micro-scale topology (immediate changes)
Orange circles: Meso-scale topology (trend-level changes)
Provides cross-timeframe topology visualization
Dashboard Information
Topology State Icons:
✨ STABLE: Normal market structure, standard trading conditions
⚡ STRESSED: Increased structural tension, monitor closely
🕳️ COLLAPSE: Major structural break, regime shift occurring
🌋 CRITICAL: Extreme conditions, reduce risk exposure
Stress Bar Visualization:
Visual representation of current stress level (0-100%)
Color-coded based on current topology state
Real-time percentage display
Fabric Integrity Dots:
●●●●● Intact: Strong market structure (0-30% stress)
●●●○○ Stressed: Weakening structure (30-70% stress)
●○○○○ Fractured: Breaking down structure (70-100% stress)
Action Recommendations:
✅ TRADE: Normal conditions, standard strategies apply
⚠️ WATCH: Monitor closely, increased vigilance required
🔄 ADAPT: Change strategy, regime shift in progress
🛑 REDUCE: Lower risk exposure, extreme conditions
Trading Strategies
In Stable Topology (✨ STABLE)
- Normal trading conditions apply
- Use standard technical analysis
- Regular position sizing appropriate
- Both trend-following and mean-reversion strategies viable
In Stressed Topology (⚡ STRESSED)
- Increased volatility expected
- Widen stop losses to account for higher volatility
- Reduce position sizes slightly
- Focus on high-probability setups
- Monitor for potential regime change
During Topological Collapse (🕳️ COLLAPSE)
- Major regime shift in progress
- Adapt strategy immediately to new market character
- Consider closing positions that rely on previous regime
- Wait for new topology to stabilize before major trades
- Opportunity for contrarian plays if collapse is extreme
In Critical Stress (🌋 CRITICAL)
- Extreme market conditions
- Significantly reduce risk exposure
- Avoid new positions until stress subsides
- Focus on capital preservation
- Consider hedging existing positions
Advanced Techniques
Multi-Timeframe Topology Analysis
- Use higher timeframe TMS for regime context
- Use lower timeframe TMS for precise entry timing
- Alignment across timeframes = highest probability trades
Topology Divergence Trading
- Most powerful at regime boundaries
- Price makes new high/low but topology stress decreases
- Early warning of potential reversals
- Combine with key support/resistance levels
Stress Persistence Analysis
- Long periods of stable topology often precede major moves
- Extended stress periods often resolve in regime changes
- Use persistence tracking for position sizing decisions
Originality & Innovation
TMS represents a genuine breakthrough in applying advanced mathematics to market analysis:
True Topological Analysis: Not a simplified proxy but actual topological space construction and hole detection using correlation breakdown, volatility clustering analysis, and market efficiency measurement.
Quantum Aesthetic: Transforms complex topology mathematics into an intuitive, visually stunning interface inspired by quantum field theory visualizations.
Multi-Scale Architecture: Simultaneous analysis across micro, meso, and macro timeframes provides unprecedented insight into market structure dynamics.
Regime Detection: Identifies fundamental market character changes before they become obvious in price action, providing early warning of structural shifts.
Practical Application: Clear, actionable signals derived from advanced mathematical concepts, making theoretical topology accessible to practical traders.
This is not a combination of existing indicators or a cosmetic enhancement of standard tools. It represents a fundamental reimagining of how we measure, visualize, and interpret market dynamics through the lens of algebraic topology and quantum field theory.
Best Practices
Start with defaults: Parameters are optimized for broad market applicability
Match timeframe: Adjust scales based on your trading timeframe
Confirm with price action: TMS shows market character, not direction
Respect topology changes: Reduce risk during regime transitions
Use appropriate strategies: Adapt approach based on current topology state
Monitor persistence: Track how long topology states maintain
Cross-timeframe analysis: Align multiple timeframes for highest probability trades
Alerts Available
Extreme Topological Stress: Market fabric under severe deformation
Topological Collapse Detected: Regime shift in progress
Topological Hole Forming: Market structure breakdown detected
Topology Stabilizing: Market structure recovering to normal
Chart Requirements
Recommended Markets: All liquid markets (forex, stocks, crypto, futures)
Optimal Timeframes: 5m to Daily (adaptable to any timeframe)
Minimum History: 200 bars for proper topology construction
Best Performance: Markets with clear regime characteristics
Academic Foundation
This indicator draws from cutting-edge research in:
- Algebraic topology and persistent homology
- Quantum field theory visualization techniques
- Market microstructure analysis
- Multi-scale dynamical systems theory
- Correlation topology and network analysis
Disclaimer
This indicator is for educational and research purposes only. It does not constitute financial advice or provide direct buy/sell signals. Topological analysis reveals market structure characteristics, not future price direction. Always use proper risk management and combine with your own analysis. Past performance does not guarantee future results.
See markets through the lens of topology. Trade the structure, not the noise.
Bringing advanced mathematics to practical trading through quantum-inspired visualization.
Trade with insight. Trade with structure.
— Dskyz , for DAFE Trading Systems

NIFTY Option Chain Table with Custom CE/PE Price FiltersThis Pine Script creates a powerful and visually organized option chain dashboard for NIFTY Index Options, showing 10 Call Options (CE) and 10 Put Options (PE), with real-time prices updated on a 5-minute chart.
You can filter and view only the most relevant option contracts based on your preferred price ranges, helping you make quick decisions for scalping, intraday, or positional trades.
🔍 How It Works:
You manually select up to 10 Call Option symbols and 10 Put Option symbols from NSE (e.g., NIFTY240530C18000, NIFTY240530P18000, etc.).
Keep that time options this are old options in defalt so there will be a error
The script fetches the real-time close price of each option using the request.security() function.
You define the minimum and maximum price range separately for Calls and Puts.
The script filters out any options that fall outside of your desired price range.
Only a limited number of matching options (as set by you) are displayed in the table for both Calls and Puts.
The table is shown at your preferred location on the chart (Bottom Right, Top Left, etc.).
✅ Features:
🔟 Supports exactly 10 CE and 10 PE options for tracking.
📈 Live price updates pulled directly from the chart timeframe (5-min).
🎯 Custom price filters for CE and PE (separate inputs).
📊 Show only the top X number of contracts that meet your filter criteria.
🧱 Vertical layout with clear headers and color-coded sections (green for Calls, red for Puts).
🎛️ Position the table wherever it's most convenient on your chart.
⚡ Helps you quickly spot low premium or range-bound options during the day.
📌 Use Case:
Ideal for:
Option scalpers and day traders who want to focus only on options within a specific price zone.
Traders who want to monitor multiple strikes simultaneously without clutter.
Users building custom NIFTY strategies based on option premiums.
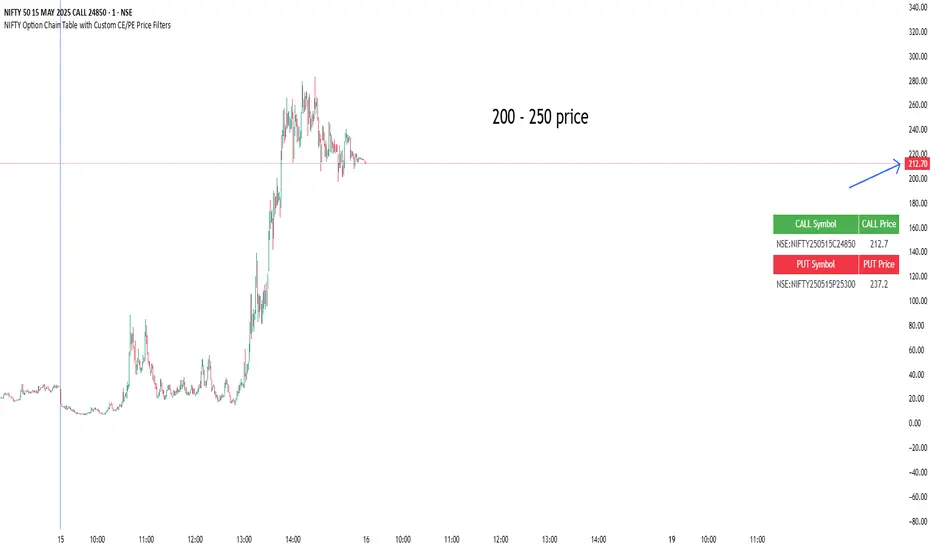
Enhanced Volume Trend Indicator with BB SqueezeEnhanced Volume Trend Indicator with BB Squeeze: Comprehensive Explanation
The visualization system allows traders to quickly scan multiple securities to identify high-probability setups without detailed analysis of each chart. The progression from squeeze to breakout, supported by volume trend confirmation, offers a systematic approach to identifying trading opportunities.
The script combines multiple technical analysis approaches into a comprehensive dashboard that helps traders make informed decisions by identifying high-probability setups while filtering out noise through its sophisticated confirmation requirements. It combines multiple technical analysis approaches into an integrated visual system that helps traders identify potential trading opportunities while filtering out false signals.
Core Features
1. Volume Analysis Dashboard
The indicator displays various volume-related metrics in customizable tables:
AVOL (After Hours + Pre-Market Volume): Shows extended hours volume as a percentage of the 21-day average volume with color coding for buying/selling pressure. Green indicates buying pressure and red indicates selling pressure.
Volume Metrics: Includes regular volume (VOL), dollar volume ($VOL), relative volume compared to 21-day average (RVOL), and relative volume compared to 90-day average (RVOL90D).
Pre-Market Data: Optional display of pre-market volume (PVOL), pre-market dollar volume (P$VOL), pre-market relative volume (PRVOL), and pre-market price change percentage (PCHG%).
2. Enhanced Volume Trend (VTR) Analysis
The Volume Trend indicator uses adaptive analysis to evaluate buying and selling pressure, combining multiple factors:
MACD (Moving Average Convergence Divergence) components
Volume-to-SMA (Simple Moving Average) ratio
Price direction and market conditions
Volume change rates and momentum
EMA (Exponential Moving Average) alignment and crossovers
Volatility filtering
VTR Visual Indicators
The VTR score ranges from 0-100, with values above 50 indicating bullish conditions and below 50 indicating bearish conditions. This is visually represented by colored circles:
"●" (Filled Circle):
Green: Strong bullish trend (VTR ≥ 80)
Red: Strong bearish trend (VTR ≤ 20)
"◯" (Hollow Circle):
Green: Moderate bullish trend (VTR 65-79)
Red: Moderate bearish trend (VTR 21-35)
"·" (Small Dot):
Green: Weak bullish trend (VTR 55-64)
Red: Weak bearish trend (VTR 36-45)
"○" (Medium Hollow Circle): Neutral conditions (VTR 46-54), shown in gray
In "Both" display mode, the VTR shows both the numerical score (0-100) alongside the appropriate circle symbol.
Enhanced VTR Settings
The Enhanced Volume Trend component offers several advanced customization options:
Adaptive Volume Analysis (volTrendAdaptive):
When enabled, dynamically adjusts volume thresholds based on recent market volatility
Higher volatility periods require proportionally higher volume to generate significant signals
Helps prevent false signals during highly volatile markets
Keep enabled for most trading conditions, especially in volatile markets
Speed of Change Weight (volTrendSpeedWeight, range 0-1):
Controls emphasis on volume acceleration/deceleration rather than absolute levels
Higher values (0.7-1.0): More responsive to new volume trends, better for momentum trading
Lower values (0.2-0.5): Less responsive, better for trend following
Helps identify early volume trends before they fully develop
Momentum Period (volTrendMomentumPeriod, range 2-10):
Defines lookback period for volume change rate calculations
Lower values (2-3): More responsive to recent changes, better for short timeframes
Higher values (7-10): Smoother, better for daily/weekly charts
Directly affects how quickly the indicator responds to new volume patterns
Volatility Filter (volTrendVolatilityFilter):
Adjusts significance of volume by factoring in current price volatility
High volume during high volatility receives less weight
High volume during low volatility receives more weight
Helps distinguish between genuine volume-driven moves and volatility-driven moves
EMA Alignment Weight (volTrendEmaWeight, range 0-1):
Controls importance of EMA alignments in final VTR calculation
Analyzes multiple EMA relationships (5, 10, 21 period)
Higher values (0.7-1.0): Greater emphasis on trend structure
Lower values (0.2-0.5): More focus on pure volume patterns
Display Mode (volTrendDisplayMode):
"Value": Shows only numerical score (0-100)
"Strength": Shows only symbolic representation
"Both": Shows numerical score and symbol together
3. Bollinger Band Squeeze Detection (SQZ)
The BB Squeeze indicator identifies periods of low volatility when Bollinger Bands contract inside Keltner Channels, often preceding significant price movements.
SQZ Visual Indicators
"●" (Filled Circle): Strong squeeze - high probability setup for an impending breakout
Green: Strong squeeze with bullish bias (likely upward breakout)
Red: Strong squeeze with bearish bias (likely downward breakout)
Orange: Strong squeeze with unclear direction
"◯" (Hollow Circle): Moderate squeeze - medium probability setup
Green: With bullish EMA alignment
Red: With bearish EMA alignment
Orange: Without clear directional bias
"-" (Dash): Gray dash indicates no squeeze condition (normal volatility)
The script identifies squeeze conditions through multiple methods:
Bollinger Bands contracting inside Keltner Channels
BB width falling to bottom 20% of recent range (BB width percentile)
Very narrow Keltner Channel (less than 5% of basis price)
Tracking squeeze duration in consecutive bars
Different squeeze strengths are detected:
Strong Squeeze: BB inside KC with tight BB width and narrow KC
Moderate Squeeze: BB inside KC with either tight BB width or narrow KC
No Squeeze: Normal market conditions
4. Breakout Detection System
The script includes two breakout indicators working in sequence:
4.1 Pre-Breakout (PBK) Indicator
Detects potential upcoming breakouts by analyzing multiple factors:
Squeeze conditions lasting 2-3 bars or more
Significant price ranges
Strong volume confirmation
EMA/MACD crossovers
Consistent price direction
PBK Visual Indicators
"●" (Filled Circle): Detected pre-breakout condition
Green: Likely upward breakout (bullish)
Red: Likely downward breakout (bearish)
Orange: Direction not yet clear, but breakout likely
"-" (Dash): Gray dash indicates no pre-breakout condition
The PBK uses sophisticated conditions to reduce false signals including minimum squeeze length, significant price movement, and technical confirmations.
4.2 Breakout (BK) Indicator
Confirms actual breakouts in progress by identifying:
End of squeeze or strong expansion of Bollinger Bands
Volume expansion
Price moving outside Bollinger Bands
EMA crossovers with volume confirmation
MACD crossovers with significant price range
BK Visual Indicators
"●" (Filled Circle): Confirmed breakout in progress
Green: Upward breakout (bullish)
Red: Downward breakout (bearish)
Orange: Unusual breakout pattern without clear direction
"◆" (Diamond): Special breakout conditions (meets some but not all criteria)
"-" (Dash): Gray dash indicates no breakout detected
The BK indicator uses advanced filters for confirmation:
Requires consecutive breakout signals to reduce false positives
Strong volume confirmation requirements (40% above average)
Significant price movement thresholds
Consistency checks between price action and indicators
5. Market Metrics and Analysis
Price Change Percentage (CHG%)
Displays the current percentage change relative to the previous day's close, color-coded green for positive changes and red for negative changes.
Average Daily Range (ADR%)
Calculates the average daily percentage range over a specified period (default 20 days), helping traders gauge volatility and set appropriate price targets.
Average True Range (ATR)
Shows the Average True Range value, a volatility indicator developed by J. Welles Wilder that measures market volatility by decomposing the entire range of an asset price for that period.
Relative Strength Index (RSI)
Displays the standard 14-period RSI, a momentum oscillator that measures the speed and change of price movements on a scale from 0 to 100.
6. External Market Indicators
QQQ Change
Shows the percentage change in the Invesco QQQ Trust (tracking the Nasdaq-100 Index), useful for understanding broader tech market trends.
UVIX Change
Displays the percentage change in UVIX, a volatility index, providing insight into market fear and potential hedging activity.
BTC-USD
Shows the current Bitcoin price from Coinbase, useful for traders monitoring crypto correlation with equities.
Market Breadth (BRD)
Calculates the percentage difference between ATHI.US and ATLO.US (high vs. low securities), indicating overall market direction and strength.
7. Session Analysis and Volume Direction
Session Detection
The script accurately identifies different market sessions:
Pre-market: 4:00 AM to 9:30 AM
Regular market: 9:30 AM to 4:00 PM
After-hours: 4:00 PM to 8:00 PM
Closed: Outside trading hours
This detection works on any timeframe through careful calculation of current time in seconds.
Buy/Sell Volume Direction
The script analyzes buying and selling pressure by:
Counting up volume when close > open
Counting down volume when close < open
Tracking accumulated volume within the day
Calculating intraday pressure (up volume minus down volume)
Enhanced AVOL Calculation
The improved AVOL calculation works in all timeframes by:
Estimating typical pre-market and after-hours volume percentages
Combining yesterday's after-hours with today's pre-market volume
Calculating this as a percentage of the 21-day average volume
Determining buying/selling pressure by analyzing after-hours and pre-market price changes
Color-coding results: green for buying pressure, red for selling pressure
This calculation is particularly valuable because it works consistently across any timeframe.
Customization Options
Display Settings
The dashboard has two customizable tables: Volume Table and Metrics Table, with positions selectable as bottom_left or bottom_right.
All metrics can be individually toggled on/off:
Pre-market data (PVOL, P$VOL, PRVOL, PCHG%)
Volume data (AVOL, RVOL Day, RVOL 90D, Volume, SEED_YASHALGO_NSE_BREADTH:VOLUME )
Price metrics (ADR%, ATR, RSI, Price Change%)
Market indicators (QQQ, UVIX, Breadth, BTC-USD)
Analysis indicators (Volume Trend, BB Squeeze, Pre-Breakout, Breakout)
These toggle options allow traders to customize the dashboard to show only the metrics they find most valuable for their trading style.
Table and Text Customization
The dashboard's appearance can be customized:
Table background color via tableBgColor
Text color (White or Black) via textColorOption
The indicator uses smart formatting for volume and price values, automatically adding appropriate suffixes (K, M, B) for readability.
MACD Configuration for VTR
The Volume Trend calculation incorporates MACD with customizable parameters:
Fast Length: Controls the period for the fast EMA (default 3)
Slow Length: Controls the period for the slow EMA (default 9)
Signal Length: Controls the period for the signal line EMA (default 5)
MACD Weight: Controls how much influence MACD has on the volume trend score (default 0.3)
These settings allow traders to fine-tune how momentum is factored into the volume trend analysis.
Bollinger Bands and Keltner Channel Settings
The Bollinger Bands and Keltner Channels used for squeeze detection have preset (hidden) parameters:
BB Length: 20 periods
BB Multiplier: 2.0 standard deviations
Keltner Length: 20 periods
Keltner Multiplier: 1.5 ATR
These settings follow standard practice for squeeze detection while maintaining simplicity in the user interface.
Practical Trading Applications
Complete Trading Strategies
1. Squeeze Breakout Strategy
This strategy combines multiple components of the indicator:
Wait for a strong squeeze (SQZ showing ●)
Look for pre-breakout confirmation (PBK showing ● in green or red)
Enter when breakout is confirmed (BK showing ● in same direction)
Use VTR to confirm volume supports the move (VTR ≥ 65 for bullish or ≤ 35 for bearish)
Set profit targets based on ADR (Average Daily Range)
Exit when VTR begins to weaken or changes direction
2. Volume Divergence Strategy
This strategy focuses on the volume trend relative to price:
Identify when price makes a new high but VTR fails to confirm (divergence)
Look for VTR to show weakening trend (● changing to ◯ or ·)
Prepare for potential reversal when SQZ begins to form
Enter counter-trend position when PBK confirms reversal direction
Use external indicators (QQQ, BTC, Breadth) to confirm broader market support
3. Pre-Market Edge Strategy
This strategy leverages pre-market data:
Monitor AVOL for unusual pre-market activity (significantly above 100%)
Check pre-market price change direction (PCHG%)
Enter position at market open if VTR confirms direction
Use SQZ to determine if volatility is likely to expand
Exit based on RVOL declining or price reaching +/- ADR for the day
Market Context Integration
The indicator provides valuable context for trading decisions:
QQQ change shows tech market direction
BTC price shows crypto market correlation
UVIX change indicates volatility expectations
Breadth measurement shows market internals
This context helps traders avoid fighting the broader market and align trades with overall market direction.
Timeframe Optimization
The indicator is designed to work across different timeframes:
For day trading: Focus on AVOL, VTR, PBK/BK, and use shorter momentum periods
For swing trading: Focus on SQZ duration, VTR strength, and broader market indicators
For position trading: Focus on larger VTR trends and use EMA alignment weight
Advanced Analytical Components
Enhanced Volume Trend Score Calculation
The VTR score calculation is sophisticated, with the base score starting at 50 and adjusting for:
Price direction (up/down)
Volume relative to average (high/normal/low)
Volume acceleration/deceleration
Market conditions (bull/bear)
Additional factors are then applied, including:
MACD influence weighted by strength and direction
Volume change rate influence (speed)
Price/volume divergence effects
EMA alignment scores
Volatility adjustments
Breakout strength factors
Price action confirmations
The final score is clamped between 0-100, with values above 50 indicating bullish conditions and below 50 indicating bearish conditions.
Anti-False Signal Filters
The indicator employs multiple techniques to reduce false signals:
Requiring significant price range (minimum percentage movement)
Demanding strong volume confirmation (significantly above average)
Checking for consistent direction across multiple indicators
Requiring prior bar consistency (consecutive bars moving in same direction)
Counting consecutive signals to filter out noise
These filters help eliminate noise and focus on high-probability setups.
MACD Enhancement and Integration
The indicator enhances standard MACD analysis:
Calculating MACD relative strength compared to recent history
Normalizing MACD slope relative to volatility
Detecting MACD acceleration for stronger signals
Integrating MACD crossovers with other confirmation factors
EMA Analysis System
The indicator uses a comprehensive EMA analysis system:
Calculating multiple EMAs (5, 10, 21 periods)
Detecting golden cross (10 EMA crosses above 21 EMA)
Detecting death cross (10 EMA crosses below 21 EMA)
Assessing price position relative to EMAs
Measuring EMA separation percentage
Recent Enhancements and Evolution
Version 5.2 includes several improvements:
Enhanced AVOL to show buying/selling direction through color coding
Improved VTR with adaptive analysis based on market conditions
AVOL display now works in all timeframes through sophisticated estimation
Removed animal symbols and streamlined code with bright colors for better visibility
Improved anti-false signal filters throughout the system
Optimizing Indicator Settings
For Different Market Types
Range-Bound Markets:
Lower EMA Alignment Weight (0.2-0.4)
Higher Speed of Change Weight (0.8-1.0)
Focus on SQZ and PBK signals for breakout potential
Trending Markets:
Higher EMA Alignment Weight (0.7-1.0)
Moderate Speed of Change Weight (0.4-0.6)
Focus on VTR strength and BK confirmations
Volatile Markets:
Enable Volatility Filter
Enable Adaptive Volume Analysis
Lower Momentum Period (2-3)
Focus on strong volume confirmation (VTR ≥ 80 or ≤ 20)
For Different Asset Classes
Equities:
Standard settings work well
Pay attention to AVOL for gap potential
Monitor QQQ correlation
Futures:
Consider higher Volume/RVOL weight
Reduce MACD weight slightly
Pay close attention to SQZ duration
Crypto:
Higher volatility thresholds may be needed
Monitor BTC price for correlation
Focus on stronger confirmation signals
Integrated Visual System for Trading Decisions
The colored circle indicators create an intuitive visual system for quick market assessment:
Progression Sequence: SQZ (Squeeze) → PBK (Pre-Breakout) → BK (Breakout)
This sequence often occurs in order, with the squeeze leading to pre-breakout conditions, followed by an actual breakout.
VTR (Volume Trend): Provides context about the volume supporting these movements.
Color Coding: Green for bullish conditions, red for bearish conditions, and orange/gray for neutral or undefined conditions.

SBC ProtfoSBC Portfo PNL Indicator
Description
The SBC Portfo PNL Indicator is a user-friendly tool designed for Hebrew-speaking traders to track the Profit and Loss (PNL) of their stock portfolios on TradingView charts. It supports up to 5 distinct portfolios, each capable of holding an unlimited number of stocks with unlimited buy commands, allowing real-time monitoring of portfolio performance.
Key Features
- Multi-Portfolio Support: Track up to 5 separate portfolios for different trading strategies or accounts.
- Unlimited Stock Entries: Add unlimited stocks and buy commands per portfolio.
- Detailed Buy Commands: Input for each stock:
- Stock Ticker (e.g., AAPL, TSLA).
- Buy Price (e.g., 150.25).
- Buy Amount (e.g., 10).
- Hebrew-Friendly Interface: Intuitive settings dialog with clear instructions in Hebrew.
- Customizable PNL Tracking: Visualize PNL on charts with real-time updates based on market data.
How to Use
1. Add the Indicator:
- Go to the Indicators menu in TradingView and add the "SBC Portfo" PNL Indicator.
2. Configure Portfolios:
- Open the indicator’s settings dialog.
- For each portfolio (up to 5), enter data in the provided input fields using this format:
PortfolioName:StockTicker:BuyPricexBuyAmount;StockTicker:BuyPricexBuyAmount
Example:
Portfolio1:AAPL:150.25x10;TSLA:266.72x5
- This represents a portfolio named "Portfolio1" with:
- 10 shares of AAPL bought at $150.25.
- 5 shares of TSLA bought at $266.72.
- Repeat for additional portfolios (e.g., Portfolio2, Portfolio3).
- Add multiple buy commands for the same stock if needed (e.g., AAPL:160.50x20).
3. Apply Settings:
- Save settings to display PNL based on current market prices.
4. Monitor PNL:
- View PNL for each portfolio on the chart via tables, labels, or graphical overlays (based on settings).
Input Format
Enter portfolio data manually in the settings dialog, one input field per portfolio:
PortfolioName:StockTicker:BuyPricexBuyAmount;StockTicker:BuyPricexBuyAmount
- PortfolioName: Unique name (e.g., Portfolio1, Growth).
- StockTicker: Stock symbol (e.g., AAPL).
- BuyPrice: Purchase price per share (e.g., 150.25).
- BuyAmount: Number of shares (e.g., 10).
- Use
: to separate portfolio name, ticker, and buy data
x to separate price and amount
; for multiple stocks in the portfolio
Example:
- Portfolio 1: GrowthPortfolio:AAPL:150.25x10;TSLA:266.72x5
- Portfolio 2: DividendPortfolio:KO:55.20x50;PG:145.30x30
Notes
- Hebrew Support: Settings and labels are optimized for Hebrew users.
- Manual Input: Enter portfolio data manually in the settings dialog using the correct format.
- Compatibility: Works with any stock ticker supported by TradingView.
תיאור אינדיקטור SBC Portfo PNL הוא כלי ידידותי למשתמש שתוכנן במיוחד עבור סוחרים דוברי עברית למעקב אחר רווח והפסד (PNL) של תיקי המניות שלהם ישירות בגרפים של TradingView. הוא תומך בעד 5 תיקים נפרדים, כאשר כל תיק יכול להכיל מספר בלתי מוגבל של מניות עם פקודות קנייה בלתי מוגבלות, ומאפשר מעקב בזמן אמת אחר ביצועי התיק.
תכונות עיקריות
- תמיכה בריבוי תיקים: מעקב אחר עד 5 תיקים נפרדים עבור אסטרטגיות מסחר או חשבונות שונים.
- רישום מניות ללא הגבלה: הוספת מספר בלתי מוגבל של מניות ופקודות קנייה לכל תיק.
- פקודות קנייה מפורטות: הזנת נתונים עבור כל מניה:
- סימול המניה (למשל, AAPL, TSLA).
- מחיר קנייה (למשל, 150.25).
- כמות קנייה (למשל, 10).
- ממשק ידידותי לעברית: חלונית הגדרות אינטואיטיבית עם הוראות ברורות בעברית.
- מעקב PNL הניתן להתאמה: הצגת רווח והפסד בגרפים עם עדכונים בזמן אמת בהתבסס על נתוני השוק.
כיצד להשתמש
1. הוספת האינדיקטור:
- נווט לתפריט האינדיקטורים ב-TradingView והוסף את "SBC Portfo PNL Indicator".
2. הגדרת תיקים:
- פתח את חלונית ההגדרות של האינדיקטור.
- עבור כל תיק (עד 5), הזן נתונים בשדות המסופקים בפורמט הבא:
PortfolioName:StockTicker:BuyPricexBuyAmount;StockTicker:BuyPricexBuyAmount
לדוגמה:
Portfolio1:AAPL:150.25x10;TSLA:266.72x5
שורה זו מייצגת תיק בשם "Portfolio1" עם:
- 10 מניות של AAPL שנקנו ב-$150.25.
- 5 מניות של TSLA שנקנו ב-$266.72.
- חזור על התהליך עבור תיקים נוספים (למשל, Portfolio2, Portfolio3).
- ניתן להוסיף פקודות קנייה מרובות לאותה מניה לפי הצורך (למשל, AAPL:160.50x20).
3. החלת ההגדרות:
- שמור את ההגדרות להצגת ה-PNL בהתבסס על מחירי השוק הנוכחיים.
4. מעקב אחר PNL:
- צפה ב-PNL עבור כל תיק בגרף באמצעות טבלאות, תוויות או שכבות גרפיות (בהתאם להגדרות).
פורמט קלט הזן נתוני תיק ידנית בחלונית ההגדרות, שדה קלט אחד לכל תיק: PortfolioName:StockTicker:BuyPricexBuyAmount;StockTicker:BuyPricexBuyAmount
PortfolioName: שם ייחודי (למשל, Portfolio1, Growth).
StockTicker: סימול המניה (למשל, AAPL).
BuyPrice: מחיר רכישה למניה (למשל, 150.25).
BuyAmount: מספר המניות (למשל, 10).
השתמש ב-
: להפרדה בין שם התיק, סימול ונתוני קנייה
x להפרדה בין מחיר וכמות
; להפרדה בין מניות מרובות
דוגמה:
- תיק 1: GrowthPortfolio:AAPL:150.25x10;TSLA:266.72x5
- תיק 2: DividendPortfolio:KO:55.20x50;PG:145.30x30
Release Notes
Version 1.1 includes:
- Calculations for extended hours (Pre-Market & After-Hours).
- Option to display portfolio summary data for stocks not in the portfolio (enable via settings checkbox).
- Table background for better visibility; click to bring table to the front.
- Updated text strings (names, titles, tooltips).
הערות
תמיכה בעברית: ההגדרות והתוויות מותאמות למשתמשים דוברי עברית.
הזנה ידנית: הזן נתוני תיק ידנית בחלונית ההגדרות תוך שימוש בפורמט הנכון.
תאימות: עובד עם כל סימול מניה הנתמך על ידי TradingView.
גרסה 1.1 מכילה:
1. חישובים כוללים שעות מסחר מורחבות (Pre-Market ו-After-Hours).
2. אפשרות להציג נתוני תיק כוללים עבור מניות שאינן בתיק (הפעל באמצעות תיבת סימון בהגדרות).
3. צבע רקע לטבלה לשיפור הנראות; לחיצה על הטבלה מביאה אותה לחזית.
4. תיקון נוסחים (שמות, כותרות, וטולטיפים).
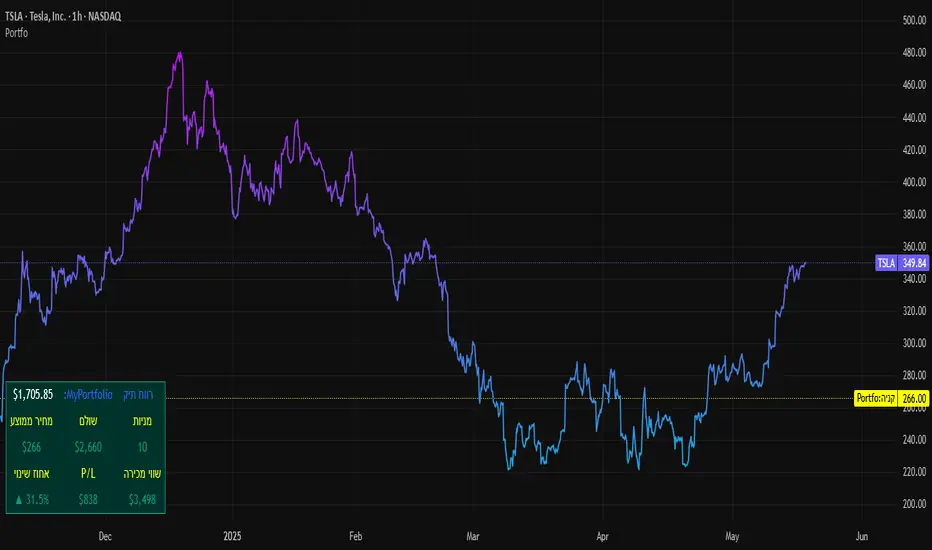
Dskyz Adaptive Futures Elite (DAFE)Dskyz Adaptive Futures Edge (DAFE)
imgur.com
A Dynamic Futures Trading Strategy
DAFE adapts to market volatility and price action using technical indicators and advanced risk management. It’s built for high-stakes futures trading (e.g., MNQ, BTCUSDT.P), offering modular logic for scalpers and swing traders alike.
Key Features
Adaptive Moving Averages
Dynamic Logic: Fast and slow SMAs adjust lengths via ATR, reacting to momentum shifts and smoothing in calm markets.
Signals: Long entry on fast SMA crossing above slow SMA with price confirmation; short on cross below.
RSI Filtering (Optional)
Momentum Check: Confirms entries with RSI crossovers (e.g., above oversold for longs). Toggle on/off with custom levels.
Fine-Tuning: Adjustable lookback and thresholds (e.g., 60/40) for precision.
Candlestick Pattern Recognition
Eng|Enhanced Detection: Identifies strong bullish/bearish engulfing patterns, validated by volume and range strength (vs. 10-period SMA).
Conflict Avoidance: Skips trades if both patterns appear in the lookback window, reducing whipsaws.
Multi-Timeframe Trend Filter
15-Minute Alignment: Syncs intrabar trades with 15-minute SMA trends; optional for flexibility.
Dollar-Cost Averaging (DCA) New!
Scaling: Adds up to a set number of entries (e.g., 4) on pullbacks/rallies, spaced by ATR multiples.
Control: Caps exposure and resets on exit, enhancing trend-following potential.
Trade Execution & Risk Management
Entry Rules: Prioritizes moving averages or patterns (user choice), with volume, volatility, and time filters.
Stops & Trails:
Initial Stop: ATR-based (2–3.5x, volatility-adjusted).
Trailing Stop: Locks profits with configurable ATR offset and multiplier.
Discipline
Cooldown: Pauses post-exit (e.g., 0–5 minutes).
Min Hold: Ensures trades last a set number of bars (e.g., 2–10).
Visualization & Tools
Charts: Overlays MAs, stops, and signals; trend shaded in background.
Dashboard: Shows position, P&L, win rate, and more in real-time.
Debugging: Logs signal details for optimization.
Input Parameters
Parameter Purpose Suggested Use
Use RSI Filter - Toggle RSI confirmation *Disable 4 price-only
trading
RSI Length - RSI period (e.g., 14) *7–14 for sensitivity
RSI Overbought/Oversold - Adjust for market type *Set levels (e.g., 60/40)
Use Candlestick Patterns - Enables engulfing signals *Disable for MA focus
Pattern Lookback - Pattern window (e.g., 19) *10–20 bars for balance
Use 15m Trend Filter - Align with 15-min trend *Enable for trend trades
Fast/Slow MA Length - Base MA lengths (e.g., 9/19) *10–25 / 30–60 per
timeframe
Volatility Threshold - Filters volatile spikes *Max ATR/close (e.g., 1%)
Min Volume - Entry volume threshold *Avoid illiquid periods
(e.g., 10)
ATR Length - ATR period (e.g., 14) *Standard volatility
measure
Trailing Stop ATR Offset - Trail distance (e.g., 0.5) *0.5–1.5 for tightness
Trailing Stop ATR Multi - Trail multiplier (e.g., 1.0) *1–3 for trend room
Cooldown Minutes - Post-exit pause (e.g., 0–5) *Prevents overtrading
Min Bars to Hold - Min trade duration (e.g., 2) *5–10 for intraday
Trading Hours - Active window (e.g., 9–16) *Focus on key sessions
Use DCA - Toggle DCA *Enable for scaling
Max DCA Entries - Cap entries (e.g., 4) *Limit risk exposure
DCA ATR Multiplier Entry spacing (e.g., 1.0) *1–2 for wider gaps
Compliance
Realistic Testing: Fixed quantities, capital, and slippage for accurate backtests.
Transparency: All logic is user-visible and adjustable.
Risk Controls: Cooldowns, stops, and hold periods ensure stability.
Flexibility: Adapts to various futures and timeframes.
Summary
DAFE excels in volatile futures markets with adaptive logic, DCA scaling, and robust risk tools. Currently in prop account testing, it’s a powerful framework for precision trading.
Caution
DAFE is experimental, not a profit guarantee. Futures trading risks significant losses due to leverage. Backtest, simulate, and monitor actively before live use. All trading decisions are your responsibility.

Multi-EMA Crossover StrategyMulti-EMA Crossover Strategy
This strategy uses multiple exponential moving average (EMA) crossovers to identify bullish trends and execute long trades. The approach involves progressively stronger signals as different EMA pairs cross, indicating increasing bullish momentum. Each crossover triggers a long entry, and the intensity of bullish sentiment is reflected in the color of the bars on the chart. Conversely, bearish trends are represented by red bars.
Strategy Logic:
First Long Entry: When the 1-day EMA crosses above the 5-day EMA, it signals initial bullish momentum.
Second Long Entry: When the 3-day EMA crosses above the 10-day EMA, it confirms stronger bullish sentiment.
Third Long Entry: When the 5-day EMA crosses above the 20-day EMA, it indicates further trend strength.
Fourth Long Entry: When the 10-day EMA crosses above the 40-day EMA, it suggests robust long-term bullish momentum.
The bar colors reflect these conditions:
More blue bars indicate stronger bullish sentiment as more short-term EMAs are above their longer-term counterparts.
Red bars represent bearish conditions when short-term EMAs are below longer-term ones.
Example: Bitcoin Trading on a Daily Timeframe
Bullish Scenario:
Imagine Bitcoin is trading at $30,000 on March 31, 2025:
First Signal: The 1-day EMA crosses above the 5-day EMA at $30,000. This suggests initial upward momentum, prompting a small long entry.
Second Signal: A few days later, the 3-day EMA crosses above the 10-day EMA at $31,000. This confirms strengthening bullish sentiment; another long position is added.
Third Signal: The 5-day EMA crosses above the 20-day EMA at $32,500, indicating further upward trend development; a third long entry is executed.
Fourth Signal: Finally, the 10-day EMA crosses above the 40-day EMA at $34,000. This signals robust long-term bullish momentum; a fourth long position is entered.
Bearish Scenario:
Suppose Bitcoin reverses from $34,000 to $28,000:
The 1-day EMA crosses below the 5-day EMA at $33,500.
The 3-day EMA dips below the 10-day EMA at $32,000.
The 5-day EMA falls below the 20-day EMA at $30,000.
The final bearish signal occurs when the 10-day EMA drops below the 40-day EMA at $28,000.
The bars turn increasingly red as bearish conditions strengthen.
Advantages of This Strategy:
Progressive Confirmation: Multiple crossovers provide layered confirmation of trend strength.
Visual Feedback: Bar colors help traders quickly assess market sentiment and adjust positions accordingly.
Flexibility: Suitable for trending markets like Bitcoin during strong rallies or downturns.
Limitations:
Lagging Signals: EMAs are lagging indicators and may react slowly to sudden price changes.
False Breakouts: Crossovers in choppy markets can lead to whipsaws or false signals.
This strategy works best in trending markets and should be combined with additional risk management techniques, e.g., stop loss or optimal position sizes (Kelly Criterion).

London Breakout by Edwin KPurpose:
The strategy visualizes breakouts based on price action during the London session. It highlights the candles from 09:59 AM to 01:59 PM UTC+3 with different colors depending on whether the price is above or below the high/low from the 10 AM candle.
Key Parts:
Timestamps:
The code defines specific times for the 09:59 AM candle, 10:00 AM candle, and 01:59 PM UTC+3 times.
The timestamp('UTC+3', ...) function creates the timestamps for those moments.
High and Low of the 10 AM Candle:
The high and low of the 10 AM candle are captured and stored in the ten_am_high and ten_am_low variables.
Bullish and Bearish Conditions:
If the price breaks above (bullish_break) or below (bearish_break) the high or low of the 10 AM candle, respectively.
Bar Coloring:
If the conditions are met (price breaking above or below the 10 AM levels), the script colors the candles during the time frame (09:59 AM to 01:59 PM).
Green color is applied for bullish breakouts.
Red color is applied for bearish breakouts.
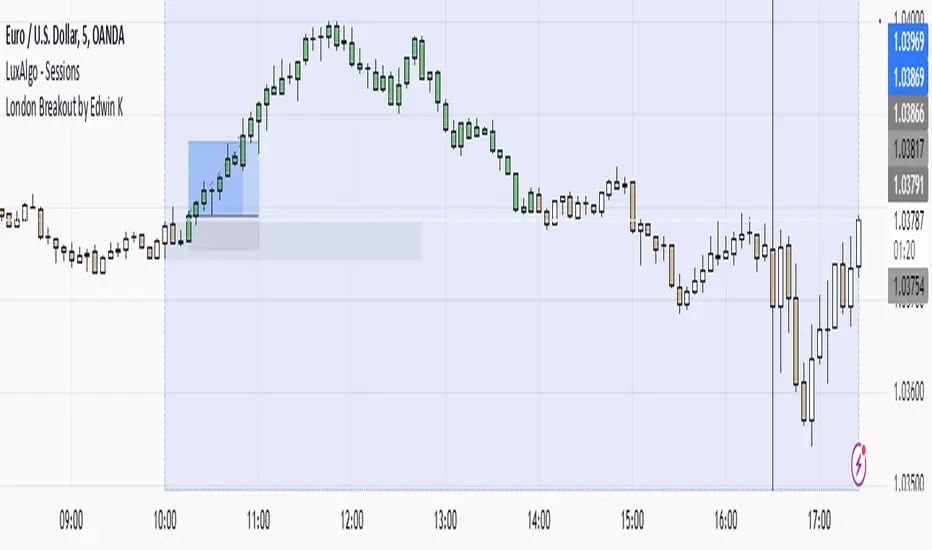
Accurate Bollinger Bands mcbw_ [True Volatility Distribution]The Bollinger Bands have become a very important technical tool for discretionary and algorithmic traders alike over the last decades. It was designed to give traders an edge on the markets by setting probabilistic values to different levels of volatility. However, some of the assumptions that go into its calculations make it unusable for traders who want to get a correct understanding of the volatility that the bands are trying to be used for. Let's go through what the Bollinger Bands are said to show, how their calculations work, the problems in the calculations, and how the current indicator I am presenting today fixes these.
--> If you just want to know how the settings work then skip straight to the end or click on the little (i) symbol next to the values in the indicator settings window when its on your chart <--
--------------------------- What Are Bollinger Bands ---------------------------
The Bollinger Bands were formed in the 1980's, a time when many retail traders interacted with their symbols via physically printed charts and computer memory for personal computer memory was measured in Kb (about a factor of 1 million smaller than today). Bollinger Bands are designed to help a trader or algorithm see the likelihood of price expanding outside of its typical range, the further the lines are from the current price implies the less often they will get hit. With a hands on understanding many strategies use these levels for designated levels of breakout trades or to assist in defining price ranges.
--------------------------- How Bollinger Bands Work ---------------------------
The calculations that go into Bollinger Bands are rather simple. There is a moving average that centers the indicator and an equidistant top band and bottom band are drawn at a fixed width away. The moving average is just a typical moving average (or common variant) that tracks the price action, while the distance to the top and bottom bands is a direct function of recent price volatility. The way that the distance to the bands is calculated is inspired by formulas from statistics. The standard deviation is taken from the candles that go into the moving average and then this is multiplied by a user defined value to set the bands position, I will call this value 'the multiple'. When discussing Bollinger Bands, that trading community at large normally discusses 'the multiple' as a multiplier of the standard deviation as it applies to a normal distribution (gaußian probability). On a normal distribution the number of standard deviations away (which trades directly use as 'the multiple') you are directly corresponds to how likely/unlikely something is to happen:
1 standard deviation equals 68.3%, meaning that the price should stay inside the 1 standard deviation 68.3% of the time and be outside of it 31.7% of the time;
2 standard deviation equals 95.5%, meaning that the price should stay inside the 2 standard deviation 95.5% of the time and be outside of it 4.5% of the time;
3 standard deviation equals 99.7%, meaning that the price should stay inside the 3 standard deviation 99.7% of the time and be outside of it 0.3% of the time.
Therefore when traders set 'the multiple' to 2, they interpret this as meaning that price will not reach there 95.5% of the time.
---------------- The Problem With The Math of Bollinger Bands ----------------
In and of themselves the Bollinger Bands are a great tool, but they have become misconstrued with some incorrect sense of statistical meaning, when they should really just be taken at face value without any further interpretation or implication.
In order to explain this it is going to get a bit technical so I will give a little math background and try to simplify things. First let's review some statistics topics (distributions, percentiles, standard deviations) and then with that understanding explore the incorrect logic of how Bollinger Bands have been interpreted/employed.
---------------- Quick Stats Review ----------------
.
(If you are comfortable with statistics feel free to skip ahead to the next section)
.
-------- I: Probability distributions --------
When you have a lot of data it is helpful to see how many times different results appear in your dataset. To visualize this people use "histograms", which just shows how many times each element appears in the dataset by stacking each of the same elements on top of each other to form a graph. You may be familiar with the bell curve (also called the "normal distribution", which we will be calling it by). The normal distribution histogram looks like a big hump around zero and then drops off super quickly the further you get from it. This shape (the bell curve) is very nice because it has a lot of very nifty mathematical properties and seems to show up in nature all the time. Since it pops up in so many places, society has developed many different shortcuts related to it that speed up all kinds of calculations, including the shortcut that 1 standard deviation = 68.3%, 2 standard deviations = 95.5%, and 3 standard deviations = 99.7% (these only apply to the normal distribution). Despite how handy the normal distribution is and all the shortcuts we have for it are, and how much it shows up in the natural world, there is nothing that forces your specific dataset to look like it. In fact, your data can actually have any possible shape. As we will explore later, economic and financial datasets *rarely* follow the normal distribution.
-------- II: Percentiles --------
After you have made the histogram of your dataset you have built the "probability distribution" of your own dataset that is specific to all the data you have collected. There is a whole complicated framework for how to accurately calculate percentiles but we will dramatically simplify it for our use. The 'percentile' in our case is just the number of data points we are away from the "middle" of the data set (normally just 0). Lets say I took the difference of the daily close of a symbol for the last two weeks, green candles would be positive and red would be negative. In this example my dataset of day by day closing price difference is:
week 1:
week 2:
sorting all of these value into a single dataset I have:
I can separate the positive and negative returns and explore their distributions separately:
negative return distribution =
positive return distribution =
Taking the 25th% percentile of these would just be taking the value that is 25% towards the end of the end of these returns. Or akin the 100%th percentile would just be taking the vale that is 100% at the end of those:
negative return distribution (50%) = -5
positive return distribution (50%) = +4
negative return distribution (100%) = -10
positive return distribution (100%) = +20
Or instead of separating the positive and negative returns we can also look at all of the differences in the daily close as just pure price movement and not account for the direction, in this case we would pool all of the data together by ignoring the negative signs of the negative reruns
combined return distribution =
In this case the 50%th and 100%th percentile of the combined return distribution would be:
combined return distribution (50%) = 4
combined return distribution (100%) = 10
Sometimes taking the positive and negative distributions separately is better than pooling them into a combined distribution for some purposes. Other times the combined distribution is better.
Most financial data has very different distributions for negative returns and positive returns. This is encapsulated in sayings like "Price takes the stairs up and the elevator down".
-------- III: Standard Deviation --------
The formula for the standard deviation (refereed to here by its shorthand 'STDEV') can be intimidating, but going through each of its elements will illuminate what it does. The formula for STDEV is equal to:
square root ( (sum ) / N )
Going back the the dataset that you might have, the variables in the formula above are:
'mean' is the average of your entire dataset
'x' is just representative of a single point in your dataset (one point at a time)
'N' is the total number of things in your dataset.
Going back to the STDEV formula above we can see how each part of it works. Starting with the '(x - mean)' part. What this does is it takes every single point of the dataset and measure how far away it is from the mean of the entire dataset. Taking this value to the power of two: '(x - mean) ^ 2', means that points that are very far away from the dataset mean get 'penalized' twice as much. Points that are very close to the dataset mean are not impacted as much. In practice, this would mean that if your dataset had a bunch of values that were in a wide range but always stayed in that range, this value ('(x - mean) ^ 2') would end up being small. On the other hand, if your dataset was full of the exact same number, but had a couple outliers very far away, this would have a much larger value since the square par of '(x - mean) ^ 2' make them grow massive. Now including the sum part of 'sum ', this just adds up all the of the squared distanced from the dataset mean. Then this is divided by the number of values in the dataset ('N'), and then the square root of that value is taken.
There is nothing inherently special or definitive about the STDEV formula, it is just a tool with extremely widespread use and adoption. As we saw here, all the STDEV formula is really doing is measuring the intensity of the outliers.
--------------------------- Flaws of Bollinger Bands ---------------------------
The largest problem with Bollinger Bands is the assumption that price has a normal distribution. This is assumption is massively incorrect for many reasons that I will try to encapsulate into two points:
Price return do not follow a normal distribution, every single symbol on every single timeframe has is own unique distribution that is specific to only itself. Therefore all the tools, shortcuts, and ideas that we use for normal distributions do not apply to price returns, and since they do not apply here they should not be used. A more general approach is needed that allows each specific symbol on every specific timeframe to be treated uniquely.
The distributions of price returns on the positive and negative side are almost never the same. A more general approach is needed that allows positive and negative returns to be calculated separately.
In addition to the issues of the normal distribution assumption, the standard deviation formula (as shown above in the quick stats review) is essentially just a tame measurement of outliers (a more aggressive form of outlier measurement might be taking the differences to the power of 3 rather than 2). Despite this being a bit of a philosophical question, does the measurement of outlier intensity as defined by the STDEV formula really measure what we want to know as traders when we're experiencing volatility? Or would adjustments to that formula better reflect what we *experience* as volatility when we are actively trading? This is an open ended question that I will leave here, but I wanted to pose this question because it is a key part of what how the Bollinger Bands work that we all assume as a given.
Circling back on the normal distribution assumption, the standard deviation formula used in the calculation of the bands only encompasses the deviation of the candles that go into the moving average and have no knowledge of the historical price action. Therefore the level of the bands may not really reflect how the price action behaves over a longer period of time.
------------ Delivering Factually Accurate Data That Traders Need------------
In light of the problems identified above, this indicator fixes all of these issue and delivers statistically correct information that discretionary and algorithmic traders can use, with truly accurate probabilities. It takes the price action of the last 2,000 candles and builds a huge dataset of distributions that you can directly select your percentiles from. It also allows you to have the positive and negative distributions calculated separately, or if you would like, you can pool all of them together in a combined distribution. In addition to this, there is a wide selection of moving averages directly available in the indicator to choose from.
Hedge funds, quant shops, algo prop firms, and advanced mechanical groups all employ the true return distributions in their work. Now you have access to the same type of data with this indicator, wherein it's doing all the lifting for you.
------------------------------ Indicator Settings ------------------------------
.
---- Moving average ----
Select the type of moving average you would like and its length
---- Bands ----
The percentiles that you enter here will be pulled directly from the return distribution of the last 2,000 candles. With the typical Bollinger Bands, traders would select 2 standard deviations and incorrectly think that the levels it highlights are the 95.5% levels. Now, if you want the true 95.5% level, you can just enter 95.5 into the percentile value here. Each of the three available bands takes the true percentile you enter here.
---- Separate Positive & Negative Distributions----
If this box is checked the positive and negative distributions are treated indecently, completely separate from each other. You will see that the width of the top and bottom bands will be different for each of the percentiles you enter.
If this box is unchecked then all the negative and positive distributions are pooled together. You will notice that the width of the top and bottom bands will be the exact same.
---- Distribution Size ----
This is the number of candles that the price return is calculated over. EG: to collect the price return over the last 33 candles, the difference of price from now to 33 candles ago is calculated for the last 2,000 candles, to build a return distribution of 2000 points of price differences over 33 candles.
NEGATIVE NUMBERS(<0) == exact number of candles to include;
EG: setting this value to -20 will always collect volatility distributions of 20 candles
POSITIVE NUMBERS(>0) == number of candles to include as a multiple of the Moving Average Length value set above;
EG: if the Moving Average Length value is set to 22, setting this value to 2 will use the last 22*2 = 44 candles for the collection of volatility distributions
MORE candles being include will generally make the bands WIDER and their size will change SLOWER over time.
I wish you focus, dedication, and earnest success on your journey.
Happy trading :)

three Supertrend EMA Strategy by Prasanna +DhanuThe indicator described in your Pine Script is a Supertrend EMA Strategy that combines the Supertrend and EMA (Exponential Moving Average) to create a trend-following strategy. Here’s a detailed breakdown of how this indicator works:
1. EMA (Exponential Moving Average):
The EMA is a moving average that places more weight on recent prices, making it more responsive to price changes compared to a simple moving average (SMA). In this strategy, the EMA is used to determine the overall trend direction.
Input Parameter:
ema_length: This is the period for the EMA, set to 50 periods by default. A shorter EMA will respond more quickly to price movements, while a longer EMA is smoother and less sensitive to short-term fluctuations.
How it's used:
If the price is above the EMA, it indicates an uptrend.
If the price is below the EMA, it indicates a downtrend.
2. Supertrend Indicator:
The Supertrend indicator is a trend-following tool based on the Average True Range (ATR), which is a volatility measure. It helps to identify the direction of the trend by setting a dynamic support or resistance level.
Input Parameters:
supertrend_atr_period: The period used for calculating the ATR, set to 10 periods by default.
supertrend_multiplier1: Multiplier for the first Supertrend, set to 3.0.
supertrend_multiplier2: Multiplier for the second Supertrend, set to 2.0.
supertrend_multiplier3: Multiplier for the third Supertrend, set to 1.0.
Each Supertrend line has a different multiplier, which affects its sensitivity to price changes. The ATR period defines how many periods of price data are used to calculate the ATR.
How the Supertrend works:
If the Supertrend value is below the price, the trend is considered bullish (uptrend).
If the Supertrend value is above the price, the trend is considered bearish (downtrend).
The Supertrend will switch between up and down based on price movement and ATR, providing a dynamic trend-following signal.
3. Three Supertrend Lines:
In this strategy, three Supertrend lines are calculated with different multipliers and the same ATR period (10 periods). Each line is more or less sensitive to price changes, and they are plotted on the chart in different colors based on whether the trend is bullish (green) or bearish (red).
Supertrend 1: The most sensitive Supertrend with a multiplier of 3.0.
Supertrend 2: A moderately sensitive Supertrend with a multiplier of 2.0.
Supertrend 3: The least sensitive Supertrend with a multiplier of 1.0.
Each Supertrend line signals a bullish trend when its value is below the price and a bearish trend when its value is above the price.
4. Strategy Rules:
This strategy uses the three Supertrend lines combined with the EMA to generate trade signals.
Entry Conditions:
A long entry is triggered when all three Supertrend lines are in an uptrend (i.e., all three Supertrend lines are below the price), and the price is above the EMA. This suggests a strong bullish market condition.
A short entry is triggered when all three Supertrend lines are in a downtrend (i.e., all three Supertrend lines are above the price), and the price is below the EMA. This suggests a strong bearish market condition.
Exit Conditions:
A long exit occurs when the third Supertrend (the least sensitive one) switches to a downtrend (i.e., the price falls below it).
A short exit occurs when the third Supertrend switches to an uptrend (i.e., the price rises above it).
5. Visualization:
The strategy also plots the following on the chart:
The EMA is plotted as a blue line, which helps identify the overall trend.
The three Supertrend lines are plotted with different colors:
Supertrend 1: Green (for uptrend) and Red (for downtrend).
Supertrend 2: Green (for uptrend) and Red (for downtrend).
Supertrend 3: Green (for uptrend) and Red (for downtrend).
Summary of the Strategy:
The strategy combines three Supertrend indicators (with different multipliers) and an EMA to capture both short-term and long-term trends.
Long positions are entered when all three Supertrend lines are bullish and the price is above the EMA.
Short positions are entered when all three Supertrend lines are bearish and the price is below the EMA.
Exits occur when the third Supertrend line (the least sensitive) signals a change in trend direction.
This combination of indicators allows for a robust trend-following strategy that adapts to both short-term volatility and long-term trend direction. The Supertrend lines provide quick reaction to price changes, while the EMA offers a smoother, more stable trend direction for confirmation.
The indicator described in your Pine Script is a Supertrend EMA Strategy that combines the Supertrend and EMA (Exponential Moving Average) to create a trend-following strategy. Here’s a detailed breakdown of how this indicator works:
1. EMA (Exponential Moving Average):
The EMA is a moving average that places more weight on recent prices, making it more responsive to price changes compared to a simple moving average (SMA). In this strategy, the EMA is used to determine the overall trend direction.
Input Parameter:
ema_length: This is the period for the EMA, set to 50 periods by default. A shorter EMA will respond more quickly to price movements, while a longer EMA is smoother and less sensitive to short-term fluctuations.
How it's used:
If the price is above the EMA, it indicates an uptrend.
If the price is below the EMA, it indicates a downtrend.
2. Supertrend Indicator:
The Supertrend indicator is a trend-following tool based on the Average True Range (ATR), which is a volatility measure. It helps to identify the direction of the trend by setting a dynamic support or resistance level.
Input Parameters:
supertrend_atr_period: The period used for calculating the ATR, set to 10 periods by default.
supertrend_multiplier1: Multiplier for the first Supertrend, set to 3.0.
supertrend_multiplier2: Multiplier for the second Supertrend, set to 2.0.
supertrend_multiplier3: Multiplier for the third Supertrend, set to 1.0.
Each Supertrend line has a different multiplier, which affects its sensitivity to price changes. The ATR period defines how many periods of price data are used to calculate the ATR.
How the Supertrend works:
If the Supertrend value is below the price, the trend is considered bullish (uptrend).
If the Supertrend value is above the price, the trend is considered bearish (downtrend).
The Supertrend will switch between up and down based on price movement and ATR, providing a dynamic trend-following signal.
3. Three Supertrend Lines:
In this strategy, three Supertrend lines are calculated with different multipliers and the same ATR period (10 periods). Each line is more or less sensitive to price changes, and they are plotted on the chart in different colors based on whether the trend is bullish (green) or bearish (red).
Supertrend 1: The most sensitive Supertrend with a multiplier of 3.0.
Supertrend 2: A moderately sensitive Supertrend with a multiplier of 2.0.
Supertrend 3: The least sensitive Supertrend with a multiplier of 1.0.
Each Supertrend line signals a bullish trend when its value is below the price and a bearish trend when its value is above the price.
4. Strategy Rules:
This strategy uses the three Supertrend lines combined with the EMA to generate trade signals.
Entry Conditions:
A long entry is triggered when all three Supertrend lines are in an uptrend (i.e., all three Supertrend lines are below the price), and the price is above the EMA. This suggests a strong bullish market condition.
A short entry is triggered when all three Supertrend lines are in a downtrend (i.e., all three Supertrend lines are above the price), and the price is below the EMA. This suggests a strong bearish market condition.
Exit Conditions:
A long exit occurs when the third Supertrend (the least sensitive one) switches to a downtrend (i.e., the price falls below it).
A short exit occurs when the third Supertrend switches to an uptrend (i.e., the price rises above it).
5. Visualization:
The strategy also plots the following on the chart:
The EMA is plotted as a blue line, which helps identify the overall trend.
The three Supertrend lines are plotted with different colors:
Supertrend 1: Green (for uptrend) and Red (for downtrend).
Supertrend 2: Green (for uptrend) and Red (for downtrend).
Supertrend 3: Green (for uptrend) and Red (for downtrend).
Summary of the Strategy:
The strategy combines three Supertrend indicators (with different multipliers) and an EMA to capture both short-term and long-term trends.
Long positions are entered when all three Supertrend lines are bullish and the price is above the EMA.
Short positions are entered when all three Supertrend lines are bearish and the price is below the EMA.
Exits occur when the third Supertrend line (the least sensitive) signals a change in trend direction.
This combination of indicators allows for a robust trend-following strategy that adapts to both short-term volatility and long-term trend direction. The Supertrend lines provide quick reaction to price changes, while the EMA offers a smoother, more stable trend direction for confirmation.

3 EMA + RSI with Trail Stop [Free990] (LOW TF)This trading strategy combines three Exponential Moving Averages (EMAs) to identify trend direction, uses RSI to signal exit conditions, and applies both a fixed percentage stop-loss and a trailing stop for risk management. It aims to capture momentum when the faster EMAs cross the slower EMA, then uses RSI thresholds, time-based exits, and stops to close trades.
Short Explanation of the Logic
Trend Detection: When the 10 EMA crosses above the 20 EMA and both are above the 100 EMA (and the current price bar closes higher), it triggers a long entry signal. The reverse happens for a short (the 10 EMA crosses below the 20 EMA and both are below the 100 EMA).
RSI Exit: RSI crossing above a set threshold closes long trades; crossing below another threshold closes short trades.
Time-Based Exit: If a trade is in profit after a set number of bars, the strategy closes it.
Stop-Loss & Trailing Stop: A fixed stop-loss based on a percentage from the entry price guards against large drawdowns. A trailing stop dynamically tightens as the trade moves in favor, locking in potential gains.
Detailed Explanation of the Strategy Logic
Exponential Moving Average (EMA) Setup
Short EMA (out_a, length=10)
Medium EMA (out_b, length=20)
Long EMA (out_c, length=100)
The code calculates three separate EMAs to gauge short-term, medium-term, and longer-term trend behavior. By comparing their relative positions, the strategy infers whether the market is bullish (EMAs stacked positively) or bearish (EMAs stacked negatively).
Entry Conditions
Long Entry (entryLong): Occurs when:
The short EMA (10) crosses above the medium EMA (20).
Both EMAs (short and medium) are above the long EMA (100).
The current bar closes higher than it opened (close > open).
This suggests that momentum is shifting to the upside (short-term EMAs crossing up and price action turning bullish). If there’s an existing short position, it’s closed first before opening a new long.
Short Entry (entryShort): Occurs when:
The short EMA (10) crosses below the medium EMA (20).
Both EMAs (short and medium) are below the long EMA (100).
The current bar closes lower than it opened (close < open).
This indicates a potential shift to the downside. If there’s an existing long position, that gets closed first before opening a new short.
Exit Signals
RSI-Based Exits:
For long trades: When RSI exceeds a specified threshold (e.g., 70 by default), it triggers a long exit. RSI > short_rsi generally means overbought conditions, so the strategy exits to lock in profits or avoid a pullback.
For short trades: When RSI dips below a specified threshold (e.g., 30 by default), it triggers a short exit. RSI < long_rsi indicates oversold conditions, so the strategy closes the short to avoid a bounce.
Time-Based Exit:
If the trade has been open for xBars bars (configurable, e.g., 24 bars) and the trade is in profit (current price above entry for a long, or current price below entry for a short), the strategy closes the position. This helps lock in gains if the move takes too long or momentum stalls.
Stop-Loss Management
Fixed Stop-Loss (% Based): Each trade has a fixed stop-loss calculated as a percentage from the average entry price.
For long positions, the stop-loss is set below the entry price by a user-defined percentage (fixStopLossPerc).
For short positions, the stop-loss is set above the entry price by the same percentage.
This mechanism prevents catastrophic losses if the market moves strongly against the position.
Trailing Stop:
The strategy also sets a trail stop using trail_points (the distance in price points) and trail_offset (how quickly the stop “catches up” to price).
As the market moves in favor of the trade, the trailing stop gradually tightens, allowing profits to run while still capping potential drawdowns if the price reverses.
Order Execution Flow
When the conditions for a new position (long or short) are triggered, the strategy first checks if there’s an opposite position open. If there is, it closes that position before opening the new one (prevents going “both long and short” simultaneously).
RSI-based and time-based exits are checked on each bar. If triggered, the position is closed.
If the position remains open, the fixed stop-loss and trailing stop remain in effect until the position is exited.
Why This Combination Works
Multiple EMA Cross: Combining 10, 20, and 100 EMAs balances short-term momentum detection with a longer-term trend filter. This reduces false signals that can occur if you only look at a single crossover without considering the broader trend.
RSI Exits: RSI provides a momentum oscillator view—helpful for detecting overbought/oversold conditions, acting as an extra confirmation to exit.
Time-Based Exit: Prevents “lingering trades.” If the position is in profit but failing to advance further, it takes profit rather than risking a trend reversal.
Fixed & Trailing Stop-Loss: The fixed stop-loss is your safety net to cap worst-case losses. The trailing stop allows the strategy to lock in gains by following the trade as it moves favorably, thus maximizing profit potential while keeping risk in check.
Overall, this approach tries to capture momentum from EMA crossovers, protect profits with trailing stops, and limit risk through both a fixed percentage stop-loss and exit signals from RSI/time-based logic.

Daily Moving Average for Intraday TimeframesThis indicator provides a dynamic tool for visualizing the Daily Moving Average (DMA) on intraday timeframes.
It allows you to analyze how the price behaves in relation to the daily moving average in timeframes from 1 minute up to 1 day.
KEY FEATURES
DMA on Intraday timeframes only : This indicator is designed to work exclusively on intraday charts with timeframes between 1 minute and 1 day. It will not function on tick, second-based, or daily-and-above charts.
Color-Coded Zones for Trend Identification :
Green Zone: The price is above a rising DMA, signaling a bullish momentum.
Red Zone: The price is below a falling DMA, signaling a bearish momentum.
Yellow Zone: Signaling uncertainty or mixed conditions, where either the price is above a falling DMA or below a rising/flat DMA.
Configurable DMA Period : You can adjust the number of days over which the DMA is calculated (default is 5 days). This can be customized based on your trading strategy or market preferences.
24/7 Market Option : For assets that trade continuously (e.g., cryptocurrencies), activate the "Is trading 24/7?" setting to ensure accurate calculations.
WHAT IS THE DMA AND WHY USE IT INTRADAY?
The Daily Moving Average is a Simple Moving Average indicator used to smooth out price fluctuations over a specified period (in days) and reveal the underlying trend.
Typically, a SMA takes price value for the current timeframe and reveal the trend for this timeframe. It gives you the average price for the last N candles for the given timeframe.
But what makes the Intraday DMA interesting is that it shows the underlying trend of the Daily timeframe on a chart set on a shorter timeframe . This helps to align intraday trades with broader market movements.
HOW IS THE DMA CALCULATED?
If we are to build a N-day Daily Moving Average using a Simple Moving Average, we need to take the amount of candles A needed in that timeframe to account for a period of a day and multiply it by the number of days N of the desired DMA.
So for instance, let say we want to compute the 5-Day DMA on the 10 minute timeframe :
In the 10 minute timeframe there are 39 candles in a day in the regular session.
We would take the 39 candles per day and then multiply that by 5 days. 39 x 5 = 195.
So a 5-day moving average is represented by a simple moving average with a period of 195 when looking at a 10 minute timeframe.
So for each period, to create a 5-day DMA, you would have to set the period of your simple moving average like so :
- 195 minutes = 10 period
- 130 minutes = 15 period
- 65 minutes = 30 period
- 30 minutes = 65 period
- 15 minutes = 130 period
- 10 minutes = 195 period
- 5 minutes = 390 period
and so on.
This indicator attempts to do this calculation for you on any intraday timeframe and whatever the period you want to use is for your DMA. You can create a 10-day moving average, a 30-day moving average, etc.

Correlation Clusters [LuxAlgo]The Correlation Clusters is a machine learning tool that allows traders to group sets of tickers with a similar correlation coefficient to a user-set reference ticker.
The tool calculates the correlation coefficients between 10 user-set tickers and a user-set reference ticker, with the possibility of forming up to 10 clusters.
🔶 USAGE
Applying clustering methods to correlation analysis allows traders to quickly identify which set of tickers are correlated with a reference ticker, rather than having to look at them one by one or using a more tedious approach such as correlation matrices.
Tickers belonging to a cluster may also be more likely to have a higher mutual correlation. The image above shows the detailed parts of the Correlation Clusters tool.
The correlation coefficient between two assets allows traders to see how these assets behave in relation to each other. It can take values between +1.0 and -1.0 with the following meaning
Value near +1.0: Both assets behave in a similar way, moving up or down at the same time
Value close to 0.0: No correlation, both assets behave independently
Value near -1.0: Both assets have opposite behavior when one moves up the other moves down, and vice versa
There is a wide range of trading strategies that make use of correlation coefficients between assets, some examples are:
Pair Trading: Traders may wish to take advantage of divergences in the price movements of highly positively correlated assets; even highly positively correlated assets do not always move in the same direction; when assets with a correlation close to +1.0 diverge in their behavior, traders may see this as an opportunity to buy one and sell the other in the expectation that the assets will return to the likely same price behavior.
Sector rotation: Traders may want to favor some sectors that are expected to perform in the next cycle, tracking the correlation between different sectors and between the sector and the overall market.
Diversification: Traders can aim to have a diversified portfolio of uncorrelated assets. From a risk management perspective, it is useful to know the correlation between the assets in your portfolio, if you hold equal positions in positively correlated assets, your risk is tilted in the same direction, so if the assets move against you, your risk is doubled. You can avoid this increased risk by choosing uncorrelated assets so that they move independently.
Hedging: Traders may want to hedge positions with correlated assets, from a hedging perspective, if you are long an asset, you can hedge going long a negatively correlated asset or going short a positively correlated asset.
Grouping different assets with similar behavior can be very helpful to traders to avoid over-exposure to those assets, traders may have multiple long positions on different assets as a way of minimizing overall risk when in reality if those assets are part of the same cluster traders are maximizing their risk by taking positions on assets with the same behavior.
As a rule of thumb, a trader can minimize risk via diversification by taking positions on assets with no correlations, the proposed tool can effectively show a set of uncorrelated candidates from the reference ticker if one or more clusters centroids are located near 0.
🔶 DETAILS
K-means clustering is a popular machine-learning algorithm that finds observations in a data set that are similar to each other and places them in a group.
The process starts by randomly assigning each data point to an initial group and calculating the centroid for each. A centroid is the center of the group. K-means clustering forms the groups in such a way that the variances between the data points and the centroid of the cluster are minimized.
It's an unsupervised method because it starts without labels and then forms and labels groups itself.
🔹 Execution Window
In the image above we can see how different execution windows provide different correlation coefficients, informing traders of the different behavior of the same assets over different time periods.
Users can filter the data used to calculate correlations by number of bars, by time, or not at all, using all available data. For example, if the chart timeframe is 15m, traders may want to know how different assets behave over the last 7 days (one week), or for an hourly chart set an execution window of one month, or one year for a daily chart. The default setting is to use data from the last 50 bars.
🔹 Clusters
On this graph, we can see different clusters for the same data. The clusters are identified by different colors and the dotted lines show the centroids of each cluster.
Traders can select up to 10 clusters, however, do note that selecting 10 clusters can lead to only 4 or 5 returned clusters, this is caused by the machine learning algorithm not detecting any more data points deviating from already detected clusters.
Traders can fine-tune the algorithm by changing the 'Cluster Threshold' and 'Max Iterations' settings, but if you are not familiar with them we advise you not to change these settings, the defaults can work fine for the application of this tool.
🔹 Correlations
Different correlations mean different behaviors respecting the same asset, as we can see in the chart above.
All correlations are found against the same asset, traders can use the chart ticker or manually set one of their choices from the settings panel. Then they can select the 10 tickers to be used to find the correlation coefficients, which can be useful to analyze how different types of assets behave against the same asset.
🔶 SETTINGS
Execution Window Mode: Choose how the tool collects data, filter data by number of bars, time, or no filtering at all, using all available data.
Execute on Last X Bars: Number of bars for data collection when the 'Bars' execution window mode is active.
Execute on Last: Time window for data collection when the `Time` execution window mode is active. These are full periods, so `Day` means the last 24 hours, `Week` means the last 7 days, and so on.
🔹 Clusters
Number of Clusters: Number of clusters to detect up to 10. Only clusters with data points are displayed.
Cluster Threshold: Number used to compare a new centroid within the same cluster. The lower the number, the more accurate the centroid will be.
Max Iterations: Maximum number of calculations to detect a cluster. A high value may lead to a timeout runtime error (loop takes too long).
🔹 Ticker of Reference
Use Chart Ticker as Reference: Enable/disable the use of the current chart ticker to get the correlation against all other tickers selected by the user.
Custom Ticker: Custom ticker to get the correlation against all the other tickers selected by the user.
🔹 Correlation Tickers
Select the 10 tickers for which you wish to obtain the correlation against the reference ticker.
🔹 Style
Text Size: Select the size of the text to be displayed.
Display Size: Select the size of the correlation chart to be displayed, up to 500 bars.
Box Height: Select the height of the boxes to be displayed. A high height will cause overlapping if the boxes are close together.
Clusters Colors: Choose a custom colour for each cluster.

EMAs for D W M TimeframesEMAs for D W M Timeframes
Description:
The “EMAs for D W M Timeframes” indicator allows users to set specific Exponential Moving Averages (EMAs) for Daily, Weekly, and Monthly timeframes. The script utilizes these user-defined EMA settings based on the chart’s current timeframe, ensuring that the appropriate EMAs are always displayed.
Please note that for timeframes other than specified, it defaults to daily EMA values.
EMA : The Exponential Moving Average (EMA) is a type of moving average that places greater weight and significance on the most recent data points. This makes the EMA more responsive to recent price changes compared to a simple moving average (SMA), making it a popular tool for identifying trends in financial markets.
Features:
Daily and Default EMAs: Users can specify two EMAs for the Daily timeframe, which also act as the default EMAs for any unspecified timeframe. The default values are set to 10 and 20.
Weekly EMAs: For Weekly charts, the indicator plots two EMAs with default values of 10 and 30. These EMAs help in tracking medium-term trends.
Monthly EMAs: On Monthly charts, the indicator plots EMAs with default values of 5 and 10, providing insights into long-term trends.
Timeframe-Based Display: The indicator automatically uses the EMA settings corresponding to the current chart’s timeframe, whether it is Daily, Weekly, or Monthly.
If the chart is set to any other timeframe, the Daily EMA settings are used by default.
How to Use:
Inputs:
* Daily and Default EMA 1 & 2: Adjust the values for the short-term and long-term EMAs on the Daily chart, which are also used for any other unspecified timeframe.
* Weekly EMA 1 & 2: Set the values for the EMAs that will be shown on Weekly charts.
* Monthly EMA 1 & 2: Specify the values for the EMAs to be displayed on Monthly charts.
Visualization:
* Depending on the current chart timeframe, the script will automatically display the relevant EMAs.
Default Values:
* Daily and Default EMAs: 10 (EMA 1), 20 (EMA 2)
* Weekly EMAs: 10 (EMA 1), 30 (EMA 2)
* Monthly EMAs: 5 (EMA 1), 10 (EMA 2)
This indicator is designed for users who want to monitor EMAs across different timeframes, using specific settings for Daily, Weekly, and Monthly charts.
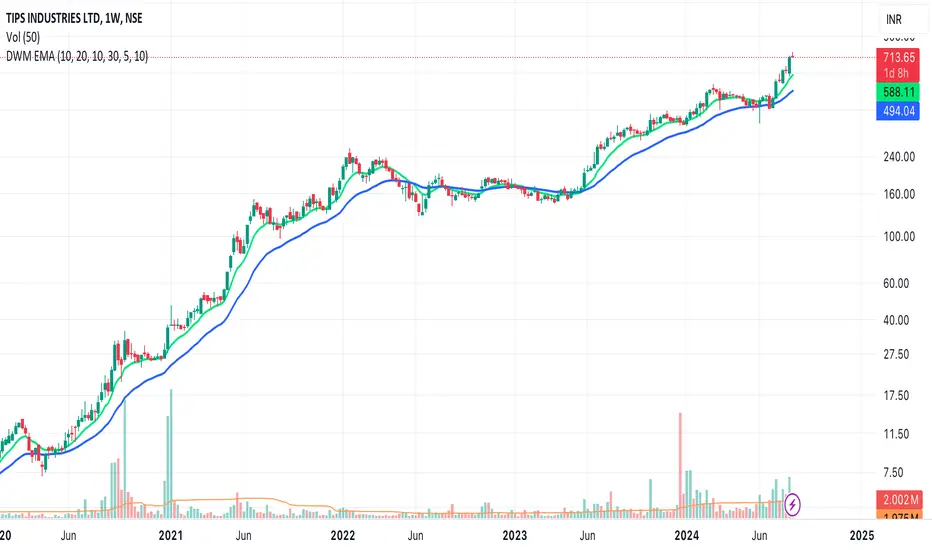
[2024] Inverted Yield CurveInverted Yield Curve Indicator
Overview:
The Inverted Yield Curve Indicator is a powerful tool designed to monitor and analyze the yield spread between the 10-year and 2-year US Treasury rates. This indicator helps traders and investors identify periods of yield curve inversion, which historically have been reliable predictors of economic recessions.
Key Features:
Yield Spread Calculation: Accurately calculates the spread between the 10-year and 2-year Treasury yields.
Visual Representation: Plots the yield spread on the chart, with clear visualization of positive and negative spreads.
Inversion Highlighting: Background shading highlights periods where the yield curve is inverted (negative spread), making it easy to spot critical economic signals.
Alerts: Customizable alerts notify users when the yield curve inverts, allowing timely decision-making.
Customizable Yield Plots: Users can choose to display the individual 2-year and 10-year yields for detailed analysis.
How It Works:
Data Sources: Utilizes the Federal Reserve Economic Data (FRED) for fetching the 2-year and 10-year Treasury yield rates.
Spread Calculation: The script calculates the difference between the 10-year and 2-year yields.
Visualization: The spread is plotted as a blue line, with a grey zero line for reference. When the spread turns negative, the background turns red to indicate an inversion.
Customizable Plots: Users can enable or disable the display of individual 2-year and 10-year yields through simple input options.
Usage:
Economic Analysis: Use this indicator to anticipate potential economic downturns by monitoring yield curve inversions.
Market Timing: Identify periods of economic uncertainty and adjust your investment strategies accordingly.
Alert System: Set alerts to receive notifications whenever the yield curve inverts, ensuring you never miss crucial economic signals.
Important Notes:
Data Accuracy: Ensure that the FRED data symbols (FRED
and FRED
) are correctly referenced and available in your TradingView environment.
Customizations: The script is designed to be flexible, allowing users to customize plot colors and alert settings to fit their preferences.
Disclaimer:
This indicator is intended for educational and informational purposes only. It should not be considered as financial advice. Always conduct your own research and consult with a financial advisor before making investment decisions.
