[blackcat] L2 Eyman OscillatorLevel 2
Background
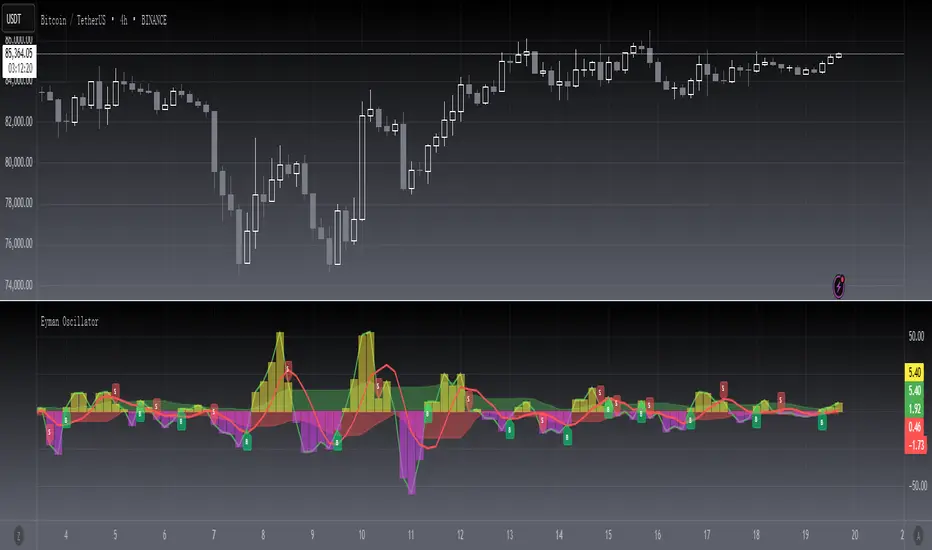
Eyman Oscillator
Function
The Eyman oscillator is also an analytical indicator derived from the moving average principle, which reflects the deviation between the current price and the average price over a period of time. According to the principle of moving average, the price trend can be inferred from the value of OSC. If it is far from the average, it is likely to return to the average. OSC calculation formula: Take 10-day OSC as an example: OSC = closing price of the day - 10-day average price Parameter setting: The period of the OSC indicator is generally 10 days; the average number of days of the OSC indicator can be set, and the average line of the OSC indicator can also be displayed. OSC judgment method: Take the ten-day OSC as an example: 1. The oscillator takes 0 as the center line, the OSC is above the zero line, and the market is in a strong position; if the OSC is below the zero line, the market is in a weak position. 2. OSC crosses the zero line. When the line is up, the market is strengthening, which can be regarded as a buy signal. On the contrary, if OSC falls below the zero line and continues to go down, the market is weak, and you should pay attention to selling. The degree to which the OSC value is far away should be judged based on experience.
Remarks
This is a Level 2 free and open source indicator.
Feedbacks are appreciated.
Cari dalam skrip untuk "10年期国债+交易单位+价格"
MTF Stochastic ScannerThis Stochastic scanner can be use to identify overbought and oversold of 10 symbols over multiple timeframes
it will give you a quick overview which pair is more overbough or more oversold and also signals tops and bottoms in the AVG row
light red/green cell = weak bearish (Stoch = 30-20) / bullish (Stoch = 70-80)
medium red/green cell = bearish (Stoch = 20-10) / bullish (Stoch = 80-90)
dark red/green cell = strong bearish (Stoch <= 10) / bullish (Stoch >= 90)
gray cell = neutral (Stoch = 30-70)
Usage
If AVG (average of all 4 timeframes) falls below 20, the cell will get green, indicating a good time to enter long (buy)
If AVG (average of all 4 timeframes) rises above 80, the cell will get red, indicating a good time to enter short (sell)
Use the "MTF Stochastic Scanner" in combination with the " MTF RSI Scanner "
to find tops (RSI MTF avg >=70 AND Stochastic MTF avg >= 80)
or bottoms (RSI MTF avg <= 30 AND Stochastic MTF avg <= 20)
Here is how the two MTF scanners looked on Nov 08 2021 (ATH) »
and here how the MTF scanners looked on June 21 2022
use TradingViews Replay function to check how it would have worked in the past and when not.
As always… there NOT a single indicator that can show to the top & bottom 100% every single time. So use with caution, with other indicators and/or deeper understanding of technicals analysis ☝️☝️☝️
Settings
You can change the timeframes, symbols, Stochastic settings, overbought/oversold levels and colors to your liking
Drag the table onto the price chart, if you want to use it as an overlay.
NOTE:
Because of the 4x10 security requests, it can take up to 1 minute for changed settings to take effect! Please be patient 🙃
If you have any idea on how to optimise the code, please feel free to share 🙏
*** Inspired by "Binance CHOP Dashboard" from @Cazimiro and "RSI MTF Table" from @mobester16 ***

SMT Pair (Nephew_Sam_)// This source code is subject to the terms of the Mozilla Public License 2.0 at mozilla.org
// © Nephew_Sam_
--------------------------------------------------------------
This code for version is entirely different from the previous two SMT divergence indicators that I had published in terms of effeciency.
There is an option to have upto 10 custom pairs and 1 default pair (if outside the 10) for your SMT/correlated pair.
The divergence lines are not perfect and is still under development.
--------------------------------------------------------------
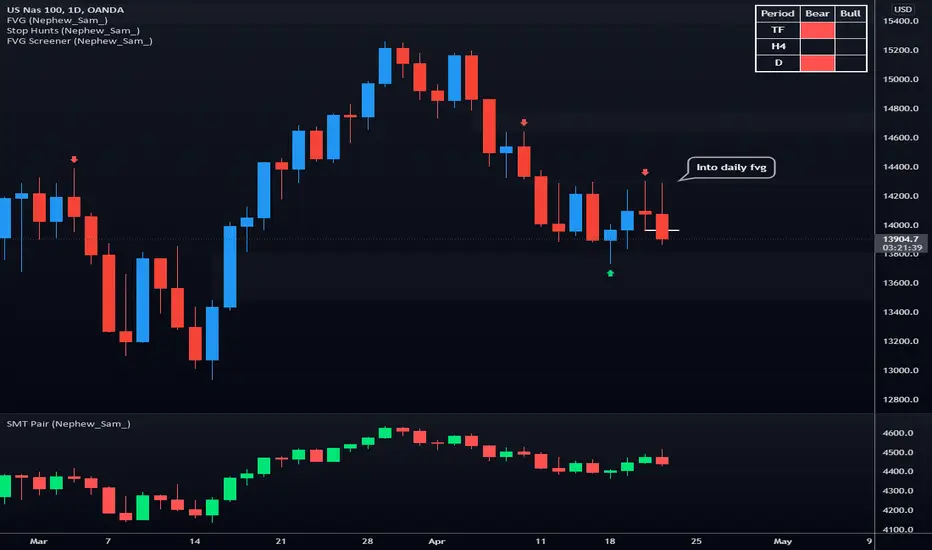
This indicator shows a secondary SMT/correlated pair at them bottom pane as a line or bar chart and draws lines if there are any divergences between the primary and secondary pair.
ie .
GBPUSD - EURUSD
EURUSD - DXY (inversed)
XAUUSD - XAGUSD
Options:
1. Show the secondary pair in lines or candlesticks
2. Divergences between pivot points (I'm yet to implement last pivot to live price)
3. Set 10 primary-smt pairs + a default pair for every other.
4. For every pair there is an option to inverse the price of the smt pair
(Hover over the tips in the indicator settings to learn more)
TASC 2022.05 Relative Strength Exponential Moving Average█ OVERVIEW
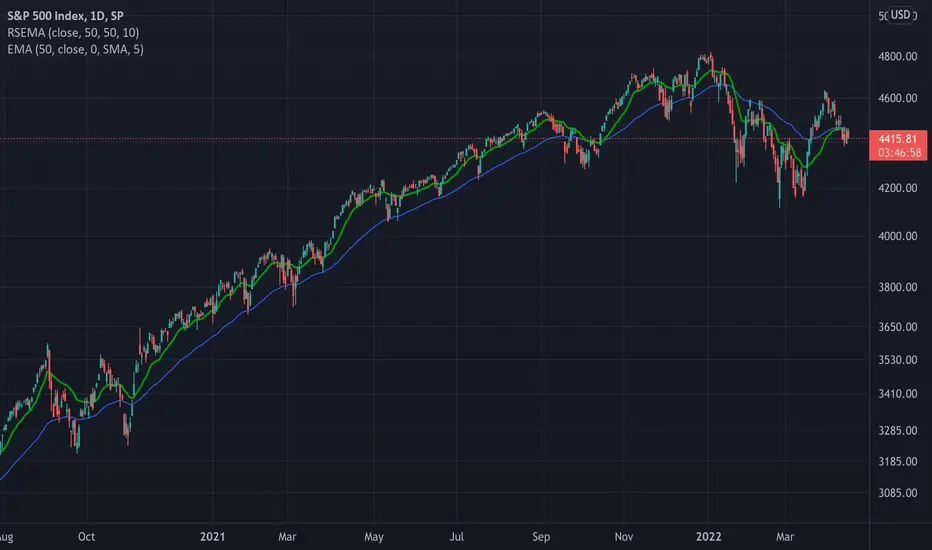
TASC's May 2022 edition Traders' Tips includes the "Relative Strength Moving Averages" article authored by Vitali Apirine. This is the code implementing the Relative Strength Exponential Moving Average (RS EMA) indicator introduced in this publication.
█ CONCEPTS
RS EMA is an adaptive trend-following indicator with reduced lag characteristics. By design, this was made possible by harnessing the relative strength of price. It operates in a similar fashion to a traditional EMA, but it has an improved response to price fluctuations. In a trading strategy, RS EMA can be used in conjunction with an EMA of the same length to identify the overall trend (see the preview chart). Alternatively, RS EMAs with different lengths can define turning points and filter price movements.
RS EMA is an adaptive trend-following indicator with reduced lag characteristics. By design, this was made possible by harnessing the relative strength of price. It operates in a similar fashion to a traditional EMA, but it has an improved response to price fluctuations.
█ CALCULATIONS
The following steps are used in the calculation process:
• Calculate the relative strength (RS) of a given length.
• Multiply RS by a chosen coefficient (multiplier) to adapt the EMA filtering the original time series. Calculate the EMA of the resulting time series.
The author recommends RS EMA(10,10,10) as typical settings, where the first parameter is the EMA length, the second parameter is the RS length, and the third parameter is the RS multiplier. Other values may be substituted depending on your trading style and goals.
Binance CHOP Dashboard by KziHere is a Dashboard to find the opportunuty of bigs moves with 20 pairs.
The Dashboard is too big for the phone view. I thinks we can use it only on computer view.
How it's work ?
I look for the CHOP on Weekly and Daily time frame
The CHOP give the "tension" of the pair.
So i look for the biggest "tension" to take the "big mooves"
I look for the align tension between weekly and daily
The CHOP can be 0 to 100 , the result is:
(Weeky CHOP x Daily CHOP) = 0 to 10 000
To make the result easy to read, i divide so that the "note" is between 0 and 10.
If you have more than 3 /10 = RED => HOT Opporunity for big mooves
If you have less than 1/10 = BLUE => COLD opporunity
Thanks for your comment,
Kzi
The code is well.
But i think there is an opportunity to do it better with some for loop.
Is some of you do it, please let's me know.

VIX Cheat SheetHello!
This indicator - "VIX Cheat Sheet" - performs several calculations for $VIX against the asset on your chart. However, using $VIX as a risk proxy or volatility metric often fails beyond large-cap U.S equities. To remedy this, the VixFix indicator is included in the script; you can select whether the script performs calculations for an asset against $VIX or against VixFix (i.e. Forex, Crypto)
Measured are: $VIX correlation to an asset's price fluctuations, the average close-to-close gain/loss subsequent a $VIX/VixFix close above the upper Bollinger Band, the average 5-session gain/loss following the same occurrence in addition to the average 10-session gain/loss, all close-to-close, 5 session, and 10-session gains/losses are stored as tooltips for labels on the chart. The current close-to-close percentage gain/loss for $VIX and VixFix are displayed on the chart.
Displayed in the example image is a box incorporating $VIX price data alongside an upper Bollinger Band and lower Bollinger Band. The data isn't cast to its own price scale but is helpful for quick interpretation of $VIX fluctuations. You can select to plot VixFix data in the box in the user inputs table.
Displayed in the second example image is a semi-transparent blue box encompassing all price moves that occurred when $VIX measured above $40 for at least ten consecutive sessions. The largest percentage close-to-close loss is displayed below the box.
Also illustrated is a red label that appears when $VIX or VixFix closes above the upper Bollinger Band. The indicator will calculate and display the performance of the asset for the subsequent 10 sessions, to which the red label will disappear and all data stored as a tooltip in the blue labels stating "VIX Closed Above Upper Band" or "VixFix Closed Above Upper Band".
To reduce chart clutter, a label and line combination marking all $VIX closes above the upper Bollinger Band was not included. Instead, bar color changes were added. When "$VIX" is selected in the user inputs table the indicator will mark all sessions in which $VIX closed above the upper band as blue, in addition to plotting $VIX price data in the dynamic black box. When "VixFix" is selected, the indicator will mark all sessions where VixFix closed above the upper band as purple; the VixFix indicator will be plotted in the black box.
Be sure to hover over labels to access tooltip information; try the indicator with bar replay!

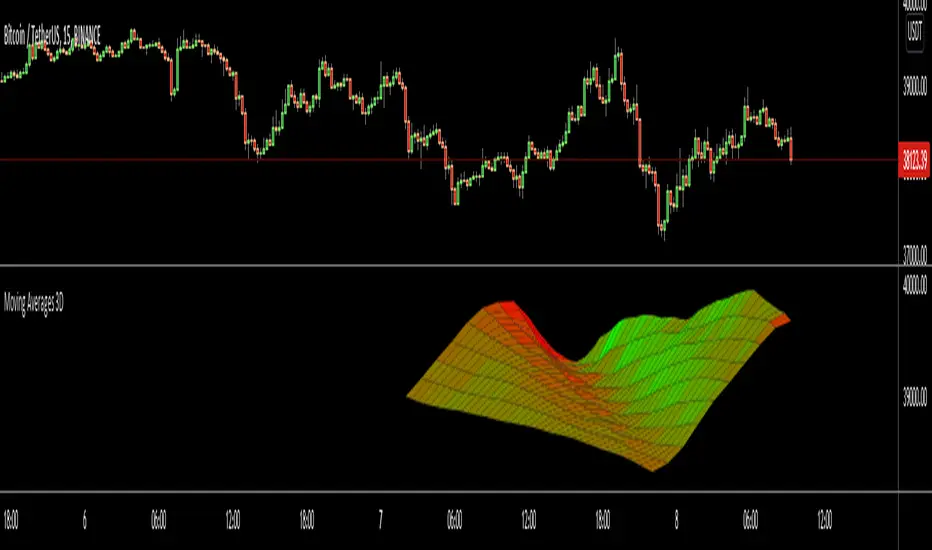
Moving Averages 3DHello All,
This is an experimental work to show 10 moving averages in 3D by using linefill.new() feature of the Pine language.
You can set moving average type as Simple (SMA) or Exponential (EMA)
You can set "Starting Length" and set the "Step" to calculate other lengths. For example; if "Starting Length" is 10 and "step" is 5 then the lengths are 10, 15, 20, 25...
You can set the colors as Red, Green, Blue for each direction. And you can change the width. you can see the examples below
In following example Green and Blue used:
In following example Blue and Red is used and Width is set as 5:
Enjoy!
Multi-Timeframe (MTF) Dashboard by RiTzMulti-Timeframe Dashboard
Shows values of different Indiactors on Multiple-Timeframes for the selected script/symbol
VWAP : if LTP is trading above VWAP then Bullish else if LTP is trading below VWAP then Bearish.
ST(21,1) : if LTP is trading above Supertrend (21,1) then Bullish , else if LTP is trading below Supertrend (21,1) then Bearish.
ST(14,2) : if LTP is trading above Supertrend (14,2) then Bullish , else if LTP is trading below Supertrend (14,2) then Bearish.
ST(10,3) : if LTP is trading above Supertrend (10,3) then Bullish , else if LTP is trading below Supertrend (10,3) then Bearish.
RSI(14) : Shows value of RSI (14) for the current timeframe.
ADX : if ADX is > 75 and DI+ > DI- then "Bullish ++".
if ADX is < 75 but >50 and DI+ > DI- then "Bullish +".
if ADX is < 50 but > 25 and DI+ > DI- then "Bullish".
if ADX is above 75 and DI- > DI+ then "Bearish ++".
if ADX is < 75 but > 50 and DI- > DI+ then "Bearish+".
if ADX is < 50 but > 25 and DI- > DI+ then "Bearish".
if ADX is < 25 then "Neutral".
MACD : if MACD line is above Signal Line then "Bullish", else if MACD line is below Signal Line then "Bearish".
PH-PL : "< PH > PL" means LTP is trading between Previous Timeframes High(PH) & Previous Timeframes Low(PL) which indicates Rangebound-ness.
"> PH" means LTP is trading above Previous Timeframes High(PH) which indicates Bullish-ness.
"< PL" means LTP is trading below Previous Timeframes Low(PL) which indicates Bearish-ness.
Alligator : If Lips > Teeth > Jaw then Bullish.
If Lips < Teeth < Jaw then Bearish.
If Lips > Teeth and Teeth < Jaw then Neutral/Sleeping.
If Lips < Teeth and Teeth > Jaw then Neutral/Sleeping.
Settings :
Style settings :-
Dashboard Location: Location of the dashboard on the chart
Dashboard Size: Size of the dashboard on the chart
Bullish Cell Color: Select the color of cell whose value is showing Bullish-ness.
Bearish Cell Color: Select the color of cell whose value is showing Bearish-ness.
Neutral Cell Color: Select the color of cell whose value is showing Rangebound-ness.
Cell Transparency: Select Transparency of cell.
Column Settings :-
You can select which Indicators values should be displayed/hidden.
Timeframe Settings :-
You can select which timeframes values should be displayed/hidden.
Note :- I'm not a pro Developer/Coder , so if there are any mistakes or any suggestions for improvements in the code then do let me know!
Note :- Use in Live market , might show wrong values for timeframes other than current timeframe in closed market!!

Nifty / Banknifty Dashboard by RiTzNifty / Banknifty Dashboard :
Shows Values of different Indicators on current Timeframe for the selected Index & it's main constituents according to weightage in index.
customized for Nifty & Banknifty (You can customize it according to your needs for the markets/indexes you trade in)
Interpretation :-
VWAP : if LTP is trading above VWAP then Bullish else if LTP is trading below VWAP then Bearish.
ST(21,1) : if LTP is trading above Supertrend (21,1) then Bullish , else if LTP is trading below Supertrend (21,1) then Bearish.
ST(14,2) : if LTP is trading above Supertrend (14,2) then Bullish , else if LTP is trading below Supertrend (14,2) then Bearish.
ST(10,3) : if LTP is trading above Supertrend (10,3) then Bullish , else if LTP is trading below Supertrend (10,3) then Bearish.
RSI(14) : Shows value of RSI (14) for the current timeframe.
ADX : if ADX is > 75 and DI+ > DI- then "Bullish ++".
if ADX is < 75 but >50 and DI+ > DI- then "Bullish +".
if ADX is < 50 but > 25 and DI+ > DI- then "Bullish".
if ADX is above 75 and DI- > DI+ then "Bearish ++".
if ADX is < 75 but > 50 and DI- > DI+ then "Bearish+".
if ADX is < 50 but > 25 and DI- > DI+ then "Bearish".
if ADX is < 25 then "Neutral".
MACD : if MACD line is above Signal Line then "Bullish", else if MACD line is below Signal Line then "Bearish".
PDH-PDL : "< PDH > PDL" means LTP is trading between Previous Days High(PDH) & Previous Days Low(PDL) which indicates Rangebound-ness.
"> PDH" means LTP is trading above Previous Days High(PDH) which indicates Bullish-ness.
"< PDL" means LTP is trading below Previous Days Low(PDL) which indicates Bearish-ness.
Alligator : If Lips > Teeth > Jaw then Bullish.
If Lips < Teeth < Jaw then Bearish.
If Lips > Teeth and Teeth < Jaw then Neutral/Sleeping.
If Lips < Teeth and Teeth > Jaw then Neutral/Sleeping.
Settings :
Style settings :-
Dashboard Location: Location of the dashboard on the chart
Dashboard Size: Size of the dashboard on the chart
Bullish Cell Color: Select the color of cell whose value is showing Bullish-ness.
Bearish Cell Color: Select the color of cell whose value is showing Bearish-ness.
Neutral Cell Color: Select the color of cell whose value is showing Rangebound-ness.
Cell Transparency: Select Transparency of cell.
Columns Settings :-
You can select which Indicators values should be displayed/hidden.
Rows Settings :-
You can select which Stocks/Symbols values should be displayed/hidden.
Symbol Settings :-
Here you can select the Index & Stocks/Symbols
Dashboard for Index : select Nifty/Banknifty
if you select Nifty then Nifty spot, Nifty current Futures and the stocks with most weightage in Nifty index will be displayed on the Dashboard/Table.
if you select Banknifty then Banknifty spot, Banknifty current Futures and the stocks with most weightage in Banknifty index will be displayed on the Dashboard/Table.
You can Customise it according to your needs, you can choose any Symbols you want to use.
Note :- This is inspired from "RankDelta" by AsitPati and "Nifty and Bank Nifty Dashboard v2" by cvsk123 (Both these scripts are closed source!)
I'm not a pro Developer/Coder , so if there are any mistakes or any suggestions for improvements in the code then do let me know!

Multi Day vWAP (Customizable) with AverageIntroducing the Multi-Day vWAP indicator that is fully customizable with average indicator option.
High level overview (default settings):
Default is 10 plots with each setting 1 day apart (1-10 day look back)
Labels for each plot are turned on by default (labels will default to your value, more below)
Use Style tab in options to change colors, plot style, and turn on/off individual plots
Average is turned off by default (style panel will show it's on-- go to Inputs panel and select "Show vWAP Average" to turn on)
Best use case is go to Visibility Panel in options and turn off for Days, Weeks, and Months
To turn off all labels at once go to Style tab and unselect "Labels" checkbox
If you want plots to be as small as possible in Inputs panel set the Plot Width to 0 (zero)
Detail Overview
This indicator will plot your custom daily vWAP values.
You can change the lookback period. If you change the lookback period the label will match your custom value.
For instance, if you change vWAP 1 value to "5", the label for this plot will be 5.
Average Notes:
The average will average all the vWAP values by the divisor. The default is to average all values by 10.
The average will always start to plot from the shortest lookback period. It is not possible to have the average plot before that point.
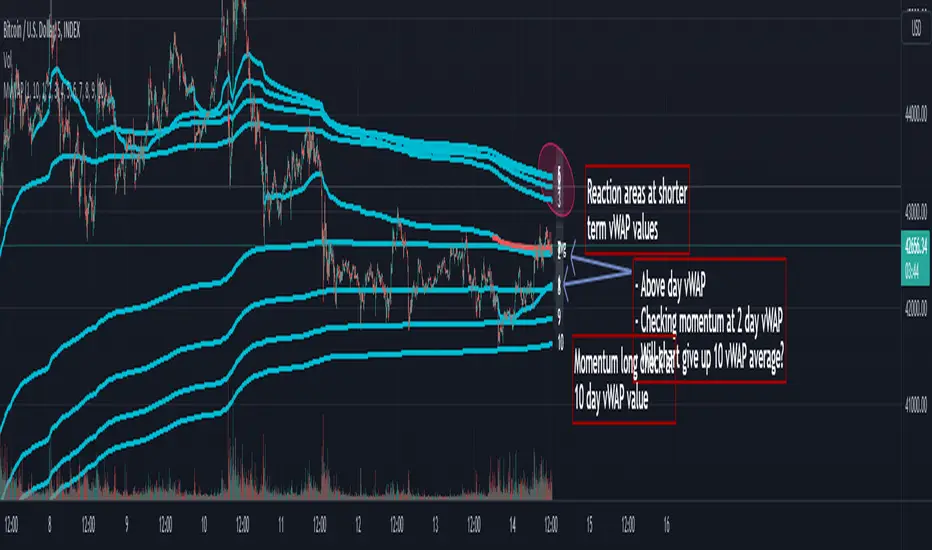
Trading Tips (default settings)
The simple way to use the vWAP is to treat them as magnets.
For intance,
Generally if price is trading below all the vWAP plots the chart is in a momentum short enviroment. All vWAP areas can be used for upside resistance/reaction areas.
If price is trading above the chart is in a momentum long enviroment and pullbacks can to vWAP levels can be looked as areas of support/reaction.
For instance:
Price is above the current day vWAP and looking to test the previous day vWAP value.
As it approaches the 2 value you are expecting this area to be a reaction area (good trade entry area) for a continuation short trade. Possibly to check back into the current day vWAP value.
I should share that this is a simple way to trade with the vWAP (true success with vWAP is understanding that price trades in vWAP channels).
Stacking and Strong Momentum
The other pattern you should look for is stacking.
For instance on this CL chart:
This chart is strong momentum long.
All 10 day vWAP plots are stacked on top of each other.
Previous action tested below all vWAPs. Price traded thru and came back and retested. Finally closing above all and above the vWAP avearge (red).
When the day vWAP was broke the next target you look for is the 2 vWAP. This reaction area held up and momentum long continued and continuing to trade above current day vWAP.
7 Day Rolling Example (Larger Timeframe)
Another great way to use this indicator is to customize the values for rolling 7 days (5 days for cash markets).
To do this set values to: 7, 14, 21, 28, 35, 42, 49, 56, 63, 70
For instance, this BTC chart:
This chart provides a good example of what you'll find when a chart is at a pivot point.
Price is checking in at the average to remain momentum long.
Upside longer term vWAP plots have been tested and had expected reaction.
Price is trading above the shorter term values.
Simple TA here will note if chart continues to trade above and takes out upper vWAPs long momentum is gaining ground.
On the downside if price trades thru the lower vWAP plots you would expect further downside. In this scenario you would be mindful to expect upside tests before (which could be good entry/reaction areas).
NQ example with 7 day values:
Overall chart is momentum short.
7 is above 14, 21
Maybe early sign of bottom.
If price takes out these values and holds above the buyers have quite a few challenges above.
[e2] Drawing Library :: Horizontal Ray█ OVERVIEW
Library "e2hray"
A drawing library that contains the hray() function, which draws a horizontal ray/s with an initial point determined by a specified condition. It plots a ray until it reached the price. The function let you control the visibility of historical levels and setup the alerts.
█ HORIZONTAL RAY FUNCTION
hray(condition, level, color, extend, hist_lines, alert_message, alert_delay, style, hist_style, width, hist_width)
Parameters:
condition : Boolean condition that defines the initial point of a ray
level : Ray price level.
color : Ray color.
extend : (optional) Default value true, current ray levels extend to the right, if false - up to the current bar.
hist_lines : (optional) Default value true, shows historical ray levels that were revisited, default is dashed lines. To avoid alert problems set to 'false' before creating alerts.
alert_message : (optional) Default value string(na), if declared, enables alerts that fire when price revisits a line, using the text specified
alert_delay : (optional) Default value int(0), number of bars to validate the level. Alerts won't trigger if the ray is broken during the 'delay'.
style : (optional) Default value 'line.style_solid'. Ray line style.
hist_style : (optional) Default value 'line.style_dashed'. Historical ray line style.
width : (optional) Default value int(1), ray width in pixels.
hist_width : (optional) Default value int(1), historical ray width in pixels.
Returns: void
█ EXAMPLES
• Example 1. Single horizontal ray from the dynamic input.
//@version=5
indicator("hray() example :: Dynamic input ray", overlay = true)
import e2e4mfck/e2hray/1 as e2draw
inputTime = input.time(timestamp("20 Jul 2021 00:00 +0300"), "Date", confirm = true)
inputPrice = input.price(54, 'Price Level', confirm = true)
e2draw.hray(time == inputTime, inputPrice, color.blue, alert_message = 'Ray level re-test!')
var label mark = label.new(inputTime, inputPrice, 'Selected point to start the ray', xloc.bar_time)
• Example 2. Multiple horizontal rays on the moving averages cross.
//@version=5
indicator("hray() example :: MA Cross", overlay = true)
import e2e4mfck/e2hray/1 as e2draw
float sma1 = ta.sma(close, 20)
float sma2 = ta.sma(close, 50)
bullishCross = ta.crossover( sma1, sma2)
bearishCross = ta.crossunder(sma1, sma2)
plot(sma1, 'sma1', color.purple)
plot(sma2, 'sma2', color.blue)
// 1a. We can use 2 function calls to distinguish long and short sides.
e2draw.hray(bullishCross, sma1, color.green, alert_message = 'Bullish Cross Level Broken!', alert_delay = 10)
e2draw.hray(bearishCross, sma2, color.red, alert_message = 'Bearish Cross Level Broken!', alert_delay = 10)
// 1b. Or a single call for both.
// e2draw.hray(bullishCross or bearishCross, sma1, bullishCross ? color.green : color.red)
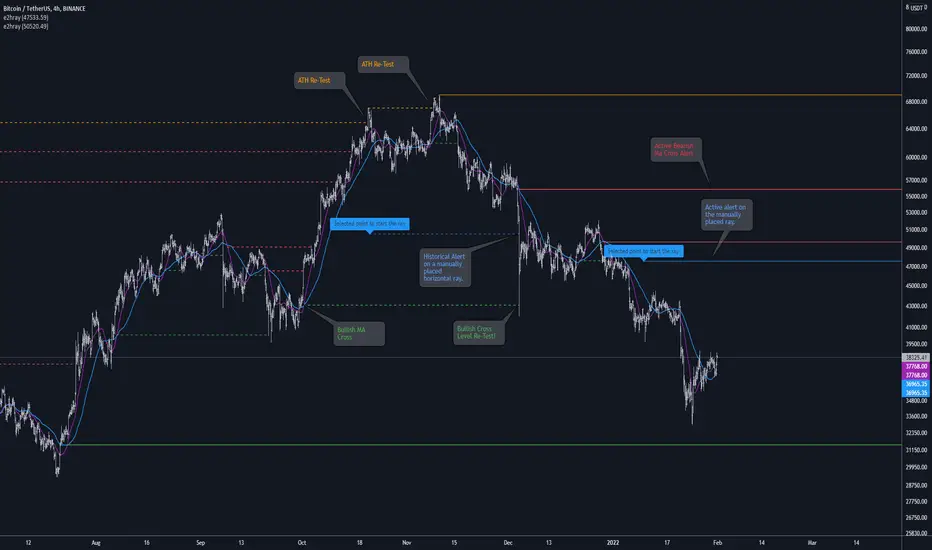
• Example 3. Horizontal ray at the all time highs with an alert.
//@version=5
indicator("hray() example :: ATH", overlay = true)
import e2e4mfck/e2hray/1 as e2draw
var float ath = 0, ath := math.max(high, ath)
bool newAth = ta.change(ath)
e2draw.hray(nz(newAth ), high , color.orange, alert_message = 'All Time Highs Tested!', alert_delay = 10)
LeoLibraryLibrary "LeoLibrary"
A collection of custom tools & utility functions commonly used with my scripts
getDecimals() Calculates how many decimals are on the quote price of the current market
Returns: The current decimal places on the market quote price
truncate(float, float) Truncates (cuts) excess decimal places
Parameters:
float : _number The number to truncate
float : _decimalPlaces (default=2) The number of decimal places to truncate to
Returns: The given _number truncated to the given _decimalPlaces
toWhole(float) Converts pips into whole numbers
Parameters:
float : _number The pip number to convert into a whole number
Returns: The converted number
toPips(float) Converts whole numbers back into pips
Parameters:
float : _number The whole number to convert into pips
Returns: The converted number
av_getPositionSize(float, float, float, float) Calculates OANDA forex position size for AutoView based on the given parameters
Parameters:
float : _balance The account balance to use
float : _risk The risk percentage amount (as a whole number - eg. 1 = 1% risk)
float : _stopPoints The stop loss distance in POINTS (not pips)
float : _conversionRate The conversion rate of our account balance currency
Returns: The calculated position size (in units - only compatible with OANDA)
getMA(int, string) Gets a Moving Average based on type
Parameters:
int : _length The MA period
string : _maType The type of MA
Returns: A moving average with the given parameters
getEAP(float) Performs EAP stop loss size calculation (eg. ATR >= 20.0 and ATR < 30, returns 20)
Parameters:
float : _atr The given ATR to base the EAP SL calculation on
Returns: The EAP SL converted ATR size
barsAboveMA(int, float) Counts how many candles are above the MA
Parameters:
int : _lookback The lookback period to look back over
float : _ma The moving average to check
Returns: The bar count of how many recent bars are above the MA
barsBelowMA(int, float) Counts how many candles are below the MA
Parameters:
int : _lookback The lookback period to look back over
float : _ma The moving average to reference
Returns: The bar count of how many recent bars are below the EMA
barsCrossedMA(int, float) Counts how many times the EMA was crossed recently
Parameters:
int : _lookback The lookback period to look back over
float : _ma The moving average to reference
Returns: The bar count of how many times price recently crossed the EMA
getPullbackBarCount(int, int) Counts how many green & red bars have printed recently (ie. pullback count)
Parameters:
int : _lookback The lookback period to look back over
int : _direction The color of the bar to count (1 = Green, -1 = Red)
Returns: The bar count of how many candles have retraced over the given lookback & direction
getBodySize() Gets the current candle's body size (in POINTS, divide by 10 to get pips)
Returns: The current candle's body size in POINTS
getTopWickSize() Gets the current candle's top wick size (in POINTS, divide by 10 to get pips)
Returns: The current candle's top wick size in POINTS
getBottomWickSize() Gets the current candle's bottom wick size (in POINTS, divide by 10 to get pips)
Returns: The current candle's bottom wick size in POINTS
getBodyPercent() Gets the current candle's body size as a percentage of its entire size including its wicks
Returns: The current candle's body size percentage
isHammer(float, bool) Checks if the current bar is a hammer candle based on the given parameters
Parameters:
float : _fib (default=0.382) The fib to base candle body on
bool : _colorMatch (default=false) Does the candle need to be green? (true/false)
Returns: A boolean - true if the current bar matches the requirements of a hammer candle
isStar(float, bool) Checks if the current bar is a shooting star candle based on the given parameters
Parameters:
float : _fib (default=0.382) The fib to base candle body on
bool : _colorMatch (default=false) Does the candle need to be red? (true/false)
Returns: A boolean - true if the current bar matches the requirements of a shooting star candle
isDoji(float, bool) Checks if the current bar is a doji candle based on the given parameters
Parameters:
float : _wickSize (default=2) The maximum top wick size compared to the bottom (and vice versa)
bool : _bodySize (default=0.05) The maximum body size as a percentage compared to the entire candle size
Returns: A boolean - true if the current bar matches the requirements of a doji candle
isBullishEC(float, float, bool) Checks if the current bar is a bullish engulfing candle
Parameters:
float : _allowance (default=0) How many POINTS to allow the open to be off by (useful for markets with micro gaps)
float : _rejectionWickSize (default=disabled) The maximum rejection wick size compared to the body as a percentage
bool : _engulfWick (default=false) Does the engulfing candle require the wick to be engulfed as well?
Returns: A boolean - true if the current bar matches the requirements of a bullish engulfing candle
isBearishEC(float, float, bool) Checks if the current bar is a bearish engulfing candle
Parameters:
float : _allowance (default=0) How many POINTS to allow the open to be off by (useful for markets with micro gaps)
float : _rejectionWickSize (default=disabled) The maximum rejection wick size compared to the body as a percentage
bool : _engulfWick (default=false) Does the engulfing candle require the wick to be engulfed as well?
Returns: A boolean - true if the current bar matches the requirements of a bearish engulfing candle
timeFilter(string, bool) Determines if the current price bar falls inside the specified session
Parameters:
string : _sess The session to check
bool : _useFilter (default=false) Whether or not to actually use this filter
Returns: A boolean - true if the current bar falls within the given time session
dateFilter(int, int) Determines if this bar's time falls within date filter range
Parameters:
int : _startTime The UNIX date timestamp to begin searching from
int : _endTime the UNIX date timestamp to stop searching from
Returns: A boolean - true if the current bar falls within the given dates
dayFilter(bool, bool, bool, bool, bool, bool, bool) Checks if the current bar's day is in the list of given days to analyze
Parameters:
bool : _monday Should the script analyze this day? (true/false)
bool : _tuesday Should the script analyze this day? (true/false)
bool : _wednesday Should the script analyze this day? (true/false)
bool : _thursday Should the script analyze this day? (true/false)
bool : _friday Should the script analyze this day? (true/false)
bool : _saturday Should the script analyze this day? (true/false)
bool : _sunday Should the script analyze this day? (true/false)
Returns: A boolean - true if the current bar's day is one of the given days
atrFilter(float, float) Checks the current bar's size against the given ATR and max size
Parameters:
float : _atr (default=ATR 14 period) The given ATR to check
float : _maxSize The maximum ATR multiplier of the current candle
Returns: A boolean - true if the current bar's size is less than or equal to _atr x _maxSize
fillCell(table, int, int, string, string, color, color) This updates the given table's cell with the given values
Parameters:
table : _table The table ID to update
int : _column The column to update
int : _row The row to update
string : _title The title of this cell
string : _value The value of this cell
color : _bgcolor The background color of this cell
color : _txtcolor The text color of this cell
Returns: A boolean - true if the current bar falls within the given dates

ZenLibraryLibrary "ZenLibrary"
A collection of custom tools & utility functions commonly used with my scripts.
getDecimals() Calculates how many decimals are on the quote price of the current market
Returns: The current decimal places on the market quote price
truncate(float, float) Truncates (cuts) excess decimal places
Parameters:
float : _number The number to truncate
float : _decimalPlaces (default=2) The number of decimal places to truncate to
Returns: The given _number truncated to the given _decimalPlaces
toWhole(float) Converts pips into whole numbers
Parameters:
float : _number The pip number to convert into a whole number
Returns: The converted number
toPips(float) Converts whole numbers back into pips
Parameters:
float : _number The whole number to convert into pips
Returns: The converted number
av_getPositionSize(float, float, float, float) Calculates OANDA forex position size for AutoView based on the given parameters
Parameters:
float : _balance The account balance to use
float : _risk The risk percentage amount (as a whole number - eg. 1 = 1% risk)
float : _stopPoints The stop loss distance in POINTS (not pips)
float : _conversionRate The conversion rate of our account balance currency
Returns: The calculated position size (in units - only compatible with OANDA)
getMA(int, string) Gets a Moving Average based on type
Parameters:
int : _length The MA period
string : _maType The type of MA
Returns: A moving average with the given parameters
getEAP(float) Performs EAP stop loss size calculation (eg. ATR >= 20.0 and ATR < 30, returns 20)
Parameters:
float : _atr The given ATR to base the EAP SL calculation on
Returns: The EAP SL converted ATR size
barsAboveMA(int, float) Counts how many candles are above the MA
Parameters:
int : _lookback The lookback period to look back over
float : _ma The moving average to check
Returns: The bar count of how many recent bars are above the MA
barsBelowMA(int, float) Counts how many candles are below the MA
Parameters:
int : _lookback The lookback period to look back over
float : _ma The moving average to reference
Returns: The bar count of how many recent bars are below the EMA
barsCrossedMA(int, float) Counts how many times the EMA was crossed recently
Parameters:
int : _lookback The lookback period to look back over
float : _ma The moving average to reference
Returns: The bar count of how many times price recently crossed the EMA
getPullbackBarCount(int, int) Counts how many green & red bars have printed recently (ie. pullback count)
Parameters:
int : _lookback The lookback period to look back over
int : _direction The color of the bar to count (1 = Green, -1 = Red)
Returns: The bar count of how many candles have retraced over the given lookback & direction
getBodySize() Gets the current candle's body size (in POINTS, divide by 10 to get pips)
Returns: The current candle's body size in POINTS
getTopWickSize() Gets the current candle's top wick size (in POINTS, divide by 10 to get pips)
Returns: The current candle's top wick size in POINTS
getBottomWickSize() Gets the current candle's bottom wick size (in POINTS, divide by 10 to get pips)
Returns: The current candle's bottom wick size in POINTS
getBodyPercent() Gets the current candle's body size as a percentage of its entire size including its wicks
Returns: The current candle's body size percentage
isHammer(float, bool) Checks if the current bar is a hammer candle based on the given parameters
Parameters:
float : _fib (default=0.382) The fib to base candle body on
bool : _colorMatch (default=false) Does the candle need to be green? (true/false)
Returns: A boolean - true if the current bar matches the requirements of a hammer candle
isStar(float, bool) Checks if the current bar is a shooting star candle based on the given parameters
Parameters:
float : _fib (default=0.382) The fib to base candle body on
bool : _colorMatch (default=false) Does the candle need to be red? (true/false)
Returns: A boolean - true if the current bar matches the requirements of a shooting star candle
isDoji(float, bool) Checks if the current bar is a doji candle based on the given parameters
Parameters:
float : _wickSize (default=2) The maximum top wick size compared to the bottom (and vice versa)
bool : _bodySize (default=0.05) The maximum body size as a percentage compared to the entire candle size
Returns: A boolean - true if the current bar matches the requirements of a doji candle
isBullishEC(float, float, bool) Checks if the current bar is a bullish engulfing candle
Parameters:
float : _allowance (default=0) How many POINTS to allow the open to be off by (useful for markets with micro gaps)
float : _rejectionWickSize (default=disabled) The maximum rejection wick size compared to the body as a percentage
bool : _engulfWick (default=false) Does the engulfing candle require the wick to be engulfed as well?
Returns: A boolean - true if the current bar matches the requirements of a bullish engulfing candle
isBearishEC(float, float, bool) Checks if the current bar is a bearish engulfing candle
Parameters:
float : _allowance (default=0) How many POINTS to allow the open to be off by (useful for markets with micro gaps)
float : _rejectionWickSize (default=disabled) The maximum rejection wick size compared to the body as a percentage
bool : _engulfWick (default=false) Does the engulfing candle require the wick to be engulfed as well?
Returns: A boolean - true if the current bar matches the requirements of a bearish engulfing candle
timeFilter(string, bool) Determines if the current price bar falls inside the specified session
Parameters:
string : _sess The session to check
bool : _useFilter (default=false) Whether or not to actually use this filter
Returns: A boolean - true if the current bar falls within the given time session
dateFilter(int, int) Determines if this bar's time falls within date filter range
Parameters:
int : _startTime The UNIX date timestamp to begin searching from
int : _endTime the UNIX date timestamp to stop searching from
Returns: A boolean - true if the current bar falls within the given dates
dayFilter(bool, bool, bool, bool, bool, bool, bool) Checks if the current bar's day is in the list of given days to analyze
Parameters:
bool : _monday Should the script analyze this day? (true/false)
bool : _tuesday Should the script analyze this day? (true/false)
bool : _wednesday Should the script analyze this day? (true/false)
bool : _thursday Should the script analyze this day? (true/false)
bool : _friday Should the script analyze this day? (true/false)
bool : _saturday Should the script analyze this day? (true/false)
bool : _sunday Should the script analyze this day? (true/false)
Returns: A boolean - true if the current bar's day is one of the given days
atrFilter(float, float) Checks the current bar's size against the given ATR and max size
Parameters:
float : _atr (default=ATR 14 period) The given ATR to check
float : _maxSize The maximum ATR multiplier of the current candle
Returns: A boolean - true if the current bar's size is less than or equal to _atr x _maxSize
fillCell(table, int, int, string, string, color, color) This updates the given table's cell with the given values
Parameters:
table : _table The table ID to update
int : _column The column to update
int : _row The row to update
string : _title The title of this cell
string : _value The value of this cell
color : _bgcolor The background color of this cell
color : _txtcolor The text color of this cell
Returns: A boolean - true if the current bar falls within the given dates
TASC 2021.11 MADH Moving Average Difference, Hann█ OVERVIEW
Presented here is code for the "Moving Average Difference, Hann" indicator originally conceived by John Ehlers. The code is also published in the November 2021 issue of Trader's Tips by Technical Analysis of Stocks & Commodities (TASC) magazine.
█ CONCEPTS
By employing a Hann windowed finite impulse response filter (FIR), John Ehlers has enhanced the Moving Average Difference (MAD) to provide an oscillator with exceptional smoothness.
Of notable mention, the wave form of MADH resembles Ehlers' "Reverse EMA" Indicator, formerly revealed in the September 2017 issue of TASC. Many variations of the "Reverse EMA" were published in TradingView's Public Library.
█ FEATURES
Three values in the script's "Settings/Inputs" provide control over the oscillators behavior:
• The price source
• A "Short Length" with a default of 8, to manage the lower band edge of the oscillator
• The "Dominant Cycle", originally set at 27, which appears to be a placeholder for an adaptive control mechanism
Two coloring options are provided for the line's fill:
• "ZeroCross", the default, uses the line's position above/below the zero level. This is the mode used in the top version of MADH on this chart.
• "Momentum" uses the line's up/down state, as shown in the bottom version of the indicator on the chart.
█ NOTES
Calculations
The source price is used in two independent Hann windowed FIR filters having two different periods (lengths) of historical observation for calculation, one being a "Short Length" and the other termed "Dominant Cycle". These are then passed to a "rate of change" calculation and then returned by the reusable function. The secret sauce is that a "windowed Hann FIR filter" is superior tp a generic SMA filter, and that ultimately reveals Ehlers' clever enhancement. We'll have to wait and see what ingenuities Ehlers has next to unleash. Stay tuned...
The `madh()` function code was optimized for computational efficiency in Pine, differing visibly from Ehlers' original formula, but yielding the same results as Ehlers' version.
Background
This indicator has a sibling indicator discussed in the "The MAD Indicator, Enhanced" article by Ehlers. MADH is an evolutionary update from the prior MAD indicator code published in the October 2021 issue of TASC.
Sibling Indicators
• Moving Average Difference (MAD)
• Cycle/Trend Analytics
Related Information
• Cycle/Trend Analytics And The MAD Indicator
• The Reverse EMA Indicator
• Hann Window
• ROC
Join TradingView!

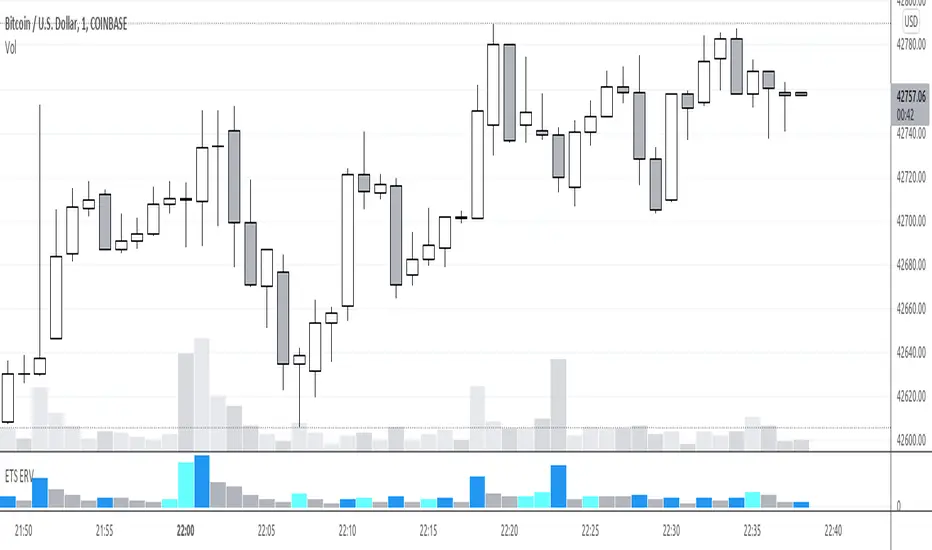
Early Relative Volume"Buy or Sell when you see a spike in volume" is advice that you often hear, the problem for me was that you only find out that volume is spiking after the fact. So that's why I created the Early Relative Volume indicator.
The Early Relative Volume indicator takes the amount of time that has passed for the current bar, let's say 10 seconds, and compares the volume of that first 10 seconds to the average volume in 10 seconds of the previous candle.
That means that it will tell you if the volume thus far in the current candle is more or less than the relative volume of the previous candle, so that you can potentially get an indication that the volume of the current candle is going to be greater or less than the previous candle.
This approach is of course not perfect, and obviously the values update as the current candle progresses, but I've found it useful to identify early breakout candles.
There is also an option to do the same calculation with the size of the body of the candle, by enabling the "Blue bars if candle body and volume bigger" option. It will only turn blue of both the volume and the size of the candle's body is calculated to be bigger.
I hope this helps you in your trading!
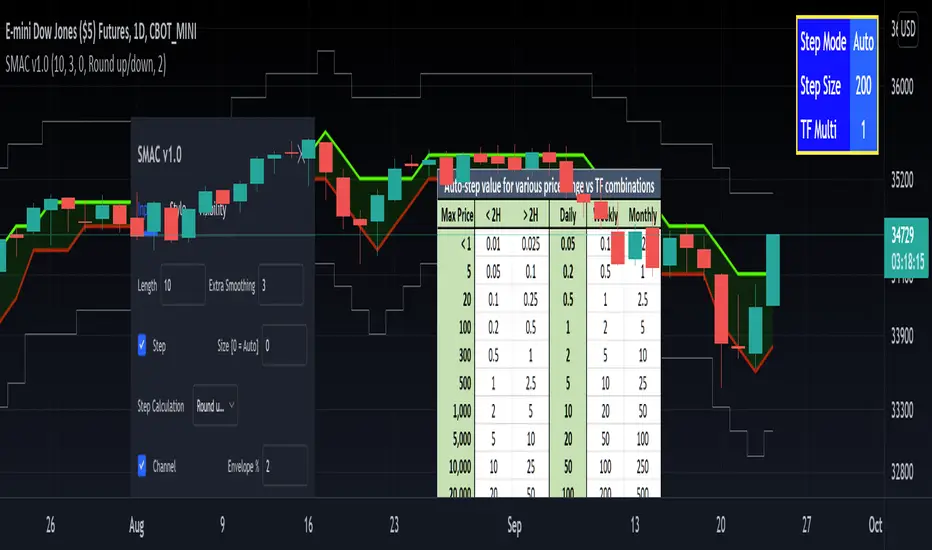
[RedK] Stepped Moving Average Channel (SMAC)The Stepping Moving Average Channel (SMAC) is not an indicator - It is more of a trading tool that was put together to enable a trader to take advantage of relatively fast price moves with quick incremental gain - maybe by exploiting opportunities to trade basic options (Calls, Puts) or to help with in/out-type swing trades. This is more a price-level visualization tool so please use it with this in mind, and not as a trading tool by itself.
While it looks very similar to a Donchian channel, SMAC plots a stepping channel of the moving average of the high & low prices (channel borders) - with an envelope that is at a user-specified % distance from the channel borders.
This setup, when combined with other Moving Averages and lower indicators, may make it easier for a trader to prepare for a trade with clear entry and exit price levels being planned upfront.
For example, a trader wants to capture 2% of the next move, will set the envelope to 2% and have clearer view of entry/exit price levels for such a scenario. once the trader receives confirmation (from other indicators or charts) that the price is heading in the way expected, the SMAC may make it simpler and quicker to estimate (and visualize) the entry/exit price levels and track the movement.
* The stepping feature helps remove price noise and the auto-stepping feature is designed to "snap to" those mental price levels that trader gravitate towards.
* The moving average type I used here is the Compound Ratio MA (CoRA_Wave) .
* This MA type was selected because it has a very high responsiveness and good smoothness, and tracks the price values very closely.
* The MA type can be replaced within the code with any other MA as preferred.
The auto-stepping feature:
----------------------------------
User can override the auto-stepping by entering a manual step value
when the auto-stepping is active, it will attempt to pick the best step size based on the underlying price range and the timeframe selected.
The step selection may not be ideal in some combination of value / TF - i will continue to improve these combinations
Stepping can also be completely disabled - this bring SMAC back to a regular (though highly responsive) Hi/Lo MA channel with envelope
The Excel table snippet in the chart above shows the various step value / TF combinations.
Also the stepping values can be further customized by changing the appropriate part in the script.
Other features:
--------------------
* Rounding Options: The stepping calculations uses one of 2 selectable methods:
1 -- regular rounding (uses the round() function): which rounds the price up & down depending on where it is compared to the half-step value
example: a value of 17 with a step of 10 will be rounded to 20. a value of 13 in that case will be rounded to 10
2 -- Whole Step (uses the int() function): this will only consider whole/fully completed steps - if the average (hi or low) does not explicitly exceed the next step level, we will not get that next value.
example: both values of 17 and 13 with a step of 10 will be rounded to 10.
* The "Quick Table":
The Quick Table shows on the top-left - and can be disabled in the script settings - It shows the currently selected stepping mode and value - since the auto-step changes dynamically with the selected chart timeframe, this makes it easier for the trader to view the active "configuration"
overall, i hope some traders find this quick utility useful - if not to use, maybe to inspire other ideas
- please feel free to use or customize in any way you need. Feel free to share feedback and observations.
Climatic Volume indicator Buy/Sell ENGLISH
this indicator is contrarian and it's use in my strategy
Strategy: when price falls the graph show as two moments with panic during the downtrend: two candlesticks of panic
Both candlesticks are associating with two Volume climatic bars (when volumen double the average volume of last 10 bars). In that moment the institutions buy (remember, the institutions only buy during panic and sell in the euphoria moment because they generate a new trend in the market)
Buy Signal: Bear candlestick with climatic volume in downtrend (first institutions buying) + a few candlesticks more with low volume (lower than average volume of last 10 bars) + second candlestick climatic volume in downtrend (last institutions buying before the new trend)
Moving Stop Loss to break even or first sell of us: bull candlestick with climatic volume associated in uptrend (first take profit of institutions)
Sell Signal: Second bull candlestick with climatic volume associated in uptrend (in this moment the institutions take profit in the timeframe where we are operating and wait for a future new swing)
ESPAÑOL
El indicador es un indicador contratendencial
Estrategia: Cuando el precio cae el grafico nos muestra dos momentos de pánico durante la tendencia bajista: dos velas japonesas de panic
ambas velas japonesas están asociadas a dos barras de volumen climático (un volumen que supera en un 100% el volumen promedio de las ultimas 10 barras). En ese momento las instituciones compran (recuerden que las instituciones compran durante el pánico y venden durante la euforia porque ellos generan una nueva tendencia en el mercado)
Señal de compra: vela japonesa bajista con un volumen climático asociado en una tendencia bajista (primera compra de instituciones) + algunas velas japonesas con bajo volumen + una segunda vela japonesa con volumen climático en una tendencia bajista (la ultima compra de institucionales antes de la nueva tendencia)
Mover stop loss a precio de entrada o hacer nuestra primera venta: vela japonesa alcista con volumen climático asociado en una tendencia alcista (primera toma de ganancias de institucionales)
Señal de venta: Segunda vela japonesa con volumen climático asociado en una alcista (en ese momento las instituciones toman ganancias en el timeframe donde estamos operando y esperan un nuevo swing futuro)

Pivot Boss - Advanced Volume IndicatorThis indicator measures "Compression and Expansion" of current bars volume against 10 day average volume(Can be user defined)
Avg Volume = 10 day avg volume
Wide volume = AvgVolume x 1.25 (Volume bar will be Blue color)
Narrow Volume = AvgVolume x 0.65 (Volume bar will be Magenta color)
Yellow line -- 5 bar avg volume
White Line -- 10 bar avg volume

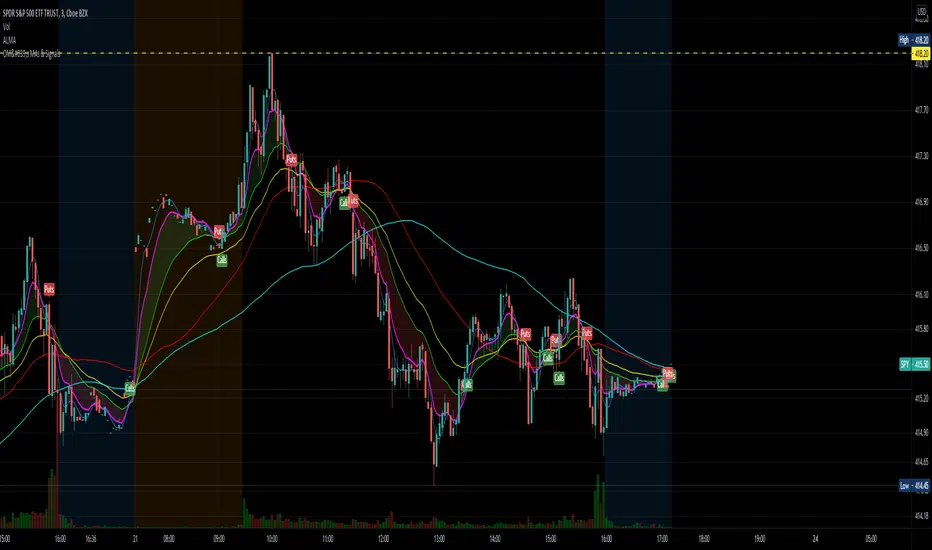
5MA_X_LThis is a 5 day moving average crossing long strategy in 10 min. chart, used in short term momentum trading strategy.
Momentum trading Strategy: When S&P 500 index is at up trend (or above 60 sma ), buy 10+ stocks in top 20% stock RS ranking at equal weight using this MA5X_L strategy. Change stocks when any stock exited by algorithm.
Back test start since 2020/7/1, each long entry for condition 1 is $30000, condition 2 is $20000, with max of 2 long positions.
Setup: 10 minutes chart
Buy condition 1) 3 wma cross up 195 wma (5day) 2) 3wma > 78wma > 195wma UP Trend Arrangement (UTA)
Exit condition 1) 3 wma cross under 195 wma 2) position profit > 20% and 3 wma cross under 6 ATRs line (green)

[blackcat] L1 Mel Widner Rainbow ChartNOTE: Because the originally released script failed to comply with the House Rule in the description, it was banned. After revising and reviewing the description, it is republished again. Please forgive the inconvenience caused.
Level: 1
Background
The Rainbow Charts indicator is a technical analysis tool that follows trend. It helps traders to visualize a full spectrum of trends in the market. Mel Widner developed the indicator and elaborated it in the 1997 issue of Technical Analysis of Stocks and Commodities magazine. It uses 10 simple moving averages and hence, it is a very interesting take on a simple moving average.
Function
The basis of the Rainbow Charts indicator are 10 moving averages. The first Rainbow Moving Average is a 2-period simple moving average. It applies recursive smoothing to this first SMA. The first moving average is the base of nine other simple Rainbow Moving Averages of different lengths. Each SMA bases on the previous SMA. The application of the recursive smoothing enables the indicator to create a full spectrum of the current trends in the market. As we know that the financial markets are full of wonders and surprises and we have an indicator that also surprises us. Yes, it is none other than the Rainbow Charts indicator that presents information on the charts in the form of a rainbow. That is the reason that it is known as the Rainbow Charts indicator.
The interpretation of the Rainbow Charts indicator is quite straightforward. The Rainbow Moving Average with the least recursive smoothing stays at the very top of the Rainbow during a bullish trend in the market. Conversely, the moving average with the most recursive smoothing stays at the bottom of the Rainbow.
On the other hand, the positions of the least and the most smoothed moving averages reverses during a bearish trend in the market. Now the least smoothed moving average stays at the bottom while the most smoothed moving average stays at the top of the Rainbow.
The Rainbow Charts indicator’s moving averages track the uptrend or downtrend in the market. The moving averages track the trend as it progresses and cross each other in a sequential order. The distancing of the price from the Rainbow indicates the continuation of the current market trend. Conversely, if the price moves closer to the Rainbow, it suggests that a potential trend reversal is imminent.
The use of the indicator is also quite simple. Traders should look for initiating a buy position as soon as a strong positive move starts. Similarly, they should look for opening a sell position at the very beginning of a strong negative trend. It is important to note that the angle of the moving averages helps to identify the strength of a trend. The steeper curve suggests a stronger trend and vice versa.
Traders can also use the tool in combination with other technical analysis tools as a trend-following indicator. Traders can enter a buy position when indicators suggest a strong bullish trend. They can initiate a sell position when indicators indicate a bearish trend. Technical analysts and experts always suggest to use the Rainbow Charts indicator in combination with other technical analysis tools for successful trading.
Key Signal
Plot a1~c4 --> 10 Rainbow Moving Averages.
Remarks
This is a Level 1 free and open source indicator.
Feedbacks are appreciated.

Technical Analysis Consulting Table (TACT)Inspired by Tradingview's own "Technical Analysis Summary", I present to you a table with analogous logic.
You can track any ticker you want, no matter your chart. You can even have multiple tables to track multiple tickers. By default it tracks the Total Crypto Cap.
You can change the resolution you want to track. By default it is the same as the chart.
You can position the table to whichever corner of the chart you want. By default it draws in the bottom right corner.
Background colors and text size can be adjusted.
Indicators Used:
Oscillators
RSI(14)
STOCH(14, 3, 3)
CCI(20)
ADX(14)
AO
Momentum(10)
MACD(12, 26)
STOCH RSI(3, 3, 14, 14)
%R(14)
Bull Bear Power
UO(7,14,28)
Moving Averages
EMA(5)
SMA(5)
EMA(10)
SMA(10)
EMA(20)
SMA(20)
EMA(30)
SMA(30)
EMA(50)
SMA(50)
EMA(100)
SMA(100)
EMA(200)
SMA(200)
Ichimoku Cloud(9, 26, 52, 26)
VMWA(20)
HMA(9)
Pivots
Traditional
Fibonacci
Camarilla
Woodie
WARNING: I have observed up to a couple of seconds of signal jitter/delay, so use it with caution in very small resolutions (1s to 1m).
I hope you enjoy this and good luck with your trading. Suggestions and feedback are most welcome.

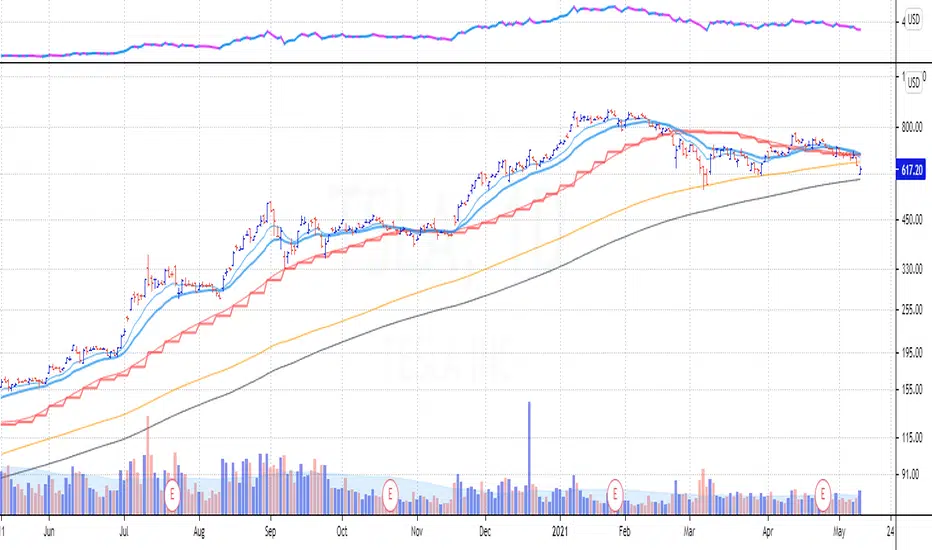
Daily and Weekly Moving Averages on Daily ChartFor the long term trend I use the 200 and 150 daily moving averages. The 200-day MA will be plotted as a black line. It is a no-go zone to buy anything trading below that.
The 150-day, or 30-week like Stan Weinstein uses, is plotted in orange.
Than I use the 50 day moving average but also the 10 week moving average. While those look similar there is a small difference which sometimes impacts the choice for selling a stock or holding on to it.
That slight difference is useful in different situations that’s why I want to have them both on my chart.
Both the 50-day and the 10-week are plotted as red lines on the chart. Since there’s only a small difference the same color gives a nicer view.
For shorter term trend I like to use the 20 and 10 day exponential moving averages. I tested these but also the commonly used 21, 9 and some other variations. But came to the conclusion that for me the 20EMA and 10EMA works best.
Both EMA’s are plotted in blue, where the 20EMA has a thicker line to easily see the difference.
OptionsMillionaire SPY Moving Averages and Signalsby ColeJustice
OptionsMillionaire's SPY Options trading system is based mainly on these indicators:
- 8 EMA*
- 21 EMA*
- 100 SMA*
- 200 SMA*
- MACD
- RSI
- Squeeze Momentum
(*provided by this indicator)
and follows these rules:
|
| 1) I never fight the trend. If its green, i buy calls. If its red, i buy puts. I will only buy puts on a green day if there is a overall change in market trend. Inversely, calls on a red day
| 2) Price action is my #1 indicator. I wait for it to confirm my thesis before i enter a trade
| 3) I only trade SPY Options
| 4) My baseline is to choose a call/put that has a DTE (Date To Expiration) 6-7 days out, with a strike $2-$3 away. I adjust that to fit my current appetite for volatility. i virtually never play same day DTE's.
| 5) I set a 10% stop, but usually exit at 8% before my stop triggers depending on current situation
| 6) I utilize about 10-20% of my Portfolio for one trade. Sometimes more. Rarely less.
| 7) I never hold overnight in these market conditions.
| 8) I shoot for 10-20% for gains. Depending on market conditions.
| 9) Always look for confirmations in your indicators.
| 10) I never force a trade. No trade is a good trade too if the entry just isn't there.
| 11) Patience always pays off. A great set-up can form in minutes or seconds. I never regret being patient to enter. I nearly always regret rushing into a trade.
|
This indicator combines the moving averages into a single unit to simplify one part of the indicator usage rules: the 8 EMA / 21 EMA Cross. . The 8 crossing over the 21 is a Bullish signal, while the 8 crossing under the 21 is a Bearish signal. This indicator places flags at these crossover/under points, as well as shading the area between the 8 and 21 EMAs to help visualize the strength of the trend; green during a Bullish cross, and red during a Bearish cross.
A new addition to this strategy is the Hull Moving Average, or HMA. This script defaults to an HMA of 20 and shows alerts when candles close above or below the plot in the form of green and red candle backgrounds. This alert is best used in conjunction with the main crossovers and should be considered an addition level of confidence rather than providing trade entry/exits directly. This indicator is more flexible and you should feel free to adjust the period if you find a different value works better within your own personal trading style.
Each individual element of this indicator can be modified or toggled, providing maximum customization. While you should strive to become comfortable with the default settings, these options are provided in case you feel the need to adjust for your own style (or if testing on tickers other than SPY, for example).
Goodluch, and happy trading!