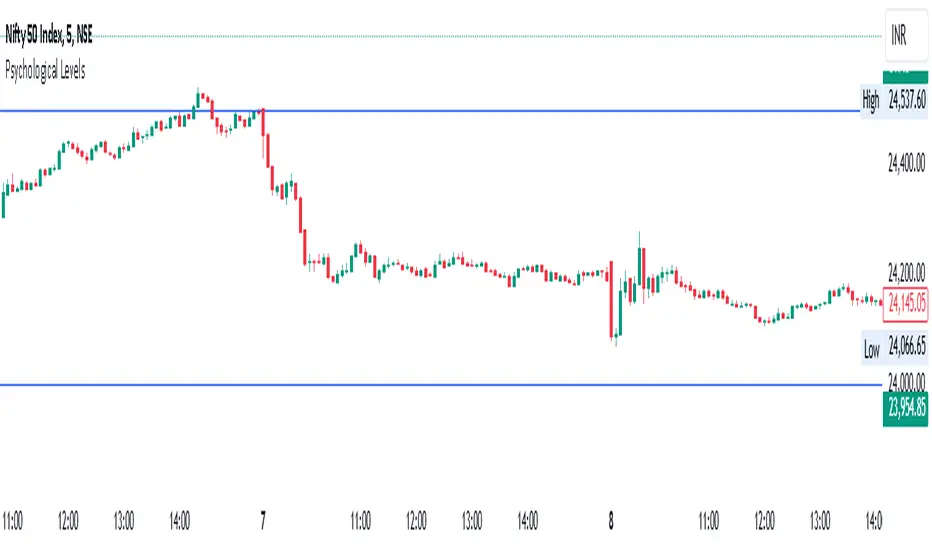
Psychological Levels- Rounding Numbers Psychological Levels Indicator
Overview:
The Psychological Levels Indicator automatically identifies and plots significant price levels based on psychological thresholds, which are key areas where market participants often focus their attention. These levels act as potential support or resistance zones due to human behavioral tendencies to round off numbers. This indicator dynamically adjusts the levels based on the stock's price range and ensures seamless visibility across the chart.
Key Features:
Dynamic Step Sizes:
The indicator adjusts the levels dynamically based on the stock price:
For prices below 500: Levels are spaced at 10.
For prices between 500 and 3000: Levels are spaced at 50, 100, and 1000.
For prices between 3000 and 10,000: Levels are spaced at 100 and 1000.
For prices above 10,000: Levels are spaced at 500 and 1000.
Extended Visibility:
The plotted levels are extended across the entire chart for improved visualization, ensuring traders can easily monitor these critical zones over time.
Customization Options:
Line Color: Choose the color for the levels to suit your charting style.
Line Style: Select from solid, dashed, or dotted lines.
Line Width: Adjust the thickness of the lines for better clarity.
Clean and Efficient Design:
The indicator only plots levels relevant to the visible chart range, avoiding unnecessary clutter and ensuring a clean workspace.
How It Works:
It calculates the relevant step sizes based on the price:
Smaller step sizes for lower-priced stocks.
Larger step sizes for higher-priced stocks.
Primary, secondary, and (if applicable) tertiary levels are plotted dynamically:
Primary Levels: The most granular levels based on the stock price.
Secondary Levels: Higher-order levels for broader significance.
Tertiary Levels: Additional levels for lower-priced stocks to enhance detail.
These levels are plotted across the chart, allowing traders to visualize key psychological areas effortlessly.
Use Cases:
Day Trading: Identify potential intraday support and resistance levels.
Swing Trading: Recognize key price zones where trends may pause or reverse.
Long-Term Investing: Gain insights into significant price zones for entry or exit strategies.
Cari dalam skrip untuk "10年期国债+交易单位+价格"
Average Price Range Screener [KFB Quant]Average Price Range Screener
Overview:
The Average Price Range Screener is a technical analysis tool designed to provide insights into the average price volatility across multiple symbols over user-defined time periods. The indicator compares price ranges from different assets and displays them in a visual table and chart for easy reference. This can be especially helpful for traders looking to identify symbols with high or low volatility across various time frames.
Key Features:
Multiple Symbols Supported:
The script allows for analysis of up to 10 symbols, such as major cryptocurrencies and market indices. Symbols can be selected by the user and configured for tracking price volatility.
Dynamic Range Calculation:
The script calculates the average price range of each symbol over three distinct time periods (default are 30, 60, and 90 bars). The price range for each symbol is calculated as a percentage of the bar's high-to-low difference relative to its low value.
Range Visualization:
The results are visually represented using:
- A color-coded table showing the calculated average ranges of each symbol and the current chart symbol.
- A line plot that visually tracks the volatility for each symbol on the chart, with color gradients representing the range intensity from low (red/orange) to high (blue/green).
Customizable Inputs:
- Length Inputs: Users can define the time lengths (default are 30, 60, and 90 bars) for calculating average price ranges for each symbol.
- Symbol Inputs: 10 symbols can be tracked at once, with default values set to popular crypto pairs and indices.
- Color Inputs: Users can customize the color scheme for the range values displayed in the table and chart.
Real-Time Ranking:
The indicator ranks symbols by their average price range, providing a clear view of which assets are exhibiting higher volatility at any given time.
Each symbol's range value is color-coded based on its relative volatility within the selected symbols (using a gradient from low to high range).
Data Table:
The table shows the average range values for each symbol in real-time, allowing users to compare volatility across multiple assets at a glance. The table is dynamically updated as new data comes in.
Interactive Labels:
The indicator adds labels to the chart, showing the average range for each symbol. These labels adjust in real-time as the price range values change, giving users an immediate view of volatility rankings.
How to Use:
Set Time Periods: Adjust the time periods (lengths) to match your trading strategy's timeframe and volatility preference.
Symbol Selection: Add and track the price range for your preferred symbols (cryptocurrencies, stocks, indices).
Monitor Volatility: Use the visual table and plot to identify symbols with higher or lower volatility, and adjust your trading strategy accordingly.
Interpret the Table and Chart: Ranges that are color-coded from red/orange (lower volatility) to blue/green (higher volatility) allow you to quickly gauge which symbols are most volatile.
Disclaimer: This tool is provided for informational and educational purposes only and should not be considered as financial advice. Always conduct your own research and consult with a licensed financial advisor before making any investment decisions.

Multi-Timeframe Stochastic Alert [tradeviZion]# Multi-Timeframe Stochastic Alert : Complete User Guide
## 1. Introduction
### What is the Multi-Timeframe Stochastic Alert?
The Multi-Timeframe Stochastic Alert is an advanced technical analysis tool that helps traders identify potential trading opportunities by analyzing momentum across multiple timeframes. It combines the power of the stochastic oscillator with multi-timeframe analysis to provide more reliable trading signals.
### Key Features and Benefits
- Simultaneous analysis of 6 different timeframes
- Advanced alert system with customizable conditions
- Real-time visual feedback with color-coded signals
- Comprehensive data table with instant market insights
- Motivational trading messages for psychological support
- Flexible theme support for comfortable viewing
### How it Can Help Your Trading
- Identify stronger trends by confirming momentum across multiple timeframes
- Reduce false signals through multi-timeframe confirmation
- Stay informed of market changes with customizable alerts
- Make more informed decisions with comprehensive market data
- Maintain trading discipline with clear visual signals
## 2. Understanding the Display
### The Stochastic Chart
The main chart displays three key components:
1. ** K-Line (Fast) **: The primary stochastic line (default color: green)
2. ** D-Line (Slow) **: The signal line (default color: red)
3. ** Reference Lines **:
- Overbought Level (80): Upper dashed line
- Middle Line (50): Center dashed line
- Oversold Level (20): Lower dashed line
### The Information Table
The table provides a comprehensive view of stochastic readings across all timeframes. Here's what each column means:
#### Column Explanations:
1. ** Timeframe **
- Shows the time period for each row
- Example: "5" = 5 minutes, "15" = 15 minutes, etc.
2. ** K Value **
- The fast stochastic line value (0-100)
- Higher values indicate stronger upward momentum
- Lower values indicate stronger downward momentum
3. ** D Value **
- The slow stochastic line value (0-100)
- Helps confirm momentum direction
- Crossovers with K-line can signal potential trades
4. ** Status **
- Shows current momentum with symbols:
- ▲ = Increasing (bullish)
- ▼ = Decreasing (bearish)
- Color matches the trend direction
5. ** Trend **
- Shows the current market condition:
- "Overbought" (above 80)
- "Bullish" (above 50)
- "Bearish" (below 50)
- "Oversold" (below 20)
#### Row Explanations:
1. ** Title Row **
- Shows "🎯 Multi-Timeframe Stochastic"
- Indicates the indicator is active
2. ** Header Row **
- Contains column titles
- Dark blue background for easy reading
3. ** Timeframe Rows **
- Six rows showing different timeframe analyses
- Each row updates independently
- Color-coded for easy trend identification
4. **Message Row**
- Shows rotating motivational messages
- Updates every 5 bars
- Helps maintain trading discipline
### Visual Indicators and Colors
- ** Green Background **: Indicates bullish conditions
- ** Red Background **: Indicates bearish conditions
- ** Color Intensity **: Shows strength of the signal
- ** Background Highlights **: Appear when alert conditions are met
## 3. Core Settings Groups
### Stochastic Settings
These settings control the core calculation of the stochastic oscillator.
1. ** Length (Default: 14) **
- What it does: Determines the lookback period for calculations
- Higher values (e.g., 21): More stable, fewer signals
- Lower values (e.g., 8): More sensitive, more signals
- Recommended:
* Day Trading: 8-14
* Swing Trading: 14-21
* Position Trading: 21-30
2. ** Smooth K (Default: 3) **
- What it does: Smooths the main stochastic line
- Higher values: Smoother line, fewer false signals
- Lower values: More responsive, but more noise
- Recommended:
* Day Trading: 2-3
* Swing Trading: 3-5
* Position Trading: 5-7
3. ** Smooth D (Default: 3) **
- What it does: Smooths the signal line
- Works in conjunction with Smooth K
- Usually kept equal to or slightly higher than Smooth K
- Recommended: Keep same as Smooth K for consistency
4. ** Source (Default: Close) **
- What it does: Determines price data for calculations
- Options: Close, Open, High, Low, HL2, HLC3, OHLC4
- Recommended: Stick with Close for most reliable signals
### Timeframe Settings
Controls the multiple timeframes analyzed by the indicator.
1. ** Main Timeframes (TF1-TF6) **
- TF1 (Default: 10): Shortest timeframe for quick signals
- TF2 (Default: 15): Short-term trend confirmation
- TF3 (Default: 30): Medium-term trend analysis
- TF4 (Default: 30): Additional medium-term confirmation
- TF5 (Default: 60): Longer-term trend analysis
- TF6 (Default: 240): Major trend confirmation
Recommended Combinations:
* Scalping: 1, 3, 5, 15, 30, 60
* Day Trading: 5, 15, 30, 60, 240, D
* Swing Trading: 15, 60, 240, D, W, M
2. ** Wait for Bar Close (Default: true) **
- What it does: Controls when calculations update
- True: More reliable but slightly delayed signals
- False: Faster signals but may change before bar closes
- Recommended: Keep True for more reliable signals
### Alert Settings
#### Main Alert Settings
1. ** Enable Alerts (Default: true) **
- Master switch for all alert notifications
- Toggle this off when you don't want any alerts
- Useful during testing or when you want to focus on visual signals only
2. ** Alert Condition (Options) **
- "Above Middle": Bullish momentum alerts only
- "Below Middle": Bearish momentum alerts only
- "Both": Alerts for both directions
- Recommended:
* Trending Markets: Choose direction matching the trend
* Ranging Markets: Use "Both" to catch reversals
* New Traders: Start with "Both" until you develop a specific strategy
3. ** Alert Frequency **
- "Once Per Bar": Immediate alerts during the bar
- "Once Per Bar Close": Alerts only after bar closes
- Recommended:
* Day Trading: "Once Per Bar" for quick reactions
* Swing Trading: "Once Per Bar Close" for confirmed signals
* Beginners: "Once Per Bar Close" to reduce false signals
#### Timeframe Check Settings
1. ** First Check (TF1) **
- Purpose: Confirms basic trend direction
- Alert Triggers When:
* For Bullish: Stochastic is above middle line (50)
* For Bearish: Stochastic is below middle line (50)
* For Both: Triggers in either direction based on position relative to middle line
- Settings:
* Enable/Disable: Turn first check on/off
* Timeframe: Default 5 minutes
- Best Used For:
* Quick trend confirmation
* Entry timing
* Scalping setups
2. ** Second Check (TF2) **
- Purpose: Confirms both position and momentum
- Alert Triggers When:
* For Bullish: Stochastic is above middle line AND both K&D lines are increasing
* For Bearish: Stochastic is below middle line AND both K&D lines are decreasing
* For Both: Triggers based on position and direction matching current condition
- Settings:
* Enable/Disable: Turn second check on/off
* Timeframe: Default 15 minutes
- Best Used For:
* Trend strength confirmation
* Avoiding false breakouts
* Day trading setups
3. ** Third Check (TF3) **
- Purpose: Confirms overall momentum direction
- Alert Triggers When:
* For Bullish: Both K&D lines are increasing (momentum confirmation)
* For Bearish: Both K&D lines are decreasing (momentum confirmation)
* For Both: Triggers based on matching momentum direction
- Settings:
* Enable/Disable: Turn third check on/off
* Timeframe: Default 30 minutes
- Best Used For:
* Major trend confirmation
* Swing trading setups
* Avoiding trades against the main trend
Note: All three conditions must be met simultaneously for the alert to trigger. This multi-timeframe confirmation helps reduce false signals and provides stronger trade setups.
#### Alert Combinations Examples
1. ** Conservative Setup **
- Enable all three checks
- Use "Once Per Bar Close"
- Timeframe Selection Example:
* First Check: 15 minutes
* Second Check: 1 hour (60 minutes)
* Third Check: 4 hours (240 minutes)
- Wider gaps between timeframes reduce noise and false signals
- Best for: Swing trading, beginners
2. ** Aggressive Setup **
- Enable first two checks only
- Use "Once Per Bar"
- Timeframe Selection Example:
* First Check: 5 minutes
* Second Check: 15 minutes
- Closer timeframes for quicker signals
- Best for: Day trading, experienced traders
3. ** Balanced Setup **
- Enable all checks
- Use "Once Per Bar"
- Timeframe Selection Example:
* First Check: 5 minutes
* Second Check: 15 minutes
* Third Check: 1 hour (60 minutes)
- Balanced spacing between timeframes
- Best for: All-around trading
### Visual Settings
#### Alert Visual Settings
1. ** Show Background Color (Default: true) **
- What it does: Highlights chart background when alerts trigger
- Benefits:
* Makes signals more visible
* Helps spot opportunities quickly
* Provides visual confirmation of alerts
- When to disable:
* If using multiple indicators
* When preferring a cleaner chart
* During manual backtesting
2. ** Background Transparency (Default: 90) **
- Range: 0 (solid) to 100 (invisible)
- Recommended Settings:
* Clean Charts: 90-95
* Multiple Indicators: 85-90
* Single Indicator: 80-85
- Tip: Adjust based on your chart's overall visibility
3. ** Background Colors **
- Bullish Background:
* Default: Green
* Indicates upward momentum
* Customizable to match your theme
- Bearish Background:
* Default: Red
* Indicates downward momentum
* Customizable to match your theme
#### Level Settings
1. ** Oversold Level (Default: 20) **
- Traditional Setting: 20
- Adjustable Range: 0-100
- Usage:
* Lower values (e.g., 10): More conservative
* Higher values (e.g., 30): More aggressive
- Trading Applications:
* Potential bullish reversal zone
* Support level in uptrends
* Entry point for long positions
2. ** Overbought Level (Default: 80) **
- Traditional Setting: 80
- Adjustable Range: 0-100
- Usage:
* Lower values (e.g., 70): More aggressive
* Higher values (e.g., 90): More conservative
- Trading Applications:
* Potential bearish reversal zone
* Resistance level in downtrends
* Exit point for long positions
3. ** Middle Line (Default: 50) **
- Purpose: Trend direction separator
- Applications:
* Above 50: Bullish territory
* Below 50: Bearish territory
* Crossing 50: Potential trend change
- Trading Uses:
* Trend confirmation
* Entry/exit trigger
* Risk management level
#### Color Settings
1. ** Bullish Color (Default: Green) **
- Used for:
* K-Line (Main stochastic line)
* Status symbols when trending up
* Trend labels for bullish conditions
- Customization:
* Choose colors that stand out
* Match your trading platform theme
* Consider color blindness accessibility
2. ** Bearish Color (Default: Red) **
- Used for:
* D-Line (Signal line)
* Status symbols when trending down
* Trend labels for bearish conditions
- Customization:
* Choose contrasting colors
* Ensure visibility on your chart
* Consider monitor settings
3. ** Neutral Color (Default: Gray) **
- Used for:
* Middle line (50 level)
- Customization:
* Should be less prominent
* Easy on the eyes
* Good background contrast
### Theme Settings
1. **Color Theme Options**
- Dark Theme (Default):
* Dark background with white text
* Optimized for dark chart backgrounds
* Reduces eye strain in low light
- Light Theme:
* Light background with black text
* Better visibility in bright conditions
- Custom Theme:
* Use your own color preferences
2. ** Available Theme Colors **
- Table Background
- Table Text
- Table Headers
Note: The theme affects only the table display colors. The stochastic lines and alert backgrounds use their own color settings.
### Table Settings
#### Position and Size
1. ** Table Position **
- Options:
* Top Right (Default)
* Middle Right
* Bottom Right
* Top Left
* Middle Left
* Bottom Left
- Considerations:
* Chart space utilization
* Personal preference
* Multiple monitor setups
2. ** Text Sizes **
- Title Size Options:
* Tiny: Minimal space usage
* Small: Compact but readable
* Normal (Default): Standard visibility
* Large: Enhanced readability
* Huge: Maximum visibility
- Data Size Options:
* Recommended: One size smaller than title
* Adjust based on screen resolution
* Consider viewing distance
3. ** Empowering Messages **
- Purpose:
* Maintain trading discipline
* Provide psychological support
* Remind of best practices
- Rotation:
* Changes every 5 bars
* Categories include:
- Market Wisdom
- Strategy & Discipline
- Mindset & Growth
- Technical Mastery
- Market Philosophy
## 4. Setting Up for Different Trading Styles
### Day Trading Setup
1. **Timeframes**
- Primary: 5, 15, 30 minutes
- Secondary: 1H, 4H
- Alert Settings: "Once Per Bar"
2. ** Stochastic Settings **
- Length: 8-14
- Smooth K/D: 2-3
- Alert Condition: Match market trend
3. ** Visual Settings **
- Background: Enabled
- Transparency: 85-90
- Theme: Based on trading hours
### Swing Trading Setup
1. ** Timeframes **
- Primary: 1H, 4H, Daily
- Secondary: Weekly
- Alert Settings: "Once Per Bar Close"
2. ** Stochastic Settings **
- Length: 14-21
- Smooth K/D: 3-5
- Alert Condition: "Both"
3. ** Visual Settings **
- Background: Optional
- Transparency: 90-95
- Theme: Personal preference
### Position Trading Setup
1. ** Timeframes **
- Primary: Daily, Weekly
- Secondary: Monthly
- Alert Settings: "Once Per Bar Close"
2. ** Stochastic Settings **
- Length: 21-30
- Smooth K/D: 5-7
- Alert Condition: "Both"
3. ** Visual Settings **
- Background: Disabled
- Focus on table data
- Theme: High contrast
## 5. Troubleshooting Guide
### Common Issues and Solutions
1. ** Too Many Alerts **
- Cause: Settings too sensitive
- Solutions:
* Increase timeframe intervals
* Use "Once Per Bar Close"
* Enable fewer timeframe checks
* Adjust stochastic length higher
2. ** Missed Signals **
- Cause: Settings too conservative
- Solutions:
* Decrease timeframe intervals
* Use "Once Per Bar"
* Enable more timeframe checks
* Adjust stochastic length lower
3. ** False Signals **
- Cause: Insufficient confirmation
- Solutions:
* Enable all three timeframe checks
* Use larger timeframe gaps
* Wait for bar close
* Confirm with price action
4. ** Visual Clarity Issues **
- Cause: Poor contrast or overlap
- Solutions:
* Adjust transparency
* Change theme settings
* Reposition table
* Modify color scheme
### Best Practices
1. ** Getting Started **
- Start with default settings
- Use "Both" alert condition
- Enable all timeframe checks
- Wait for bar close
- Monitor for a few days
2. ** Fine-Tuning **
- Adjust one setting at a time
- Document changes and results
- Test in different market conditions
- Find your optimal timeframe combination
- Balance sensitivity with reliability
3. ** Risk Management **
- Don't trade against major trends
- Confirm signals with price action
- Use appropriate position sizing
- Set clear stop losses
- Follow your trading plan
4. ** Regular Maintenance **
- Review settings weekly
- Adjust for market conditions
- Update color scheme for visibility
- Clean up chart regularly
- Maintain trading journal
## 6. Tips for Success
1. ** Entry Strategies **
- Wait for all timeframes to align
- Confirm with price action
- Use proper position sizing
- Consider market conditions
2. ** Exit Strategies **
- Trail stops using indicator levels
- Take partial profits at targets
- Honor your stop losses
- Don't fight the trend
3. ** Psychology **
- Stay disciplined with settings
- Don't override system signals
- Keep emotions in check
- Learn from each trade
4. ** Continuous Improvement **
- Record your trades
- Review performance regularly
- Adjust settings gradually
- Stay educated on markets

Newday_smaThis algorithm is based on SMA (Simple Moving Average) to identify price trends, detecting "positive price zones" (where the price is above the SMA) and "negative price zones" (where the price is below the SMA), and then connecting turning points within those zones with lines.
Key Steps:
SMA Period Selection: The user can select the SMA period to be 5, 10, or 20.
SMA Calculation: The SMA of the current price is calculated based on the selected period.
Identify Positive and Negative Price Zones:
Positive Price Zone: When the closing price is higher than the SMA, it’s considered a positive price zone.
Negative Price Zone: When the closing price is lower than the SMA, it’s considered a negative price zone.
Identify Turning Points:
In the positive price zone, if the current closing price falls below the SMA, a potential turning point is detected, and the algorithm looks for the lowest point (the lowest high in that zone).
In the negative price zone, if the current closing price rises above the SMA, a potential turning point is detected, and the algorithm looks for the highest point (the highest low in that zone).
Connect the Turning Points:
When transitioning from the negative price zone to the positive price zone, a line is drawn from the lowest point of the negative zone to the highest point of the positive zone.
When transitioning from the positive price zone to the negative price zone, a line is drawn from the highest point of the positive zone to the lowest point of the negative zone.
Dynamic Updates: As new candles form, the algorithm continuously updates the turning points and draws the lines accordingly.
Key Features:
Flexible SMA Period Selection: The user can choose from different SMA periods (5, 10, or 20).
Dynamic Turning Point Recognition: The algorithm dynamically identifies turning points based on the relationship between the price and the SMA, marking fluctuations in price.
Connecting Turning Points: The algorithm connects the key points in positive and negative price zones with lines to help identify price trends.
Use Cases:
This algorithm is useful for technical analysis, especially for short-term trading.
It helps identify support and resistance levels, assisting users in making buy and sell decisions.
Supertrend and MACD strategyThe Supertrend and MACD Strategy is a comprehensive trading approach designed to capitalize on market trends by using a combination of the Supertrend indicator, the Exponential Moving Average (EMA), and the Moving Average Convergence Divergence (MACD). This strategy aims to identify optimal entry and exit points for both long and short trades, while incorporating strict risk management rules.
Indicators Used:
Supertrend: This indicator is used to identify the overall trend direction. It provides clear signals for trend reversals, helping traders to enter trades in the direction of the prevailing trend.
200-period EMA: This long-term moving average is used to determine the primary trend direction. The strategy only takes long trades when the price is above the 200 EMA and short trades when the price is below it.
MACD: The MACD is used to gauge the momentum and confirm the signals provided by the Supertrend and EMA. It consists of the MACD line, the signal line, and the histogram.
Entry Conditions:
Long Entry:
The Supertrend indicator shows an uptrend (direction > 0).
The MACD line is above the signal line (macd > signal).
The price is above the 200-period EMA (close > ema200).
Short Entry:
The Supertrend indicator shows a downtrend (direction < 0).
The MACD line is below the signal line (macd < signal).
The price is below the 200-period EMA (close < ema200).
Exit Conditions:
Long Exit:
Exit the long position when the MACD line crosses below the signal line (ta.crossunder(macd, signal)).
Set a stop loss (SL) below the lowest low of the last 10 periods (lowestLow - 1).
Short Exit:
Exit the short position when the MACD line crosses above the signal line (ta.crossover(macd, signal)).
Set a stop loss (SL) above the highest high of the last 10 periods (highestHigh + 1).
Risk Management:
The strategy ensures that no new positions are opened if there is already an open trade, preventing overexposure in the market.
Alerts:
Alerts are set to notify traders when the MACD crosses the signal line, providing timely updates for potential exit points.

IU Price Density(Market Noise)This Price density Indicator will help you understand what and how market noise is calculated and treated.
Market noise = when the market is moving up and down without any clear direction
The Price Density Indicator is a technical analysis tool used to measure the concentration or "density" of price movements within a specific range. It helps traders differentiate between noisy, choppy markets and trending ones.
I’ve developed a custom Pine Script indicator, "IU Price Density," designed to help traders distinguish between noisy, indecisive markets and clear trading opportunities. It can be applied across multiple markets.
How this work:
Formula = (Σ (High𝑖 - Low𝑖)) / (Max(High) - Min(Low))
Where,
High𝑖 = the high price at the 𝑖 data point.
Low𝑖 = the low price at the 𝑖 data point.
Max(High) = highest price over the data set.
Max(Low) = Lowest price over the data set.
How to use it :
This indicator ranges from 0 to 10
Green(0-3) = Trending Market
Orange(3-6) = Market is normal
Red(6-10) = Noise market
💡 Key Features:
Dynamic Visuals: The indicator uses color-coded signals—green for trending markets and red for noisy, volatile conditions—making it easy to identify optimal trading periods at a glance.
Background Shading: With background colors highlighting significant market conditions, traders can quickly assess when to engage or avoid certain trades.
Customizable Parameters: The length and smoothing factors allow for flexibility in adapting the indicator to various assets and timeframes.
Whether you're a swing trader or an intraday strategist, this tool provides valuable insights to improve your market analysis. I’m excited to bring this indicator to the community!

Asset MaxGain MinLoss Tracker [CHE]Asset MaxGain MinLoss Tracker – Your Tool to Discover the Best Trading Opportunities
Introduction
Hello dear traders,
Today, I'd like to introduce you to a fantastic tool: the Asset MaxGain MinLoss Tracker . This indicator is designed to help you identify the best trading opportunities in the market by analyzing the maximum gain and adjusted maximum loss potentials of various assets.
Why Use This Indicator?
1. Time-Saving Analysis
Instead of spending hours sifting through different charts, this indicator provides you with key metrics for up to 10 assets at a glance.
2. Compare Multiple Assets Simultaneously
Monitor and compare multiple assets to discover which ones offer the highest profit potential and the lowest risk of loss.
3. Customizable Settings
Adjust the observation period and select the assets you want to analyze according to your trading strategy.
4. Clear Visual Representation
Data is presented in an easy-to-read table directly on your chart, highlighting assets with the highest maximum gain and the lowest adjusted maximum loss.
How to Use It in Everyday Trading
Step 1: Setting Up the Indicator
Select Your Assets: Choose up to 10 assets you wish to track. These can be cryptocurrencies, stocks, forex pairs, etc.
Configure the Trading Period Length: Set the number of bars (candles) over which you want to calculate the maximum gain and adjusted maximum loss. This allows you to tailor the analysis to your preferred time frame, whether it's short-term trading or long-term investing.
Step 2: Interpreting the Results
Maximum Gain (%): This value shows the potential upside of each asset over the selected period. A higher percentage indicates a greater potential for profit if the asset's price moves upward.
Adjusted Maximum Loss (%): This figure represents the potential downside risk, adjusted to give a more accurate reflection of loss potential. A lower percentage means less risk of significant loss.
Category Highlighting: Assets are categorized based on their performance:
High Gain & Low Loss: Assets that have both the highest max gain and the lowest adjusted max loss.
High Gain: Assets with the highest max gain.
Low Loss: Assets with the lowest adjusted max loss.
Step 3: Making Trading Decisions
Identify Opportunities: Focus on assets categorized as High Gain & Low Loss for the most favorable risk-to-reward scenarios.
Risk Management: Use the adjusted maximum loss to assess and mitigate potential risks associated with each asset.
Portfolio Diversification: Allocate your investments across assets with varying levels of gain and loss potentials to diversify your portfolio effectively.
Practical Example
Imagine you're monitoring the following assets:
Asset 1: BTCUSD
Asset 2: ETHUSD
Asset 3: ADAUSD
Asset 4: XRPUSD
After applying the indicator:
BTCUSD shows a high maximum gain but also a high adjusted maximum loss.
ETHUSD has both a high maximum gain and a low adjusted maximum loss, categorizing it as High Gain & Low Loss.
ADAUSD indicates a low maximum gain but the lowest adjusted maximum loss.
XRPUSD reflects moderate values in both categories.
Decision Making:
Primary Focus: ETHUSD may be your top choice due to its high reward and lower risk.
Risk-Averse Option: ADAUSD could be considered if you prioritize minimizing losses.
Balanced Approach: Diversify by investing in both ETHUSD and ADAUSD.
Understanding the Core Functionality
While you don't need to delve deep into the code to use the indicator effectively, understanding its core function can enhance your confidence in the tool.
The Main Function: Calculating Max Gain and Adjusted Max Loss
The heart of the indicator is a function that calculates two critical metrics for each asset:
Maximum Gain (sym_MaxGain):
Purpose: Measures the highest potential profit over the selected period.
How It Works: It finds the lowest price (sym_minlow) within the period and calculates the percentage increase to the current high price. This shows how much you could have gained if you bought at the lowest point.
Adjusted Maximum Loss (sym_AdjustedMaxLoss):
Purpose: Provides an adjusted measure of the potential loss, giving a more realistic risk assessment.
How It Works: It identifies the highest price (sym_maxhigh) within the period and calculates the percentage decrease to the current low price. This value is adjusted to account for the diminishing impact as losses approach 100%.
Simplified Explanation of the Function
Data Retrieval: For each asset (sym), the function retrieves the high and low prices over the specified timeframe.
Calculations:
Find Highest and Lowest Prices: Determines sym_maxhigh and sym_minlow within the tracking period.
Compute Max Gain: Calculates the potential gain from sym_minlow to the current high.
Compute Max Loss: Calculates the potential loss from sym_maxhigh to the current low.
Adjust Max Loss: Adjusts the max loss calculation to prevent distortion as losses near 100%.
Output: Returns both sym_MaxGain and sym_AdjustedMaxLoss for further analysis.
Benefits of Understanding the Function
Transparency: Knowing how these values are calculated can increase your trust in the indicator's outputs.
Customization: If you're familiar with coding, you might tailor the function to suit specific trading strategies.
Enhanced Analysis: Understanding the underlying calculations allows you to interpret the results more effectively, aiding in better decision-making.
Conclusion
The Asset MaxGain MinLoss Tracker is a powerful tool that can significantly enhance your trading efficiency and effectiveness by:
Providing Quick Insights: Save time by getting immediate access to essential performance metrics of multiple assets.
Assisting in Risk Management: Use the adjusted maximum loss to understand and mitigate potential risks.
Supporting Strategic Decisions: Identify assets with the best risk-to-reward ratios to optimize your trading strategy.
Take advantage of this indicator to elevate your trading game and make more informed decisions with confidence.
Thank you for your time, and happy trading!
Disclaimer:
The content provided, including all code and materials, is strictly for educational and informational purposes only. It is not intended as, and should not be interpreted as, financial advice, a recommendation to buy or sell any financial instrument, or an offer of any financial product or service. All strategies, tools, and examples discussed are provided for illustrative purposes to demonstrate coding techniques and the functionality of Pine Script within a trading context.
Any results from strategies or tools provided are hypothetical, and past performance is not indicative of future results. Trading and investing involve high risk, including the potential loss of principal, and may not be suitable for all individuals. Before making any trading decisions, please consult with a qualified financial professional to understand the risks involved.
By using this script, you acknowledge and agree that any trading decisions are made solely at your discretion and risk.
This indicator is inspired by the "Max Gain" indicator. A special thanks to Skipper86 for his relentless effort, creativity, and contributions to the TradingView community, which served as a foundation for this work.

RS Cycles [QuantVue]The RS Cycles indicator is a technical analysis tool that expands upon traditional relative strength (RS) by incorporating Beta-based adjustments to provide deeper insights into a stock's performance relative to a benchmark index. It identifies and visualizes positive and negative performance cycles, helping traders analyze trends and make informed decisions.
Key Concepts:
Traditional Relative Strength (RS):
Definition: A popular method to compare the performance of a stock against a benchmark index (e.g., S&P 500).
Calculation: The traditional RS line is derived as the ratio of the stock's closing price to the benchmark's closing price.
RS=Stock Price/Benchmark Price
Usage: This straightforward comparison helps traders spot periods of outperformance or underperformance relative to the market or a specific sector.
Beta-Adjusted Relative Strength (Beta RS):
Concept: Traditional RS assumes equal volatility between the stock and benchmark, but Beta RS accounts for the stock's sensitivity to market movements.
Calculation:
Beta measures the stock's return relative to the benchmark's return, adjusted by their respective volatilities.
Alpha is then computed to reflect the stock's performance above or below what Beta predicts:
Alpha=Stock Return−(Benchmark Return×β)
Significance: Beta RS highlights whether a stock outperforms the benchmark beyond what its Beta would suggest, providing a more nuanced view of relative strength.
RS Cycles:
The indicator identifies positive cycles when conditions suggest sustained outperformance:
Short-term EMA (3) > Mid-term EMA (10) > Long-term EMA (50).
The EMAs are rising, indicating positive momentum.
RS line shows upward movement over a 3-period window.
EMA(21) > 0 confirms a broader uptrend.
Negative cycles are marked when the opposite conditions are met:
Short-term EMA (3) < Mid-term EMA (10) < Long-term EMA (50).
The EMAs are falling, indicating negative momentum.
RS line shows downward movement over a 3-period window.
EMA(21) < 0 confirms a broader downtrend.
This indicator combines the simplicity of traditional RS with the analytical depth of Beta RS, making highlighting true relative strength and weakness cycles.

Daily MAs on Intraday ChartsThis is a very simple, yet powerful indicator, for intraday and swing traders.
The indicator plots price levels of key daily moving averages as horizontal lines onto intraday charts.
The key daily moving averages being:
5-day EMA
10-day EMA
21-day EMA
50-day SMA
100-day SMA
200-day SMA
The moving averages above can be toggled on and off to the users liking and different colours selected to show the locations of daily moving average price levels on intraday charts.
Below is a chart of the SPY on the 30-minute timeframe. The black line represents the price level of the SPY's 10-day EMA, and the blue line represents the price level of the SPY's 21-day EMA.
Key daily moving averages like those mentioned above can be areas of support or resistance for major indexes, ETFs, and individual stocks. Therefore, when using multiple timeframe analysis combining daily charts and intraday charts, it's useful to be aware of these key daily moving average levels for potential reversals.
This indicator clearly shows where the key daily moving average price levels are on intraday charts for the chosen ticker symbol, thus helping traders to identify potential points of interest for trading ideas - i.e., going long or pullbacks into key daily moving averages, or short on rallies into key daily moving averages subject to the trader's thoughts at the time.
By using the 'Daily MAs on Intraday Charts' the trader can now have a multi-chart layout and be easily aware of key price levels from daily moving averages when looking at various intraday timeframe charts such as the 1-minute, 5-minute, 15-minute, 30-minute, 1-hour etc. This can be essential information for opening long and short trading ideas.

Wick Trend Analysis - AYNETScientific Explanation
1. Wick Trend Lines
Upper Wick Trend Line: The upper_wick_trend is calculated as the Simple Moving Average (SMA) of the upper wick lengths over the user-defined period (trend_length).
pinescript
Kodu kopyala
float upper_wick_trend = ta.sma(upper_wick_length, trend_length)
Lower Wick Trend Line: The lower_wick_trend is similarly calculated for the lower wick lengths.
pinescript
Kodu kopyala
float lower_wick_trend = ta.sma(lower_wick_length, trend_length)
2. Filling Between Lines
fill Function: The fill function colors the area between two plotted lines (plot_upper and plot_lower) based on a defined condition.
pinescript
Kodu kopyala
fill(plot_upper, plot_lower, color=fill_color, title="Wick Trend Area")
Condition for Coloring: The color is determined based on whether the upper wick trend is greater or less than the lower wick trend:
Green Fill: Indicates that the upper wick trend is dominant (i.e., upper_wick_trend > lower_wick_trend).
Red Fill: Indicates that the lower wick trend is dominant (i.e., upper_wick_trend <= lower_wick_trend).
Visualization Features
Trend Lines:
Upper wick trend is plotted as a green line.
Lower wick trend is plotted as a red line.
Filled Area:
The area between the two trend lines is filled:
Green when the upper wick trend is dominant.
Red when the lower wick trend is dominant.
Dynamic Adjustments:
The user can adjust the trend_length to change the sensitivity of the SMA calculations.
Applications
Sentiment Analysis:
Green Fill (Upper Trend Dominance): Indicates stronger rejection at higher prices, suggesting bearish sentiment.
Red Fill (Lower Trend Dominance): Indicates stronger rejection at lower prices, suggesting bullish sentiment.
Signal Generation:
Transitions in the fill color (from green to red or vice versa) can serve as potential trade signals.
Volatility Assessment:
Wider gaps between the trend lines indicate higher market volatility, while narrower gaps suggest lower volatility.
Enhancements
1. Trend Strength Filtering
Add thresholds to filter out minor trends or insignificant wick activity:
pinescript
Kodu kopyala
bool significant_upper_wick = upper_wick_length > 10 // Minimum length for upper wick
bool significant_lower_wick = lower_wick_length > 10
2. Alerts for Trend Changes
Trigger alerts when the dominance of the trend changes:
pinescript
Kodu kopyala
alertcondition(upper_wick_trend > lower_wick_trend, title="Upper Wick Dominance", message="Upper wick trend is now dominant.")
alertcondition(lower_wick_trend > upper_wick_trend, title="Lower Wick Dominance", message="Lower wick trend is now dominant.")
3. Combined Wick Analysis
Incorporate total wick activity (upper + lower wicks) for holistic analysis:
pinescript
Kodu kopyala
float total_wick_trend = ta.sma(upper_wick_length + lower_wick_length, trend_length)
Conclusion
This script provides a robust visualization of wick trends with dynamic color filling to indicate trend dominance. By observing the relative strength of upper and lower wick trends, traders can assess market sentiment, detect potential reversals, and gauge volatility. This method can be further enhanced with additional filters, alerts, and composite indicators to refine trading strategies.
Honest Volatility Grid [Honestcowboy]The Honest Volatility Grid is an attempt at creating a robust grid trading strategy but without standard levels.
Normal grid systems use price levels like 1.01;1.02;1.03;1.04... and place an order at each of these levels. In this program instead we create a grid using keltner channels using a long term moving average.
🟦 IS THIS EVEN USEFUL?
The idea is to have a more fluid style of trading where levels expand and follow price and do not stick to precreated levels. This however also makes each closed trade different instead of using fixed take profit levels. In this strategy a take profit level can even be a loss. It is useful as a strategy because it works in a different way than most strategies, making it a good tool to diversify a portfolio of trading strategies.
🟦 STRATEGY
There are 10 levels below the moving average and 10 above the moving average. For each side of the moving average the strategy uses 1 to 3 orders maximum (3 shorts at top, 3 longs at bottom). For instance you buy at level 2 below moving average and you increase position size when level 6 is reached (a cheaper price) in order to spread risks.
By default the strategy exits all trades when the moving average is reached, this makes it a mean reversion strategy. It is specifically designed for the forex market as these in my experience exhibit a lot of ranging behaviour on all the timeframes below daily.
There is also a stop loss at the outer band by default, in case price moves too far from the mean.
What are the risks?
In case price decides to stay below the moving average and never reaches the outer band one trade can create a very substantial loss, as the bands will keep following price and are not at a fixed level.
Explanation of default parameters
By default the strategy uses a starting capital of 25000$, this is realistic for retail traders.
Lot sizes at each level are set to minimum lot size 0.01, there is no reason for the default to be risky, if you want to risk more or increase equity curve increase the number at your own risk.
Slippage set to 20 points: that's a normal 2 pip slippage you will find on brokers.
Fill limit assumtion 20 points: so it takes 2 pips to confirm a fill, normal forex spread.
Commission is set to 0.00005 per contract: this means that for each contract traded there is a 5$ or whatever base currency pair has as commission. The number is set to 0.00005 because pinescript does not know that 1 contract is 100000 units. So we divide the number by 100000 to get a realistic commission.
The script will also multiply lot size by 100000 because pinescript does not know that lots are 100000 units in forex.
Extra safety limit
Normally the script uses strategy.exit() to exit trades at TP or SL. But because these are created 1 bar after a limit or stop order is filled in pinescript. There are strategy.orders set at the outer boundaries of the script to hedge against that risk. These get deleted bar after the first order is filled. Purely to counteract news bars or huge spikes in price messing up backtest.
🟦 VISUAL GOODIES
I've added a market profile feature to the edge of the grid. This so you can see in which grid zone market has been the most over X bars in the past. Some traders may wish to only turn on the strategy whenever the market profile displays specific characteristics (ranging market for instance).
These simply count how many times a high, low, or close price has been in each zone for X bars in the past. it's these purple boxes at the right side of the chart.
🟦 Script can be fully automated to MT5
There are risk settings in lot sizes or % for alerts and symbol settings provided at the bottom of the indicator. The script will send alert to MT5 broker trying to mimic the execution that happens on tradingview. There are always delays when using a bridge to MT5 broker and there could be errors so be mindful of that. This script sends alerts in format so they can be read by tradingview.to which is a bridge between the platforms.
Use the all alert function calls feature when setting up alerts and make sure you provide the right webhook if you want to use this approach.
Almost every setting in this indicator has a tooltip added to it. So if any setting is not clear hover over the (?) icon on the right of the setting.

Exposure Oscillator (Cumulative 0 to ±100%)
Exposure Oscillator (Cumulative 0 to ±100%)
This Pine Script indicator plots an "Exposure Oscillator" on the chart, which tracks the cumulative market exposure from a range of technical buy and sell signals. The exposure is measured on a scale from -100% (maximum short exposure) to +100% (maximum long exposure), helping traders assess the strength of their position in the market. It provides an intuitive visual cue to aid decision-making for trend-following strategies.
Buy Signals (Increase Exposure Score by +10%)
Buy Signal 1 (Cross Above 21 EMA):
This signal is triggered when the price crosses above the 21-period Exponential Moving Average (EMA), where the current bar closes above the EMA21, and the previous bar closed below the EMA21. This indicates a potential upward price movement as the market shifts into a bullish trend.
buySignal1 = ta.crossover(close, ema21)
Buy Signal 2 (Trending Above 21 EMA):
This signal is triggered when the price closes above the 21-period EMA for each of the last 5 bars, indicating a sustained bullish trend. It confirms that the price is consistently above the EMA21 for a significant period.
buySignal2 = ta.barssince(close <= ema21) > 5
Buy Signal 3 (Living Above 21 EMA):
This signal is triggered when the price has closed above the 21-period EMA for each of the last 15 bars, demonstrating a strong, prolonged uptrend.
buySignal3 = ta.barssince(close <= ema21) > 15
Buy Signal 4 (Cross Above 50 SMA):
This signal is triggered when the price crosses above the 50-period Simple Moving Average (SMA), where the current bar closes above the 50 SMA, and the previous bar closed below it. It indicates a shift toward bullish momentum.
buySignal4 = ta.crossover(close, sma50)
Buy Signal 5 (Cross Above 200 SMA):
This signal is triggered when the price crosses above the 200-period Simple Moving Average (SMA), where the current bar closes above the 200 SMA, and the previous bar closed below it. This suggests a long-term bullish trend.
buySignal5 = ta.crossover(close, sma200)
Buy Signal 6 (Low Above 50 SMA):
This signal is true when the lowest price of the current bar is above the 50-period SMA, indicating strong bullish pressure as the price maintains itself above the moving average.
buySignal6 = low > sma50
Buy Signal 7 (Accumulation Day):
An accumulation day occurs when the closing price is in the upper half of the daily range (greater than 50%) and the volume is larger than the previous bar's volume, suggesting buying pressure and accumulation.
buySignal7 = (close - low) / (high - low) > 0.5 and volume > volume
Buy Signal 8 (Higher High):
This signal occurs when the current bar’s high exceeds the highest high of the previous 14 bars, indicating a breakout or strong upward momentum.
buySignal8 = high > ta.highest(high, 14)
Buy Signal 9 (Key Reversal Bar):
This signal is generated when the stock opens below the low of the previous bar but rallies to close above the previous bar’s high, signaling a potential reversal from bearish to bullish.
buySignal9 = open < low and close > high
Buy Signal 10 (Distribution Day Fall Off):
This signal is triggered when a distribution day (a day with high volume and a close near the low of the range) "falls off" the rolling 25-bar period, indicating the end of a bearish trend or selling pressure.
buySignal10 = ta.barssince(close < sma50 and close < sma50) > 25
Sell Signals (Decrease Exposure Score by -10%)
Sell Signal 1 (Cross Below 21 EMA):
This signal is triggered when the price crosses below the 21-period Exponential Moving Average (EMA), where the current bar closes below the EMA21, and the previous bar closed above it. It suggests that the market may be shifting from a bullish trend to a bearish trend.
sellSignal1 = ta.crossunder(close, ema21)
Sell Signal 2 (Trending Below 21 EMA):
This signal is triggered when the price closes below the 21-period EMA for each of the last 5 bars, indicating a sustained bearish trend.
sellSignal2 = ta.barssince(close >= ema21) > 5
Sell Signal 3 (Living Below 21 EMA):
This signal is triggered when the price has closed below the 21-period EMA for each of the last 15 bars, suggesting a strong downtrend.
sellSignal3 = ta.barssince(close >= ema21) > 15
Sell Signal 4 (Cross Below 50 SMA):
This signal is triggered when the price crosses below the 50-period Simple Moving Average (SMA), where the current bar closes below the 50 SMA, and the previous bar closed above it. It indicates the start of a bearish trend.
sellSignal4 = ta.crossunder(close, sma50)
Sell Signal 5 (Cross Below 200 SMA):
This signal is triggered when the price crosses below the 200-period Simple Moving Average (SMA), where the current bar closes below the 200 SMA, and the previous bar closed above it. It indicates a long-term bearish trend.
sellSignal5 = ta.crossunder(close, sma200)
Sell Signal 6 (High Below 50 SMA):
This signal is true when the highest price of the current bar is below the 50-period SMA, indicating weak bullishness or a potential bearish reversal.
sellSignal6 = high < sma50
Sell Signal 7 (Distribution Day):
A distribution day is identified when the closing range of a bar is less than 50% and the volume is larger than the previous bar's volume, suggesting that selling pressure is increasing.
sellSignal7 = (close - low) / (high - low) < 0.5 and volume > volume
Sell Signal 8 (Lower Low):
This signal occurs when the current bar's low is less than the lowest low of the previous 14 bars, indicating a breakdown or strong downward momentum.
sellSignal8 = low < ta.lowest(low, 14)
Sell Signal 9 (Downside Reversal Bar):
A downside reversal bar occurs when the stock opens above the previous bar's high but falls to close below the previous bar’s low, signaling a reversal from bullish to bearish.
sellSignal9 = open > high and close < low
Sell Signal 10 (Distribution Cluster):
This signal is triggered when a distribution day occurs three times in the rolling 7-bar period, indicating significant selling pressure.
sellSignal10 = ta.valuewhen((close < low) and volume > volume , 1, 7) >= 3
Theme Mode:
Users can select the theme mode (Auto, Dark, or Light) to match the chart's background or to manually choose a light or dark theme for the oscillator's appearance.
Exposure Score Calculation: The script calculates a cumulative exposure score based on a series of buy and sell signals.
Buy signals increase the exposure score, while sell signals decrease it. Each signal impacts the score by ±10%.
Signal Conditions: The buy and sell signals are derived from multiple conditions, including crossovers with moving averages (EMA21, SMA50, SMA200), trend behavior, and price/volume analysis.
Oscillator Visualization: The exposure score is visualized as a line on the chart, changing color based on whether the exposure is positive (long position) or negative (short position). It is limited to the range of -100% to +100%.
Position Type: The indicator also indicates the position type based on the exposure score, labeling it as "Long," "Short," or "Neutral."
Horizontal Lines: Reference lines at 0%, 100%, and -100% visually mark neutral, increasing long, and increasing short exposure levels.
Exposure Table: A table displays the current exposure level (in percentage) and position type ("Long," "Short," or "Neutral"), updated dynamically based on the oscillator’s value.
Inputs:
Theme Mode: Choose "Auto" to use the default chart theme, or manually select "Dark" or "Light."
Usage:
This oscillator is designed to help traders track market sentiment, gauge exposure levels, and manage risk. It can be used for long-term trend-following strategies or short-term trades based on moving average crossovers and volume analysis.
The oscillator operates in conjunction with the chart’s price action and provides a visual representation of the market’s current trend strength and exposure.
Important Considerations:
Risk Management: While the exposure score provides valuable insight, it should be combined with other risk management tools and analysis for optimal trading decisions.
Signal Sensitivity: The accuracy and effectiveness of the signals depend on market conditions and may require adjustments based on the user’s trading strategy or timeframe.
Disclaimer:
This script is for educational purposes only. Trading involves significant risk, and users should carefully evaluate all market conditions and apply appropriate risk management strategies before using this tool in live trading environments.

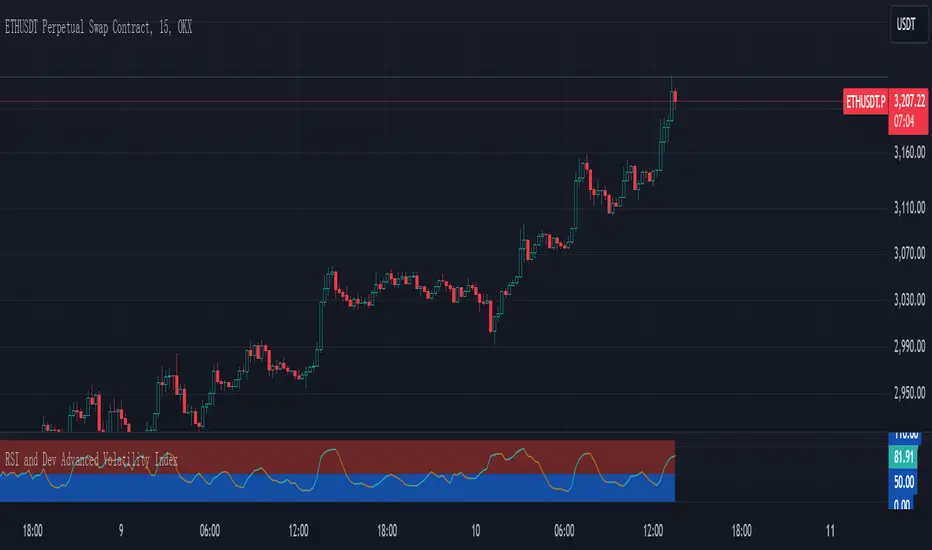
RSI and Dev Advanced Volatility IndexEnglish Explanation of the "RSI and Dev Advanced Volatility Index" Pine Script Code
Understanding the Code
Purpose:
This Pine Script code creates a custom indicator that combines the Relative Strength Index (RSI) and Deviation (DEV) to provide insights into market volatility.
Key Components:
* Deviation (DEV): Calculates the difference between the closing price and the 10-period simple moving average. This measures the extent to which the price deviates from its recent average, indicating volatility.
* RSI: The traditional RSI is then applied to the calculated deviations. This helps to smooth the data and identify overbought or oversold conditions in terms of volatility.
Calculation Steps:
* Deviation Calculation: The difference between the closing price and its 10-period simple moving average is calculated.
* RSI Calculation: The RSI is calculated on the deviations, providing a measure of the speed and change of volatility relative to recent volatility changes.
* Plotting:
* The RSI of the deviations is plotted on the chart.
* Horizontal lines are plotted at 50, 0, and 110 to visually represent different volatility zones.
* The area between the lines is filled with color to highlight low and high volatility regions.
Interpretation and Usage
* Volatility Analysis:
* High Volatility: When the RSI is above 50, it indicates high volatility, suggesting the market might be in a consolidation or trend reversal phase.
* Low Volatility: When the RSI is below 50, it indicates low volatility, suggesting a relatively calm market.
* Trading Signals:
* Buy Signal: When the RSI crosses above 50 from below, it might signal increasing volatility, which could be a buying opportunity.
* Sell Signal: When the RSI crosses below 50 from above, it might signal decreasing volatility, which could be a selling opportunity.
* Risk Management:
* By monitoring volatility, traders can better manage their risk. During periods of high volatility, traders might reduce their position size or adopt more conservative strategies.
Advantages
* Comprehensive: Combines RSI and DEV for a more holistic view of volatility.
* Sensitivity: Quickly responds to changes in market volatility.
* Visual Clarity: Color-coded zones provide a clear visual representation of different volatility levels.
Limitations
* Parameter Sensitivity: The indicator's performance is sensitive to parameter changes, such as the lookback period for the moving average.
* Lag: Like most technical indicators, it has some lag and might not capture every market movement.
* Not Predictive: It can only indicate current and past volatility, not future movements.
Summary
This custom indicator offers a valuable tool for analyzing market volatility. By combining RSI and DEV, it provides a more nuanced perspective on price fluctuations. However, it should be used in conjunction with other technical indicators and fundamental analysis for more robust trading decisions.
Key points to remember:
* Higher RSI values indicate higher volatility.
* Lower RSI values indicate lower volatility.
* Crossovers of the RSI line above or below 50 can provide potential trading signals.
* The indicator should be used in conjunction with other analysis tools for a more complete picture of the market.
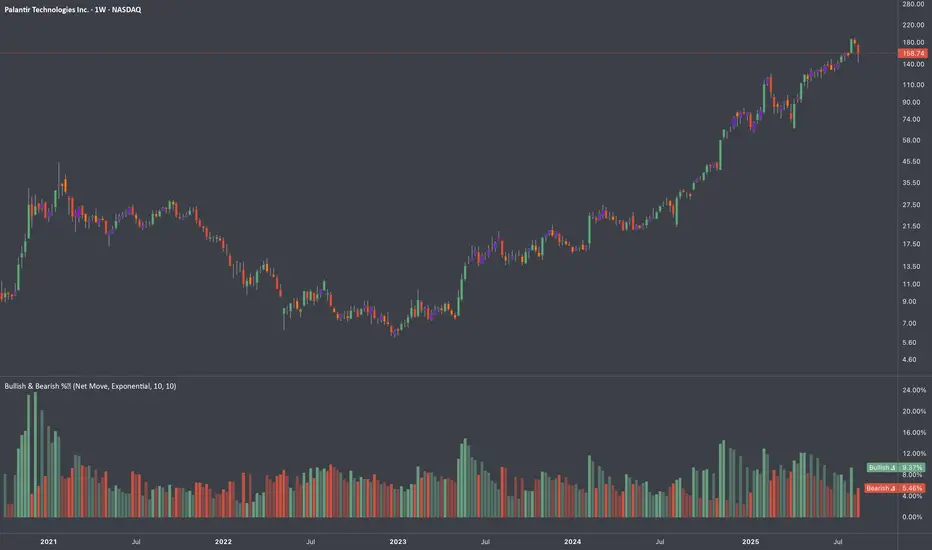
Average Bullish & Bearish Percentage ChangeAverage Bullish & Bearish Percentage Change
Processes two key aspects of directional market movements relative to price levels. Unlike traditional momentum tools, it separately calculates the average of positive and negative percentage changes in price using user-defined independent counts of actual past bullish and bearish candles. This approach delivers comprehensive and precise view of average percentage changes.
FEATURES:
Count-Based Averages: Separate averaging of bullish and bearish %𝜟 based on their respective number of occurrences ensures reliable and precise momentum calculations.
Customizable Averaging: User-defined number of candle count sets number of past bullish and bearish candles used in independent averaging.
Two Methods of Candle Metrics:
1. Net Move: Focuses on the body range of the candle, emphasizing the net directional movement.
2. Full Capacity: Incorporates wicks and gaps to capture full potential of the bar.
The indicator classifies Doji candles contextually, ensuring they are appropriately factored into the bullish or bearish metrics to avoid mistakes in calculation:
1. Standard Doji - open equals close.
2. Flat Close Doji - Candles where the close matches the previous close.
Timeframe Flexibility:
The indicator can be applied across any desired timeframe, allowing for seamless multi-timeframe analysis.
HOW TO USE
Select Method of Bar Metrics:
Net Move: For analyzing markets where price changes are consistent and bars are close to each other.
Full Capacity: Incorporates wicks and gaps, providing relevant figures for markets like stocks
Set the number of past candles to average:
🟩 Average Past Bullish Candles (Default: 10)
🟥 Average Past Bullish Candles (Default: 10)
Why Percentage Change Is Important
Standardized Measurement Across Assets:
Percentage change normalizes price movements, making it easier to compare different assets with varying price levels. For example, a $1 move in a $10 stock is significant, but the same $1 move in a $1,000 stock is negligible.
Highlights Relative Impact:
By measuring the price change as a percentage of the close, traders can better understand the relative impact of a move on the asset’s overall value.
Volatility Insights:
A high percentage change indicates heightened volatility, which can be a signal of potential opportunities or risks, making it more actionable than raw price changes. Percents directly reflect the strength of buying or selling pressure, providing a clearer view of momentum compared to raw price moves, which may not account for the relative size of the move.
By focusing on percentage change, this indicator provides a normalized, actionable, and insightful measure of market momentum, which is critical for comparing, analyzing, and acting on price movements across various assets and conditions.
Enhanced Pressure MTF ScreenerEnhanced Pressure Multi-Timeframe (MTF) Screener Indicator
Overview
The Enhanced Pressure MTF Screener is an add-on that extends the capabilities of the Enhanced Buy/Sell Pressure, Volume, and Trend Bar Analysis . It provides a clear and consolidated view of buy/sell pressure across multiple timeframes. This indicator allows traders to determine when different timeframes are synchronized in the same trend direction, which is particularly useful for making high-confidence trading decisions.
Image below: is the Enhanced Buy/Sell Pressure, Volume, and Trend Bar Analysis with the Enhanced Pressure MTF Screener indicator both active together.
Key Features
1.Multi-Timeframe Analysis
The indicator screens various predefined timeframes (from 1 week down to 10 minutes).
It offers a table view that shows buy or sell ratings for each timeframe, making it easy to see which timeframes are aligned.
Traders can choose which timeframes to include based on their trading strategies (e.g., higher timeframes for position trading, lower timeframes for scalping).
2.Pressure and Trend Calculation
Uses Buy and Sell Pressure calculations from the Enhanced Buy/Sell Pressure indicator to determine whether buying or selling is dominant in each timeframe.
By analyzing pressures on multiple timeframes, the indicator gives a comprehensive perspective of the current market sentiment.
The indicator calculates whether a move is strong based on user-defined thresholds, which are displayed in the form of additional signals.
3.Heikin Ashi Option
The Heikin Ashi candle type can be toggled on or off. Using Heikin Ashi helps smooth out market noise and provides a clearer indication of trend direction.
This is particularly helpful for traders who want to filter out market noise and focus on the primary trend.
4.Table Customization
Table Positioning: The table showing timeframe data can be positioned at different locations on the chart—top, middle, or bottom.
Text and Alignment: The alignment and text size of the table can be customized for better visual clarity.
Color Settings: Users can choose specific colors to indicate buying and selling pressure across timeframes, making it easy to interpret.
5.Strong Movement Indicators
The screener provides an additional visual cue (🔥) for timeframes where the movement is deemed strong, based on a user-defined threshold.
This helps highlight timeframes where significant buying or selling pressure is present, which could signal potential trading opportunities.
How the Screener Works
1.Pressure Calculation
For each selected timeframe, the indicator retrieves the Open, High, Low, and Close (OHLC) values.
It calculates buy pressure (the range between high and low when the closing price is higher than the opening) and sell pressure (the range between high and low when the closing price is equal to or lower than the opening).
The screener computes the pressure ratio, which represents the difference between buying and selling pressure, to determine which side is dominant.
2.Trend Rating and Signal Generation
Based on the calculated pressure, the screener determines a trend rating for each timeframe: "Buy," "Sell," or "Neutral." (▲ ,▼ or •)
Additionally, it generates a signal (▲ or ▼) to indicate the current trend direction and whether the move is strong (based on the user-defined threshold).
If the movement is strong, a fire icon (🔥) is added to indicate that there is significant pressure on that timeframe, signaling a higher confidence in the trend.
3.Customizable Strong Move Thresholds
Strong Move Threshold: The screener uses this value to decide whether a trend is significantly strong. A higher value makes it more selective in determining strong moves.
Strong Movement Threshold: Helps determine when an additional strong signal should be displayed, offering further insight into the strength of market movement.
Inputs and Customization
The Enhanced Pressure MTF Screener is highly customizable to fit the needs of individual traders:
General Settings:
Use Heikin Ashi: Toggle this setting to use Heikin Ashi for a smoother trend representation.
Strong Move Threshold: Defines how strong a move should be to be considered significant.
Strong Movement Threshold: Specifies the level of pressure required to highlight a move with the fire icon.
Table Settings:
Position: Choose the vertical position of the screener table (top, middle, or bottom of the chart).
Alignment: Align the table (left, center, or right) to best suit your chart layout.
Text Size: Adjust the text size in the table for better readability.
Table Color Settings:
Users can set different colors to represent buying and selling signals for better visual clarity, particularly when scanning multiple timeframes.
Timeframe Settings:
The screener provides options to include up to ten different timeframes. Traders can select and customize each timeframe to match their strategy.
Examples of available timeframes include 1 Week, 1 Day, 12 Hours, down to 10 Minutes, allowing for both broad and detailed analysis.
Practical Use Case
Identifying Trend Alignment Across Timeframes:
Imagine you are about to take a long trade but want to make sure that the trend direction is aligned across multiple timeframes.
The screener displays "Buy" ratings across the 4H, 1H, 30M, and 10M timeframes, while higher timeframes (like 1W and 1D) also show "Buy" with strong signals (🔥). This indicates that buying pressure is strong across the board, adding confidence to your trade.
Spotting Reversal Opportunities:
If a downtrend is evident across most timeframes but suddenly a higher timeframe, such as 12H, changes to "Buy" while showing a strong move (🔥), this could indicate a potential reversal.
The screener allows you to spot these discrepancies and consider taking early action.
Benefits for Traders
1.Synchronization Across Timeframes:
One of the main strengths of this screener is its ability to show synchronized buy/sell signals across different timeframes. This makes it easy to confirm the strength and consistency of a trend.
For example, if you see that all the selected timeframes display "Buy," this implies that both short-term and long-term traders are favoring the upside, giving additional confidence to go long.
2.Quick and Visual Trend Overview:
The table offers an at-a-glance summary, reducing the time required to manually inspect each timeframe.
This makes it particularly useful for traders who want to make quick decisions, such as day traders or scalpers.
3.Strong Move Indicator:
The use of fire icons (🔥) provides an easy way to identify significant movements. This is particularly helpful for traders looking for breakouts or strong market conditions that could lead to high probability trades.
To put it short or to summarize
The Enhanced Pressure MTF Screener is a powerful add-on for traders looking to understand how buy and sell pressure aligns across multiple timeframes. It offers:
A clear summary of buying or selling pressure across different timeframes.
Heikin Ashi smoothing, providing an option to reduce market noise.
Strong movement signals to highlight significant trading opportunities.
Customizable settings to fit any trading strategy or style.
The screener and the main indicator are best used together, as the screener provides the multi-timeframe overview, while the main indicator provides an in-depth look at each individual bar and trend.
I hope my indicator helps with your trading, if you guys have any ideas or questions there is the comment section :D

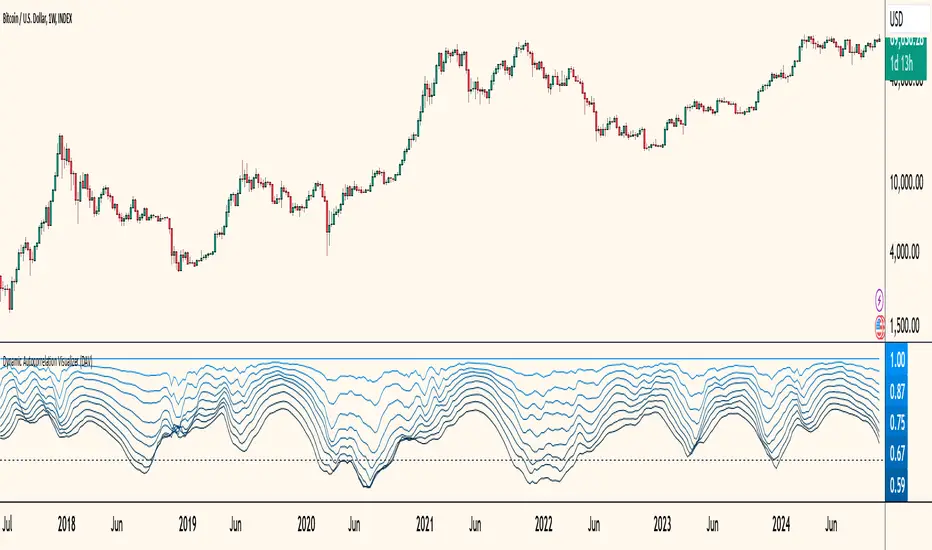
Dynamic Autocorrelation Visualizer (YavuzAkbay)The Dynamic Autocorrelation Visualizer (DAV) is a specialized indicator that analyzes and displays the autocorrelation of closing prices over multiple time lags. The autocorrelation function is a well-established economic calculation that measures how past price movements correlate with current prices at various intervals. This indicator implements this function to provide traders with insights into how these correlations evolve over time, enabling them to identify shifts in market behavior and trends.
Key Features and Functionality
1. Input Parameters:
Max Lag: This parameter determines the maximum number of lags for which the autocorrelation will be calculated. By default, it is set to 10, allowing traders to observe the correlation from the most recent price up to 10 periods back.
Calculation Period: The period over which the autocorrelation is calculated, set by default to 50. This setting allows users to adapt the analysis to different time frames depending on their trading strategies.
2. Autocorrelation Calculation:
The DAV calculates the average closing price over the specified period using the Simple Moving Average (SMA). This average serves as a reference point for measuring deviations in price behavior.
It then computes the denominator for the autocorrelation formula, which is the sum of the squared differences between each closing price and the average price. This normalization ensures that the autocorrelation values are meaningful and statistically valid.
For each specified lag (from 0 to max_lag - 1), the indicator calculates the numerator by summing the product of deviations from the mean for both the current and lagged prices. The autocorrelation value for each lag is then derived by dividing the numerator by the denominator, producing a set of autocorrelation values that reflect the strength and direction of price relationships over time.
3. Visualization:
The results for each lag's autocorrelation are plotted as individual lines on the chart, each differentiated by color to represent different lag periods.
A zero line is drawn as a reference, helping traders easily identify when autocorrelation values cross from positive to negative or vice versa.
The color gradient from the brightest blue (for lag 1) to darker shades indicates the relative strength of the autocorrelation for each lag, providing an immediate visual cue for analysis.
Indicator is Useful for
Seeing how correlation patterns evolve
Identifying periods where the market changes its behavior
Spotting when certain lag patterns become more or less significant
How to Use the DAV Indicator
Before using the indicator, it should be backtested on the chart and the mechanics should be learned. In general, if all lags of the indicator are above 0, it means that the trend is continuing. When the lags start to fall below 0 one by one, it means a trend reversal or instability. The indicator is in a sense a 90 degree freeze trace of the Autocorrelation indicator that I have also integrated into Tradingview (available in my profile), so it may be more understandable if used in conjunction with this indicator.
Smart Ribbon V2 [FXSMARTLAB]The Smart Ribbon V2 indicator is designed to analyze market trends and momentum by plotting a series of moving averages with varying periods, all within a single overlay on the price chart. This approach creates a "ribbon" effect, enabling traders to visualize trend strength, reversals, and potential entry or exit points. The indicator provides flexibility through different moving average types, including some advanced ones like QUEMA (Quadruple Exponential Moving Average) and QuintEMA (Quintuple Exponential Moving Average). Each moving average is color-coded to indicate trend direction and momentum, making it visually intuitive and effective for quick decision-making in trend-following strategies.
The Smart Ribbon V2 helps traders:
Identify Trend Direction
Gauge Momentum
Spot Trend Reversals
Determine Entry and Exit Points
Detailed Explanation of QUEMA and QuintEMA
The QUEMA (Quadruple Exponential Moving Average) and QuintEMA (Quintuple Exponential Moving Average) are advanced smoothing techniques that build on traditional exponential moving averages (EMAs). Both offer higher sensitivity to recent price changes than standard EMAs by adding layers of exponential smoothing. These moving averages are particularly useful for traders looking for a more responsive indicator without the noise often present in shorter-period EMAs.
QUEMA (Quadruple Exponential Moving Average)
The QUEMA is calculated by applying the EMA calculation four times in succession. This method smooths out fluctuations in the price data, creating a balance between sensitivity to recent data and resistance to short-term noise.
The mathematical formula for QUEMA is:
QUEMA=4×EMA1−6×EMA2+4×EMA3−EMA4
This formula results in a moving average that is smoother than a triple EMA (TEMA) and provides a better response to price trends without excessive lag.
QuintEMA (Quintuple Exponential Moving Average)
The QuintEMA goes one step further by applying the EMA calculation five times in a row. This level of exponential smoothing is useful for identifying strong, persistent trends while remaining adaptive to recent price shifts.
The QuintEMA is calculated as :
QuintEMA=5×EMA1−10×EMA2+10×EMA3−5×EMA4+EMA5
The additional layer in QuintEMA further reduces the impact of short-term price fluctuations, making it especially useful in strongly trending markets.
The Smart Ribbon V2 combines the benefits of several moving average types to deliver a versatile tool for analyzing market trends, momentum, and potential reversals. With QUEMA and QuintEMA as advanced options, it allows traders to tailor the indicator to match their preferred trading style, whether it involves higher responsiveness or smoother trend visualization. This adaptability makes Smart Ribbon V2 a powerful choice for both novice and experienced traders seeking to improve their trend-following and market analysis strategies.
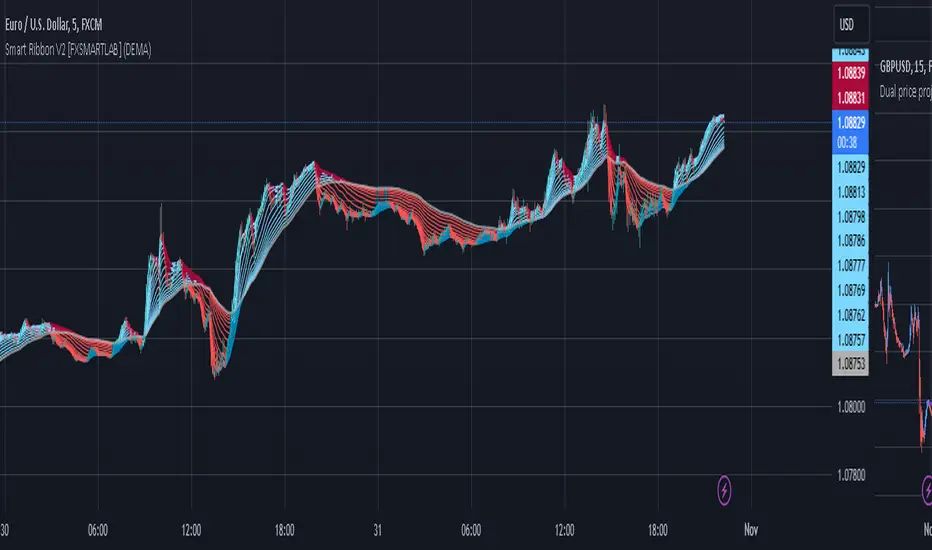
Volume/Price Divergence v2The "Volume/Price Divergence v2" indicator is designed to analyze the relationship between volume and price movements in a financial market. It helps traders identify potential divergences that may indicate a change in market trends. Here’s a breakdown of how it works:
### Key Components
1. **Volume Calculation**:
- **Buying Volume**: This is calculated based on the relationship between the closing price and the high/low range. If the closing price is closer to the low, more volume is attributed to buying.
- **Selling Volume**: Conversely, if the closing price is closer to the high, more volume is considered selling.
The formulas used are:
```pinescript
buyVolume = high == low ? 0 : volume * (close - low) / (high - low)
sellVolume = high == low ? 0 : volume * (high - close) / (high - low)
```
2. **Plotting Volume**:
- The total volume is plotted in red and buying volume is plotted in teal. This helps visualize the volume distribution during different price movements.
3. **Rate of Change (ROC)**:
- The indicator calculates the rate of change for both volume and price over a specified period. This allows traders to see how volume and price are changing relative to each other.
```pinescript
roc = source / source
roc2 = source2 / source2
```
4. **Volume/Price Divergence (VPD)**:
- The VPD is derived from the ratio of the ROC of volume to the ROC of price. This ratio helps identify divergences:
- A VPD significantly above 10 may indicate strong divergence, suggesting that price movements are not supported by volume.
- A VPD around 1 indicates that volume and price are moving in harmony.
5. **Horizontal Lines**:
- The indicator includes horizontal lines at levels 10 (high divergence) and 1 (low divergence), serving as visual cues for traders to assess the market's state.
### Interpretation
- **Divergence**: If price makes a new high but volume does not follow (or vice versa), it may signal a potential reversal or weakness in the trend.
- **Volume Trends**: Analyzing the buying vs. selling volume can provide insights into market sentiment, helping traders make informed decisions.
- **Potential for a Strong Move**: A high VPD during a breakout indicates that while volume is increasing, the price isn’t moving significantly, suggesting that a big price move could be imminent.
- **Caution Before Entry**: Traders should be aware that the lack of price movement relative to high volume may signal an impending volatility spike, which could lead to a rapid price change in either direction.
Overall, this indicator is useful for traders looking to gauge the strength of price movements and identify potential reversals or breakouts based on volume trends.

MMRI Chart (Primary)The **Mannarino Market Risk Indicator (MMRI)** is a financial risk measurement tool created by financial strategist Gregory Mannarino. It’s designed to assess the risk level in the stock market and economy based on current bond market conditions and the strength of the U.S. dollar. The MMRI considers factors like the U.S. 10-Year Treasury Yield and the Dollar Index (DXY), which indicate investor confidence in government debt and the dollar's purchasing power, respectively.
The formula for MMRI uses the 10-Year Treasury Yield multiplied by the Dollar Index, divided by a constant (1.61) to normalize the risk measure. A higher MMRI score suggests increased market risk, while a lower score indicates more stability. Mannarino has set certain thresholds to interpret the MMRI score:
- **Below 100**: Low risk.
- **100–200**: Moderate risk.
- **200–300**: High risk.
- **Above 300**: Extreme risk, indicating market instability and potential downturns.
This tool aims to provide insight into economic conditions that may affect asset classes like stocks, bonds, and precious metals. Mannarino often updates MMRI scores and risk analyses in his public market updates.
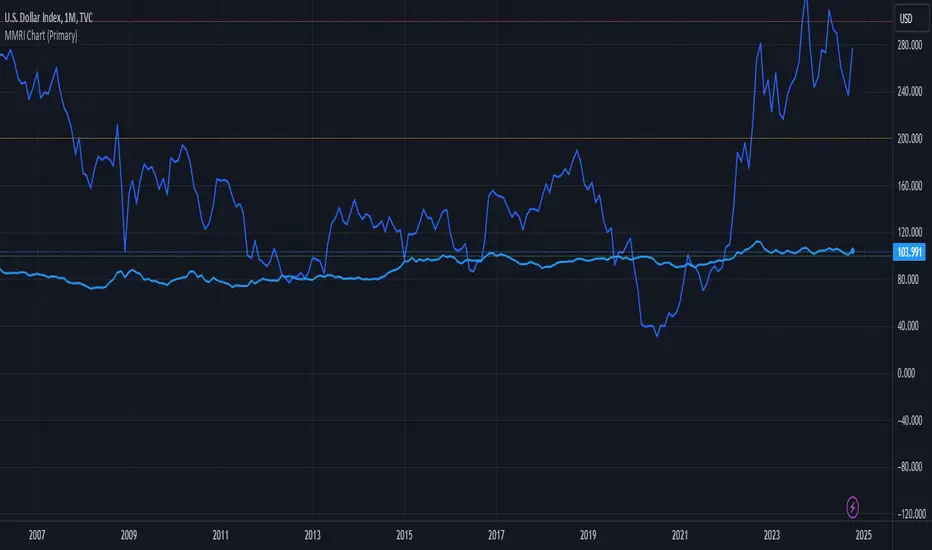
ICT Open Range Gap & 1st FVG (fadi)In his 2024 mentorship program, ICT detailed how price action interacts with Open Range Gaps and the initial 1-minute Fair Value Gap following the market open at 9:30 AM.
What is an Open Range Gap?
An Open Range Gap occurs when the market opens at 9:30 AM at a higher or lower level compared to the previous day's close at 4:14 PM, primarily relevant in futures trading. According to ICT, there is a statistical probability of 70% that the price action will close 50% or more of the Open Range Gap within the first 30 minutes of trading (9:30 AM to 10:00 AM).
What is the First 1-Minute Fair Value Gap?
ICT places significant emphasis on the first 1-minute Fair Value Gap (FVG) that forms after the market opens at 9:30 AM. The FVG must occur at 9:31 AM or later to be considered valid. This gap often presents key opportunities for traders, as it represents a temporary imbalance between supply and demand that the market seeks to correct.
Understanding and leveraging these patterns can enhance trading strategies by offering insights into potential price movements shortly after market open.
ICT Open Range Gap & 1st FVG
This indicator is engineered to identify and highlight the Open Range Gaps and the first 1-minute Fair Value Gap. Furthermore, it functions across multiple timeframes, from seconds to hours, catering to various trading preferences. This flexibility is particularly beneficial for traders who favor higher timeframes or wish to observe these patterns' application at broader intervals.
Settings
The Open Range Gap indicator offers flexible display settings. It identifies the quadrants and provides optional color coding to distinguish them. Additionally, it tracks the "fill" level to visualize how far the price action has progressed into the gap, enhancing traders' ability to monitor and analyze price movements effectively. By default, the Open Range Gap will stop extending at 10:00 AM; however, there is an option to continue extending until the end of the trading day.
The 1st Fair Value Gap (FVG) can be viewed on any timeframe the indicator is active on, offering various styling options to match each trader's preferences. While the 1st FVG is particularly relevant to the day it is created, previous 1st FVGs within the same week may provide additional value. This indicator allows traders to extend Monday's 1st FVG, marking the first FVG of the week, or to extend all 1st FVGs throughout the week.

Range Tightening Indicator (RTI)The Range Tightening Indicator (RTI) quantifies price volatility relative to recent price action, helping traders identify low-volatility consolidations that often precede breakouts.
Range Tightening is calculated by measuring the range between each bar’s high and low prices over a chosen lookback period.
A 5-bar period is recommended for shorter-term momentum setups and a 15-bar period is recommended for swing trading. An option for a custom period is available to suit specific strategies. The default look back for custom is 50, ideal for longer term traders.
Other Key Features:
Dynamic Color Coding: The RTI line turns green when volatility doubles after a drop to or below 20, flagging significant volatility shifts commonly seen before breakouts.
Low-Volatility Dots: Orange dots appear on the RTI line when two or more consecutive bars show RTI values below 20, visually marking extended low-volatility periods.
Volatility Zones: Shaded zones provide quick context:
Zone 1 (0-5): Extremely tight volatility, shown in red.
Zone 2 (5-10): Low volatility, shown in light green.
Zone 3 (10-15): Moderate low volatility, shown in green.
The RTI indicator is ideal for traders looking to anticipate breakout conditions, with features that highlight consolidation phases, support momentum strategies, and help improve entry timing by focusing on shifts in volatility.
This indicator was inspired after Deepvue's RMV Indicator, but uses a different calculation. Results may vary.

Market Phases [OmegaTools]The Market Phases indicator utilizes the Detrended Price Oscillator (DPO) to assess various asset classes, bonds, or stock sectors across different market phases. It offers users the ability to monitor and compare trends in multiple markets through a normalized DPO approach, providing insights into relative overbought or oversold conditions. The indicator supports three distinct modes: "Asset Classes," "Bonds," and "Stock Sectors," allowing flexibility in market analysis based on user preference.
Key Features:
Detrended Price Oscillator (DPO) Calculation: The DPO is computed to remove longer-term trends and focus on shorter-term cyclical behavior. The indicator applies normalization using linear interpolation to smooth out the values for better comparison across different markets.
Three Analysis Modes:
Asset Classes: Compares the DPO for major asset classes, including stocks (S&P 500), bonds (US 10-Year), commodities (Gold), and the US Dollar Index (DXY).
Bonds: Analyzes the DPO across various bond categories such as investment-grade bonds (LQD), high-yield bonds (HYG), emerging market bonds (EMB), and corporate bonds.
Stock Sectors: Provides insight into key stock sectors, including Technology (XLK), Utilities (XLU), Financials (XLF), and Healthcare (XLV).
Real-Time Plotting:
The indicator plots the DPO values of the selected assets, bonds, or sectors on the chart. It provides a visual representation of the market phases, helping to identify potential market reversals or trends. Each plot is color-coded for clarity:
Blue: Asset/Sector 1
Red: Asset/Sector 2
Green: Asset/Sector 3
Orange: Asset/Sector 4
Table Display:
A dynamic table is displayed on the chart, showing the DPO values for the selected mode's assets or sectors. This allows quick comparison and evaluation of market trends.
Inputs:
DPO Length: Defines the lookback period for DPO calculation, adjustable between 10 and 500.
Normalization Length: Sets the length for normalizing the DPO values, with options ranging from 100 to 2000.
Mode: Choose between "Asset Classes," "Bonds," or "Stock Sectors" for tailored market analysis.
This tool is perfect for traders seeking to identify cyclical market phases, compare different asset classes, or monitor sector rotation dynamics. Use it to align your trading strategies with broader market trends and uncover potential trading opportunities across multiple markets.

Multiple SMA, EMA, and VWAP CrossoversMultiple SMA, EMA, and VWAP Crossovers with Alerts
Overview : The "Multiple SMA, EMA, and VWAP Crossovers" script is designed for traders who want to monitor various simple moving averages (SMAs), exponential moving averages (EMAs), and the volume-weighted average price (VWAP) to identify potential buy and sell opportunities. This script allows you to visualize key moving averages on your chart and create custom alerts for specific crossover events.
Detail s: This script plots the following moving averages:
Simple Moving Averages (SMA): 5, 10, 20, 50, 100, 200, and 325 periods
Exponential Moving Average (EMA): 9 periods
Volume-Weighted Average Price (VWAP)
It includes options to display these moving averages and set alerts for their crossovers.
Available Crossovers:
20/50 SMA, 20/100 SMA, 20/200 SMA, 20/325 SMA
50/100 SMA, 50/200 SMA, 50/325 SMA
100/200 SMA, 100/325 SMA
200/325 SMA
VWAP/20 SMA, VWAP/50 SMA, VWAP/100 SMA, VWAP/200 SMA, VWAP/325 SMA
Optional Lines to Add to the Chart:
9 EMA, 5 SMA, 10 SMA, 20 SMA, 50 SMA, 100 SMA, 200 SMA, 325 SMA, VWAP
How to Use:
Enable Indicators: Use the input options to select which SMAs, EMA, and VWAP you want to display on your chart.
Set Alerts: Choose the specific crossover events you want to monitor. For example, you can set an alert for the 20/50 SMA crossover or the VWAP/100 SMA crossover.
Monitor the Chart: The script will plot the selected moving averages on your chart. When a selected crossover event occurs, an alert will be triggered, notifying you of the potential trade opportunity.
Usage Tips:
Trending Market: Use the buy and sell alerts in trending markets where the moving averages can help confirm the direction of the trend.
Key Support and Resistance Levels: Combine crossover alerts with key support and resistance levels for more reliable trading signals.
Volume Confirmation: Ensure there is sufficient volume to support the crossover signals, indicating stronger momentum behind the move.
When NOT to Use Buy and Sell Alerts:
Low Volume: Avoid using buy and sell alerts during periods of low trading volume, as the signals may be less reliable.
Market Noise: Be cautious in highly volatile markets where frequent crossovers might generate false signals.
Sideways Market: In a sideways or range-bound market, crossover signals can result in multiple whipsaws, leading to potential losses.
Why Use This Script? This script provides a comprehensive tool for traders to monitor multiple moving averages and VWAP crossovers efficiently. It allows you to customize alerts based on your trading strategy and helps you make informed decisions by visualizing key technical indicators on your chart.
Legal Disclaimer: The information provided by this script is for educational and informational purposes only and should not be considered financial advice. The developer of this script is not responsible for any financial losses incurred from using this script.
