Weighted Moving Range with Trend Signals (WMR-TS)Weighted Moving Range with Trend Signals (WMR-TS)
Technical analysis involves analyzing statistical trends from trading activity , such as price movement and volume, to make trading decisions. Technical indicators are mathematical calculations based on the price, volume, or open interest of a security or contract. They are used by traders to analyze price movements and predict future market behavior. The WMR-TS indicator combines weighted moving averages and range calculations to identify key trading levels and generate buy/sell signals. It dynamically adjusts to market conditions, offering traders insights into potential support, resistance, and trend reversal points. Key levels are color-coded for quick interpretation. It utilizes weighted moving averages (WMA) and range calculations to determine these levels, making it a robust tool for both trending and ranging markets.
SUMMARY
Parameters :
WMA Length : Determines the length for the primary weighted moving average.
Highest High Length : Sets the period for calculating the highest high.
Lowest Low Length : Sets the period for calculating the lowest low.
Range Corrector : Adjusts the range calculation slightly for fine-tuning.
Top Level : Multiplier for determining the top level from the calculated range.
Bottom Level : Multiplier for determining the bottom level from the calculated range.
Levels Visibility : Sets how many recent bars will display the levels.
Trading Zones :
Short Area : Highlighted zone indicating potential shorting opportunities.
Long Area : Highlighted zone indicating potential buying opportunities.
The Levels :
Wave (Yellow): Midpoint of the calculated range, adjusted by WMA.
Top Level (Red): Calculated upper boundary of the trading range.
Sell Level (Pink): Intermediate sell level.
Resistance Level (Magenta): Immediate resistance level.
Support Level (Cyan): Immediate support level.
Buy Level (Light Green): Intermediate buy level.
Bottom Level (Dark Green): Calculated lower boundary of the trading range.
Interpreting the Signals :
Hammer Signal : Red circles above bars indicate potential sell signals.
Rocket Signal : Green circles below bars indicate potential buy signals.
KEY CONCEPTS
Highest High and Lowest Low :
These values represent the highest high ( HH ) and lowest low ( LL ) over a specified number of periods.
Support Level :
This is the lower boundary of the trading range. It is a price level where demand is strong enough to prevent the price from falling further. As the price approaches the support level, it is likely to bounce back up.
Resistance Level :
This is the upper boundary of the trading range. It is a price level where supply is strong enough to prevent the price from rising further. As the price approaches the resistance level, it is likely to pull back down.
THE USE OF MULTIPLIERS :
The script uses several multipliers to adjust and fine-tune the calculated support and resistance levels, as well as to control the range and sensitivity of these levels. Here is a detailed explanation of these multipliers and their purpose:
Range Corrector : This multiplier adjusts the calculated high ( H ) and low ( L ) levels, adding flexibility to how these levels are positioned relative to the highest high and lowest low. It ranges from -1 to 1 , with a default value of 0 . The use of positive values increase the range, making the calculated levels further apart. Thus, using negative values decrease the range, bringing the calculated levels closer together.
Top Level : This multiplier adjusts the distance of the top level from the calculated high H ) level. It fluctuates from 0 to 2 , with a default value of 0.382 . Higher values will push the top level further above the high level, while lower values will bring it closer.
Bottom Level : This multiplier adjusts the distance of the bottom support level from the calculated low support level. Ranging from 0 to 2, with a default value of 0.214, the higher values will push the bottom level further below the low level, while lower values will bring it closer.
The script plots the support and resistance levels on the chart, allowing traders to visualize the trading range. Color-coded zones are used to indicate areas where buying or selling opportunities may arise based on the current price relative to the trading range. A trading range refers to the area between a price's support and resistance levels over a specific period of time. Within this range, the price of the security fluctuates up and down but does not break out above the resistance or below the support. Support and resistance levels to make trading decisions. Buying near the support level and selling near the resistance level is a common strategy. When the price moves above the resistance level, it is called a breakout . A breakout often indicates that the price may start a new upward trend . Conversely, when the price moves below the support level, it is called a breakdown . A breakdown often indicates that the price may start a new downward trend . By understanding and utilizing trading ranges, traders can make more informed decisions, optimize their trading strategies, and manage risk more effectively.
Understanding Moving Averages
A moving average (MA) is a widely used technical indicator that helps smooth out price data by creating a constantly updated average price. The main purpose of using a moving average is to identify the direction of the trend and to reduce the "noise" of random price fluctuations. The Weighted Moving Average ( WMA ) assigns different weights to each period, with more recent periods typically given more weight. A 10-day WMA might give the most recent day a weight of 10, the second most recent day a weight of 9, and so on. It is useful for traders who want to emphasize recent price data more than older data. When the price is above the moving average, it suggests an Bullish trend . A Bearish Trend is expected to take place when the price is below the moving average. Understanding the price reactions around these levels can be used to make trading decisions.
APPLYING CONCEPTS
Support and Resistance Calculations in the Script :
The script calculates dynamic support and resistance levels using weighted moving averages ( WMA s) and the highest high and lowest low over specified periods. Buy ( Rocket ) and sell ( Hammer ) signals are generated based on the crossing of the price with calculated top and bottom levels.These signals help traders identify potential entry and exit points within the trading range .
Weighted Moving Average (WMA) Application in the Script
This script calculates a special trendWMA using the close price that helps in creating a more dynamic moving average that considers both high and low price actions. This modified WMA is used in conjunction with highest high and lowest low values over specified periods to calculate dynamic support and resistance levels.
Explanation of the Levels in the Script
By understanding these levels, traders can make more informed decisions about where to enter and exit trades, manage risk, and anticipate potential market movements. The script incorporates several key levels levels that traders can use to better anticipate price movements and make more informed trading decisions. Leveraging the principles of Fibonacci retracement ratios ( 23.6%, 38.2%, 50%, 61.8%, and 100% ) to identify key support and resistance zones can also serve for gauging the overall market sentiment.
Top Level and Sell Leve l: Used to identify potential resistance zones where the price may reverse or pause.
Support Level and Buy Level : Used to identify potential support zones where the price may bounce.
Upper and Lower Pivot Values : Serve as intermediate levels for possible price retracements or extensions within the trading range.
Wave Level : Indicates the central trend direction, which can be useful for gauging the overall market sentiment.
Alerts are a crucial part of the script as they notify traders of potential buy and sell signals based on predefined conditions. There are two main alerts: one for a " Hammer " signal (sell condition) and one for a " Rocket " signal (buy condition).
Adjust the input parameters to fit your trading style and the specific asset being analyzed. Shorter lengths may be more responsive to price changes but can produce more false signals , while longer lengths provide smoother signals but may lag . Always backtest the indicator on historical data to understand its behavior and performance. Also remember that different markets may require different parameter settings for optimal performance.
Keep in mind that by nature like all moving averages, WMAs lag behind price action. This means that signals may be delayed. The indicator performs differently in various market conditions. Always consider the overall market context when interpreting signals.
Adjusting parameters like the range corrector and visibility can help tailor the indicator to specific market conditions or trading strategies, improving its effectiveness. The script uses the calculated levels to plot lines and fill zones on the chart, helping traders visualize potential support, resistance, and trend reversal points. The use of multipliers allows for dynamic adjustment of these levels, making the indicator flexible and adaptable to different market conditions.
I think traders can make more informed decisions about where to enter and exit trades, manage risk, and anticipate potential market movements following this code. Stay safe and always remember that market is always changing. Use this tool if you want, please stay informed and plan safe trades,
D.
Cari dalam skrip untuk "10年期国债+交易单位+价格"

IBD PowerTrendThis IBD PowerTrend indicator is designed to help traders identify strong market uptrends based on the IBD Market School's Power Trend methodology. It is intended to be added to daily charts on major indexes.
Concept and Methodology
The IBD PowerTrend helps traders identify strong market uptrends. Markets generally exist in three states: uptrends, downtrends, and rangebound motion. This methodology focuses on:
Downtrends: Stay out of the market.
Rangebound markets: Often frustrating, best avoided.
Uptrends: Identify the strongest uptrends early.
This indicator uses IBD's research on historical uptrends to help traders get in and stay in during robust market phases.
How It Works
A PowerTrend starts when the following four conditions are met simultaneously on a major index:
10-Day Low Above 21-Day EMA : The market's low must be above the 21-day exponential moving average (EMA) for at least 10 consecutive days.
21-Day EMA Above 50-Day SMA : The 21-day EMA must be above the 50-day simple moving average (SMA) for at least five consecutive days.
50-Day SMA Uptrend : The 50-day SMA must be in an uptrend (one day is sufficient).
Market Closes Up : The market must close higher than the previous day's close.
A PowerTrend typically ends when the 21-day EMA crosses back below the 50-day SMA. However, there are rare cases where a PowerTrend can end early due to a circuit breaker or a follow-through day failure. In this script, a circuit breaker is defined as a break of the 50-day line and being more than 10% below recent highs (interpreted as three months).
How to Use
When the PowerTrend is active, the indicator will plot green circles, signaling a strong market uptrend. During these periods, traders might observe opportunities in growth stocks breaking out of sound bases and consider the use of margin. Conversely, during downtrends, the indicator suggests a more defensive approach.
It is recommended to use on daily timeframe.
Chart Description
Main Chart:
- EMA 21 (blue): The 21-day exponential moving average.
- SMA 50 (red): The 50-day simple moving average.
First Panel:
- IBD PowerTrend Indicator: Plots the PowerTrend status with green circles indicating an active PowerTrend.
Second Panel:
- Volume Bars

trend_switch
█ Description
Asset price data was time series data, commonly consisting of trends, seasonality, and noise. Many applicable indicators help traders to determine between trend or momentum to make a better trading decision based on their preferences. In some cases, there is little to no clear market direction, and price range. It feels much more appropriate to use a shorter trend identifier, until clearly defined market trend. The indicator/strategy developed with the notion aims to automatically switch between shorter and longer trend following indicator. There were many methods that can be applied and switched between, however in this indicator/strategy will be limited to the use of predictive moving average and MESA adaptive moving average (Ehlers), by first determining if there is a strong trend identified by calculating the slope, if slope value is between upper and lower threshold assumed there is not much price direction.
█ Formula
// predictive moving average
predict = (2*wma1-wma2)
trigger = (4*predict+3*predict +2*predict *predict)
// MESA adaptive moving average
mama = alpha*src+(1-alpha)*mama
fama = .5*alpha*mama+(1-.5-alpha)*fama
█ Feature
The indicator will have a specified default parameter of:
source = ohlc4
lookback period = 10
threshold = 10
fast limit = 0.5
slow limit = 0.05
Strategy type can be switched between Long/Short only and Long-Short strategy
Strategy backtest period
█ How it works
If slope between the upper (red) and lower (green) threshold line, assume there is little to no clear market direction, thus signal predictive moving average indicator
If slope is above the upper (red) or below the lower (green) threshold line, assume there is a clear trend forming, the signal generated from the MESA adaptive moving average indicator
█ Example 1 - Slope fall between the Threshold - activate shorter trend
█ Example 2 - Slope fall above/below Threshold - activate longer trend

Kaufman Adaptive Moving Average (KAMA) Strategy [TradeDots]"The Kaufman Adaptive Moving Average (KAMA) Strategy" is a trend-following system that leverages the adaptive qualities of the Kaufman Adaptive Moving Average (KAMA). This strategy is distinguished by its ability to adjust dynamically to market volatility, enhancing trading accuracy by minimizing the effects of false and delayed signals often associated with the Simple Moving Average (SMA).
HOW IT WORKS
This strategy is centered around use of the Kaufman Adaptive Moving Average (KAMA) indicator, which refines the principles of the Exponential Moving Average (EMA) with a superior smoothing technique.
KAMA distinguishes itself by its responsiveness to changes in market prices through an "Efficiency Ratio (ER)." This ratio is computed by dividing the recent absolute net price change by the cumulative sum of the absolute price changes over a specified period. The resulting ER value ranges between 0 and 1, where 0 indicates high market noise and 1 reflects stronger market momentum.
Using ER, we could get the smoothing constant (SC) for the moving average derived using the following formula:
fastest = 2/(fastma_length + 1)
slowest = 2/(slowma_length + 1)
SC = math.pow((ER * (fastest-slowest) + slowest), 2)
The KAMA line is then calculated by applying the SC to the difference between the current price and the previous KAMA.
APPLICATION
For entering long positions, this strategy initializes when there is a sequence of 10 consecutive rising KAMA lines. Conversely, a sequence of 10 consecutive falling KAMA lines triggers sell orders for long positions. The same logic applies inversely for short positions.
DEFAULT SETUP
Commission: 0.01%
Initial Capital: $10,000
Equity per Trade: 80%
Users are advised to adjust and personalize this trading strategy to better match their individual trading preferences and style.
RISK DISCLAIMER
Trading entails substantial risk, and most day traders incur losses. All content, tools, scripts, articles, and education provided by TradeDots serve purely informational and educational purposes. Past performances are not definitive predictors of future results.

Volume Storm Trend [ChartPrime]The Volume Storm Trend (VST) indicator is a robust tool for traders looking to analyze volume momentum and trend strength in the market. By incorporating key volume-based calculations and dynamic visualizations, VST provides clear insights into market conditions.
Components:
Calculating the median of the source data.
Volume Power Calculation: The indicator calculates the "heat power" and "cold power" by applying an Exponential Moving Average (EMA) to the median of volume data arrays.
// ---------------------------------------------------------------------------------------------------------------------}
// 𝙄𝙉𝘿𝙄𝘾𝘼𝙏𝙊𝙍 𝘾𝘼𝙇𝘾𝙐𝙇𝘼𝙏𝙄𝙊𝙉𝙎
// ---------------------------------------------------------------------------------------------------------------------{
max_val = 1000
src = close
source = ta.median(src, len)
heat.push(src > source ? (volume > max_val ? max_val : volume) : 0)
heat.remove(0)
cold.push(src < source ? (volume > max_val ? max_val : volume) : 0)
cold.remove(0)
heat_power = ta.ema(heat.median(), 10)
cold_power = ta.ema(cold.median(), 10)
Visualization:
Gradient Colors: The indicator uses gradient colors to visualize bullish volume and bearish volume powers, providing a clear contrast between rising and falling trends.
Bars Fill Color: The color fill between high and low prices changes based on whether the heat power is greater than the cold power.
Bottom Line: A zero line with changing colors based on the dominance of heat or cold power.
Weather Symbols: Visual indicators ("☀" for hot weather and "❄" for cold weather) appear on the chart when the heat and cold powers crossover, helping traders quickly identify trend changes.
Inputs:
Source: The input data source, typically the closing price.
Median Length: The period length for calculating the median of the source. Default is 40.
Volume Length: The period length for calculating the average volume. Default is 3.
Show Weather: A toggle to display weather symbols on the chart. Default is false.
Temperature Type: Allows users to choose between Celsius (°C) and Fahrenheit (°F) for temperature display.
Show Weather Function:
The `Show Weather?` function enhances the VST indicator by displaying weather symbols ("☀" for hot and "❄" for cold) when there are significant crossovers between heat power and cold power. This feature adds a visual cue for potential market tops and bottoms. When the market heats to a high temperature, it often indicates a potential top, signaling traders to consider exiting long positions or preparing for a reversal.
Additional Features:
Dynamic Table Display: A table displays the current "temperature" on the chart, indicating market heat based on the calculated heat and cold powers.
The Volume Storm Trend indicator is a powerful tool for traders
looking to enhance their market analysis with volume and momentum insights, providing a clear and visually appealing representation of key market dynamics.

TASC 2024.06 REIT ETF Trading System█ OVERVIEW
This strategy script demonstrates the application of the Real Estate Investment Trust (REIT) ETF trading system presented in the article by Markos Katsanos titled "Is The Price REIT?" from TASC's June 2024 edition of Traders' Tips .
█ CONCEPTS
REIT stocks and ETFs offer a simplified, diversified approach to real estate investment. They exhibit sensitivity to interest rates, often moving inversely to interest rate and treasury yield changes. Markos Katsanos explores this relationship and the correlation of prices with the broader market to develop a trading strategy for REIT ETFs.
The script employs Bollinger Bands and Donchian channel indicators to identify oversold conditions and trends in REIT ETFs. It incorporates the 10-year treasury yield index (TNX) as a proxy for interest rates and the S&P 500 ETF (SPY) as a benchmark for the overall market. The system filters trade entries based on their behavior and correlation with the REIT ETF price.
█ CALCULATIONS
The strategy initiates long entries (buy signals) under two conditions:
1. Oversold condition
The weekly ETF low price dips below the 15-week Bollinger Band bottom, the closing price is above the value by at least 0.2 * ATR ( Average True Range ), and the price exceeds the week's median.
Either of the following:
– The TNX index is down over 15% from its 25-week high, and its correlation with the ETF price is less than 0.3.
– The yield is below 2%.
2. Uptrend
The weekly ETF price crosses above the previous week's 30-week Donchian channel high.
The SPY ETF is above its 20-week moving average.
Either of the following:
– Over ten weeks have passed since the TNX index was at its 30-week high.
– The correlation between the TNX value and the ETF price exceeds 0.3.
– The yield is below 2%.
The strategy also includes three exit (sell) rules:
1. Trailing (Chandelier) stop
The weekly close drops below the highest close over the last five weeks by over 1.5 * ATR.
The TNX value rises over the latest 25 weeks, with a yield exceeding 4%, or its value surges over 15% above the 25-week low.
2. Stop-loss
The ETF's price declines by at least 8% of the previous week's close and falls below the 30-week moving average.
The SPY price is down by at least 8%, or its correlation with the ETF's price is negative.
3. Overbought condition
The ETF's value rises above the 100-week low by over 50%.
The ETF's price falls over 1.5 * ATR below the 3-week high.
The ETF's 10-week Stochastic indicator exceeds 90 within the last three weeks.
█ DISCLAIMER
This strategy script educates users on the system outlined by the TASC article. However, note that its default properties might not fully represent real-world trading conditions for an individual. By default, it uses 10% of equity as the order size and a slippage amount of 5 ticks. Traders should adjust these settings and the commission amount when using this script. Additionally, since this strategy utilizes compound conditions on weekly data to trigger orders, it will generate significantly fewer trades than other, higher-frequency strategies.

HTF Candle Consistency [LuxAlgo]The HTF Candle Consistency indicator tracks the most recent candle sentiment in up to 10 Higher Timeframe (HTF) and colors the user chart candle bodies based on the dominating sentiment. Users can weigh specific timeframes more significantly.
Additionally, the script provides an HTF dashboard that displays the current directional readouts for each selected timeframe to allow for an independent HTF analysis.
🔶 USAGE
Analyzing the movement and direction of higher timeframe candles can help filter out noisy variation from the price, and could be utilized to time trades better. When the majority of recent candles from the selected timeframes are bullish, the candle body will be colored in green, if this majority is bearish it will be colored in red.
Using the "Tricolor" coloring mode introduces a third coloring option, and is used when there isn't a clear sentiment majority across the selected timeframes, this option effectively allows for filtering out unwanted trends.
Users can control the variations to be filtered out depending on their chart timeframe and the enabled HTF's in the settings. Using low timeframes with higher HTF's will gray out a larger amount of candles, disabling these timeframes, changing them, or giving higher weighting to lower HTF's will allow for obtaining more dominance detection, and as such less grayed-out candles.
As seen above, the weight function allows for precise control over the specific elements being analyzed.
This indicator also features a dashboard for viewing each timeframe's direction at the same time. By doing so, it allows for better judgment on the specific elements composing the current HTF majority.
🔶 DETAILS
This indicator is only intended for Higher Timeframe Analysis, all the input timeframes should be kept equal to or lower than your current chart timeframe.
NOTE: This is necessary for data accuracy in most multi-timeframe indicators, and is generally a good practice to keep in mind.
As a reminder, the dashboard will display the timeframe in red text if a lower timeframe is detected. It is recommended to change or disable this timeframe for your analysis.
This indicator can support up to 10 timeframes, each with independent weightings.
NOTE: When a timeframe is disabled, the dashboard will no longer display that timeframe, and it will not be used in calculations.
🔹 Candle Coloring
Candle color can be selected between 3 modes.
Tricolor (Default): Changes the color based on a 3-part split of the possible data sum range.
Bicolor: Changes the color based on the sum being greater than or less than 0.
Gradient: Uses a 3-color gradient to determine the candle color based on the possible data sum range.
🔶 SETTINGS
🔹 Higher Timeframes
Toggle: Enable/Disable the timeframe from analysis.
Timeframe: Select which timeframe to use for analysis. <- NOTE: This input reflects any custom intervals you have created on Tradingview.
Weight: Determines the Weighting (Multiplier) for the timeframe's direction.
🔹 Style
Color Mode: (More details above) Determines the color mode in use for coloring candles.
🔹 Dashboard
General Settings: Control Toggle, Location, & Size of Dashboard on your chart.
Orientation: Choose to display the dashboard in a "Vertical (default)" or "Horizontal" orientation to fit your style.

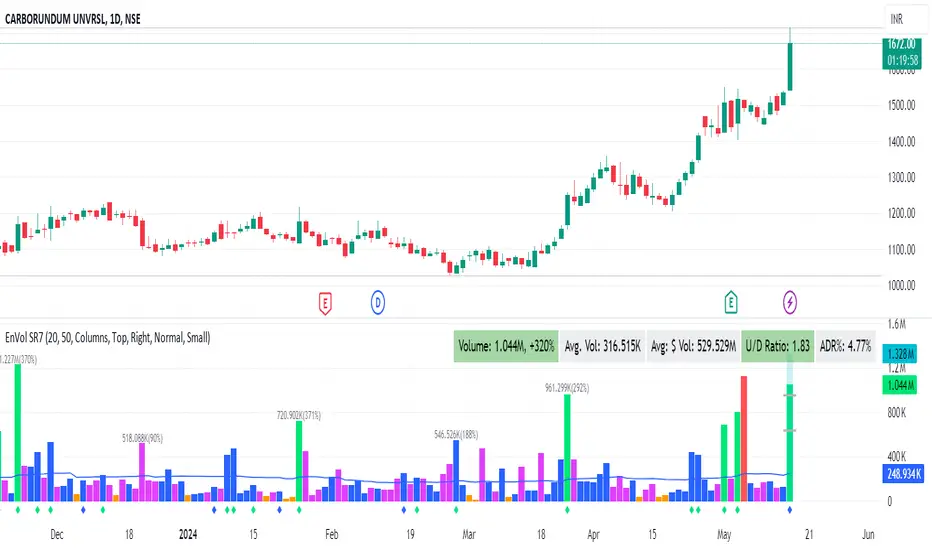
Enhanced Volume by SR7SiddharthaRay007's Enhanced Volume Indicator works on any Timeframe
⦿ Volume Labels:
1. Current Volume, Volume Change%, Average Volume, Average Doller Volume, Up/Down Ratio, ADR%.
=>Average value can be changed using 'Lookback Length' (Default: 20)
⦿ Simple Moving Average: MA (Default: 50). Color of MA changes based on the up down volume ratio.
1. Up/Down Ratio > 1: Blue
2. Up/Down Ratio < 1: Orange
⦿ Volume Bar Colors:
1. High Relative Volume Positive Candle: Lime Green .
2. High Relative Volume Negative Candle: Red .
3. Normal Volume Positive Candle: Blue .
4. Normal Volume Negative Candle: Fuchsia .
5. Low Relative Volume Positive/Negative Candle: Orange .
=>High Relative Volume > 300% of Average Volume; Low Relative Volume < 30% of Average Volume
⦿ Pocket Pivot (A pocket pivot is an up day with volume greater than any of the down days volume in the past 10 days)
1. 10 day Pocket Pivots: Lime Green Diamond below volume bar
2. 5 day Pocket Pivots: Blue Diamond below volume bar
⦿ 'Highest Volume (HV) ' on top of the Volume Bar:
1. Highest Volume Ever (HVE)
2. Highest Volume in Over a Year (HVY)
⦿ Projected Volume Bar: Aqua
⦿ Plot a line at 2x and 3x Average Volume and set Alerts
Consolidation Score ScreenerIn trading, a consolidation range is like a timeout after a big move in the price of a stock or symbol.
It's when the market takes a breather, neither pushing the price up nor down too hard.
Visually, it looks like the price moving sideways on a chart , with highs and lows staying within a certain range.
so this indicator is created to help myself and you decide if its a ranging market and what's the score of that consolidation range
The score ranges between 0 and 10 , where 10 is the max consolidation score , meaning this stock or the symbol is at its highest peak of consolidation .
What would you see using this indicator ?
Symbols circles , inside these circles it will print the consolidation score ..
in the middle of the indicator it will show the range of all the 20 symbols scores .
so it will give you like overall ranging value for your 20 symbols
Settings :
TimeFrame : TimeFrame input to select which time frame you want your indicator to analysis
Range length : The Range that you would want your indicator to take into consideration when doing its analysis .
Features :
20 symbols analysis
Multi timeframe capability
Enjoy .

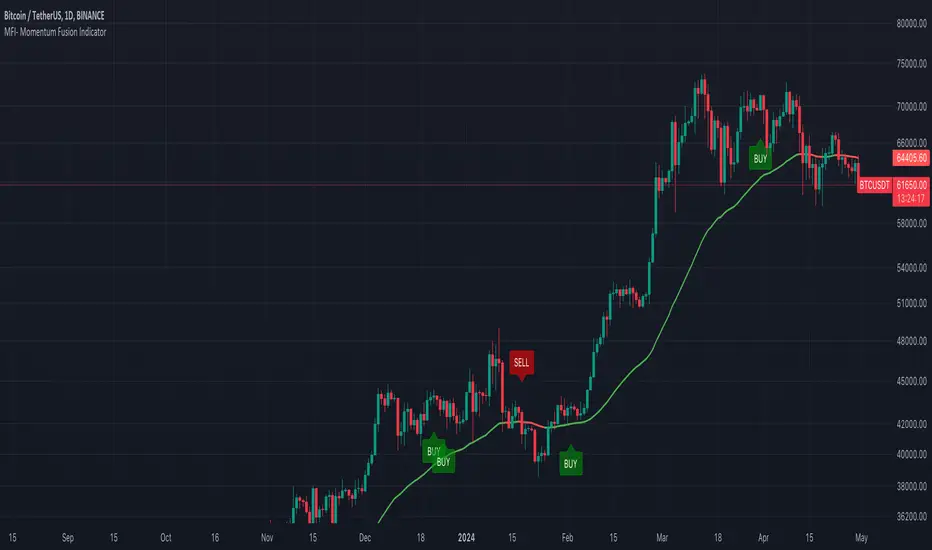
MFI- Momentum Fusion IndicatorIndicator Overview
The "MFI - Momentum Fusion Indicator" is a comprehensive trading tool designed for TradingView that combines several technical analysis methods to assist traders in identifying potential buy and sell opportunities in financial markets.
Key Components
Moving Averages (MA): Uses two Simple Moving Averages (SMA) with periods defined by the user (default 10 and 20). The indicator generates buy signals when the shorter MA (MA 10) crosses above the longer MA (MA 20) and sell signals when it crosses below, helping to pinpoint trend reversals.
Relative Strength Index (RSI): A momentum oscillator that helps identify overbought or oversold conditions, adding a layer of confirmation to the signals generated by the moving averages.
Exponential Moving Average (EMA 50): Used to gauge the medium-term trend direction. The color of the EMA line changes based on whether the trend is up (green) or down (red), providing a visual representation of the market trend.
Average True Range (ATR): This component measures market volatility. Signals are only generated when the ATR confirms significant market movement relative to the EMA50, enhancing the reliability of the signals during volatile conditions.
How It Works
Signal Generation: The core of the indicator is based on the crossover of two SMAs. A buy signal is issued when the short-term MA crosses above the long-term MA during sufficient market volatility (confirmed by ATR). Conversely, a sell signal is triggered when the short-term MA crosses below the long-term MA under similar conditions.
Trend Confirmation: The EMA50 helps confirm the broader market trend, while the ATR ensures that the crossover signals occur during periods of meaningful price movement, filtering out noise and less significant price movements.
Use Case
For Traders: The indicator is ideal for traders who need clear, actionable signals combined with an assessment of market conditions. It’s particularly useful in markets where understanding volatility and momentum is crucial, such as in cryptocurrencies and forex.
Benefits
Comprehensive Analysis: Combines trend, momentum, and volatility analysis in one tool, providing a multifaceted approach to the markets.
Enhanced Decision-Making: By integrating multiple indicators, it reduces the likelihood of false signals and enhances decision-making confidence.
Customizable and Dynamic: Allows for easy adjustment of parameters to fit different trading styles and market conditions.
This indicator equips traders with a powerful blend of tools to analyze price movements and make informed trading decisions based on a combination of trend, momentum, and volatility insights.
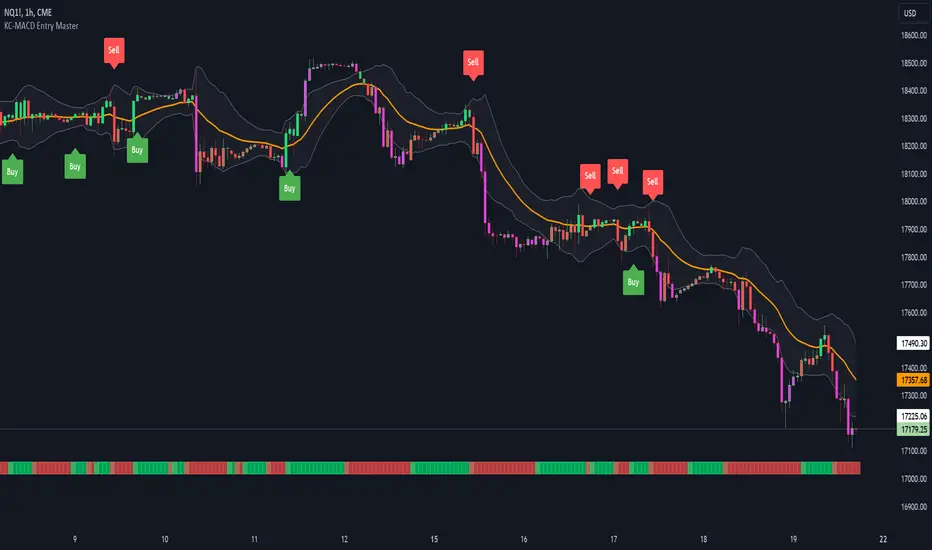
KC-MACD Entry Master @shrilssThe KC-MACD Entry Master is designed to enhance trading strategies by utilizing Keltner Channels and MACD for dynamic market analysis. This indicator excels in visually identifying market conditions with a sophisticated bar coloring system and an informative MACD Traffic Light feature.
Key Features:
- Dynamic Bar Coloring: The core feature of this indicator is its ability to adjust the color of bars based on their positioning relative to the Keltner Channels and the EMA (Exponential Moving Average). It colors bars lime or red when the closing price is within the Keltner Channels but above or below the EMA, respectively. Additionally, it uses a fuchsia color to indicate breakouts when the price extends beyond the Keltner Channels. This visual aid helps traders quickly identify potential buying or selling opportunities based on market volatility and price action.
- MACD Traffic Light: Positioned at the bottom of the chart, this unique feature displays the histogram color of the MACD, set by default to a 3/10/16 configuration—known as the 3-10 Oscillator. This Traffic Light gives traders an at-a-glance view of the underlying momentum and trend shifts, further aiding in decision-making processes.
- MACD-Based Entry Signals: By calculating the fast and slow moving averages specified by the user, the script determines MACD values and their crossover with a smoothed signal line. Entry points are then highlighted with shapes (e.g., "Buy" or "Sell") plotted on the chart when conditions are met, including alignment with the bar colors for enhanced accuracy.
Lot Size Calculator - Acero FXENGLISH DESCRIPTION:
Easy get your lot size (by Acero FX)
---------------------------
We use this transaction sizes:
Forex = 1
XAUUSD = 0.001
US100, US30 or other index = 10
---------------------------
Automatic Information for calculations:
Currency used: USD
Instrument: Detected Automatically
---------------------------
Manual Inputs:
Choose your Balance amount in "Tamaño de Cuenta"
Choose your Risk Type in "Tipo de Riesgo" between Percentage or Amount
Choose your method to calculate your Lot Size in "Calcular Usando..." between Pips or Entry and SL price
---------------------------
Table Shows:
Title: Lot Size Calc 5.0 - Acero FX
Instrument: .................
Lot Size: ..............
Entry Price: .............
Stop Loss Price: .............
Pips: ...............
Risk ($): ...............
Risk (%): ............
Transaction Size: ..............
---------------------------
Important Disclaimers:
-Minor pairs may have some differences between other calculators.
-JPY pairs use USDJPY open price of the day
DESCRIPCIÓN EN ESPAÑOL
Calcula fácilmente tu lote (Diseñado por Acero FX)
---------------------
Usamos estos tamaños de transacción:
Forex = 1
XAUUSD = 0,001
US100, US30 u otros índices = 10
---------------------
Información automática para cálculos:
Moneda utilizada: USD
Instrumento: Detectado automáticamente
---------------------
Entradas manuales:
Elige el monto de tu Saldo en "Tamaño de Cuenta"
Elige el Tipo de Riesgo en "Tipo de Riesgo" entre Porcentaje o Monto
Elige el método para calcular el tamaño de stu lote en "Calcular Usando..." entre Pips o Entrada y precio SL
---------------------
La tabla muestra:
Título: Calc. Tamaño de Lote 5.0 - Acero FX
Instrumento: .................
Lotaje: ..............
Entrada: .............
Stop Loss: .............
Pips: .................
Riesgo ($): .................
Riesgo (%): ............
Tamaño del contrato (tamaño de la transacción): .................
---------------------
Descargos de responsabilidad importantes:
-Los pares menores pueden tener algunas diferencias entre otras calculadoras.
-Los pares JPY utilizan el precio de apertura del día USDJPY

Turtle Trading Strategy@lihexieThe full implementation of the Turtle Trading Rules (as distinct from the various truncated versions circulating within the community) is now ready.
This trading strategy script distinguishes itself from all currently publicly available Turtle trading systems on Tradingview by comprehensively embodying the rules for entries, exits, position management, and profit and loss controls.
Market Selection:
Trade in highly liquid markets such as forex, commodity futures, and stock index futures.
Entry Strategies:
Model 1: Buy when the price breaks above the highest point of the last 20 trading days; Sell when the price drops below the lowest point of the last 20 trading days. When an entry opportunity arises, if the previous trade was profitable, skip the current breakout opportunity and refrain from entering.
Model 2: Buy when the price breaks above the highest point of the last 55 trading days; Sell when the price drops below the lowest point of the last 55 trading days.
Position Sizing:
Determine the size of each position based on the price volatility (ATR) to ensure that the risk of each trade does not exceed 2% of the account balance.
Exit Strategies:
1. Use a fixed stop-loss point to limit losses: Close long positions when the price falls below the lowest point of the last 10 trading days.
2. Trailing stop-loss: Once a position is profitable, adjust the stop-loss point to protect profits.
Pyramiding Rules:
Unit Doubling: Increase position size by one unit every time the price moves forward by n (default is 0.5) units of ATR, up to a maximum of 4 units, while also raising the stop-loss point to below the ATR value at the level of additional entries.
海龟交易法则的完整实现(区别于当前社区各种有阉割海龟交易系统代码)
本策略脚本区别于Tradingview目前公开的所有的海龟交易系统,完整的实现了海龟交易法则中入场、出场、仓位管理,止盈止损的规则。
市场选择:
选择流动性高的市场进行交易,如外汇、商品期货和股指期货等。
入市策略:
模式1:当价格突破过去20个交易日的高点时,买入;当价格跌破过去20个交易日的低点时,卖出。当出现入场机会时,如果上一笔交易是盈利的,那么跳过当前突破的机会,不进行入场。
模式2:当价格突破过去55个交易日的高点时,买入;当价格跌破过去55个交易日的低点时,卖出。
头寸规模:
根据价格波动性(ATR)来确定每个头寸的大小, 使每笔交易的风险不超过账户余额的2%。
退出策略:
1. 使用一个固定的止损点来限制损失:当多头头寸的价格跌破过去10个交易日的低点时,平仓止损。
2. 跟踪止损:一旦头寸盈利,移动止损点以保护利润。
加仓规则:
单位加倍:每当价格向前n(默认是0.5)个单位的ATR移动时,就增加一个单位的头寸大小(默认最大头寸数量是4个),同时将止损点提升至加仓点位的ATR值以下。

Goertzel Adaptive JMA T3Hello Fellas,
The Goertzel Adaptive JMA T3 is a powerful indicator that combines my own created Goertzel adaptive length with Jurik and T3 Moving Averages. The primary intention of the indicator is to demonstrate the new adaptive length algorithm by applying it on bleeding-edge MAs.
It is useable like any moving average, and the new Goertzel adaptive length algorithm can be used to make own indicators Goertzel adaptive.
Used Adaptive Length Algorithms
Normalized Goertzel Power: This uses the normalized power of the Goertzel algorithm to compute an adaptive length without the special operations, like detrending, Ehlers uses for his DFT adaptive length.
Ehlers Mod: This uses the Goertzel algorithm instead of the DFT, originally used by Ehlers, to compute a modified version of his original approach, which sticks as close as possible to the original approach.
Scoring System
The scoring system determines if bars are red or green and collects them.
Then, it goes through all collected red and green bars and checks how big they are and if they are above or below the selected MA. It is positive when green bars are under MA or when red bars are above MA.
Then, it accumulates the size for all positive green bars and for all positive red bars. The same happens for negative green and red bars.
Finally, it calculates the score by ((positiveGreenBars + positiveRedBars) / (negativeGreenBars + negativeRedBars)) * 100 with the scale 0–100.
Signals
Is the price above MA? -> bullish market
Is the price below MA? -> bearish market
Usage
Adjust the settings to reach the highest score, and enjoy an outstanding adaptive MA.
It should be useable on all timeframes. It is recommended to use the indicator on the timeframe where you can get the highest score.
Now, follows a bunch of knowledge for people who don't know about the concepts used here.
T3
The T3 moving average, short for "Tim Tillson's Triple Exponential Moving Average," is a technical indicator used in financial markets and technical analysis to smooth out price data over a specific period. It was developed by Tim Tillson, a software project manager at Hewlett-Packard, with expertise in Mathematics and Computer Science.
The T3 moving average is an enhancement of the traditional Exponential Moving Average (EMA) and aims to overcome some of its limitations. The primary goal of the T3 moving average is to provide a smoother representation of price trends while minimizing lag compared to other moving averages like Simple Moving Average (SMA), Weighted Moving Average (WMA), or EMA.
To compute the T3 moving average, it involves a triple smoothing process using exponential moving averages. Here's how it works:
Calculate the first exponential moving average (EMA1) of the price data over a specific period 'n.'
Calculate the second exponential moving average (EMA2) of EMA1 using the same period 'n.'
Calculate the third exponential moving average (EMA3) of EMA2 using the same period 'n.'
The formula for the T3 moving average is as follows:
T3 = 3 * (EMA1) - 3 * (EMA2) + (EMA3)
By applying this triple smoothing process, the T3 moving average is intended to offer reduced noise and improved responsiveness to price trends. It achieves this by incorporating multiple time frames of the exponential moving averages, resulting in a more accurate representation of the underlying price action.
JMA
The Jurik Moving Average (JMA) is a technical indicator used in trading to predict price direction. Developed by Mark Jurik, it’s a type of weighted moving average that gives more weight to recent market data rather than past historical data.
JMA is known for its superior noise elimination. It’s a causal, nonlinear, and adaptive filter, meaning it responds to changes in price action without introducing unnecessary lag. This makes JMA a world-class moving average that tracks and smooths price charts or any market-related time series with surprising agility.
In comparison to other moving averages, such as the Exponential Moving Average (EMA), JMA is known to track fast price movement more accurately. This allows traders to apply their strategies to a more accurate picture of price action.
Goertzel Algorithm
The Goertzel algorithm is a technique in digital signal processing (DSP) for efficient evaluation of individual terms of the Discrete Fourier Transform (DFT). It's particularly useful when you need to compute a small number of selected frequency components. Unlike direct DFT calculations, the Goertzel algorithm applies a single real-valued coefficient at each iteration, using real-valued arithmetic for real-valued input sequences. This makes it more numerically efficient when computing a small number of selected frequency components¹.
Discrete Fourier Transform
The Discrete Fourier Transform (DFT) is a mathematical technique used in signal processing to convert a finite sequence of equally-spaced samples of a function into a same-length sequence of equally-spaced samples of the discrete-time Fourier transform (DTFT), which is a complex-valued function of frequency . The DFT provides a frequency domain representation of the original input sequence .
Usage of DFT/Goertzel In Adaptive Length Algorithms
Adaptive length algorithms are automated trading systems that can dynamically adjust their parameters in response to real-time market data. This adaptability enables them to optimize their trading strategies as market conditions fluctuate. Both the Goertzel algorithm and DFT can be used in these algorithms to analyze market data and detect cycles or patterns, which can then be used to adjust the parameters of the trading strategy.
The Goertzel algorithm is more efficient than the DFT when you need to compute a small number of selected frequency components. However, for covering a full spectrum, the Goertzel algorithm has a higher order of complexity than fast Fourier transform (FFT) algorithms.
I hope this can help you somehow.
Thanks for reading, and keep it up.
Best regards,
simwai
---
Credits to:
@ClassicScott
@yatrader2
@cheatcountry
@loxx

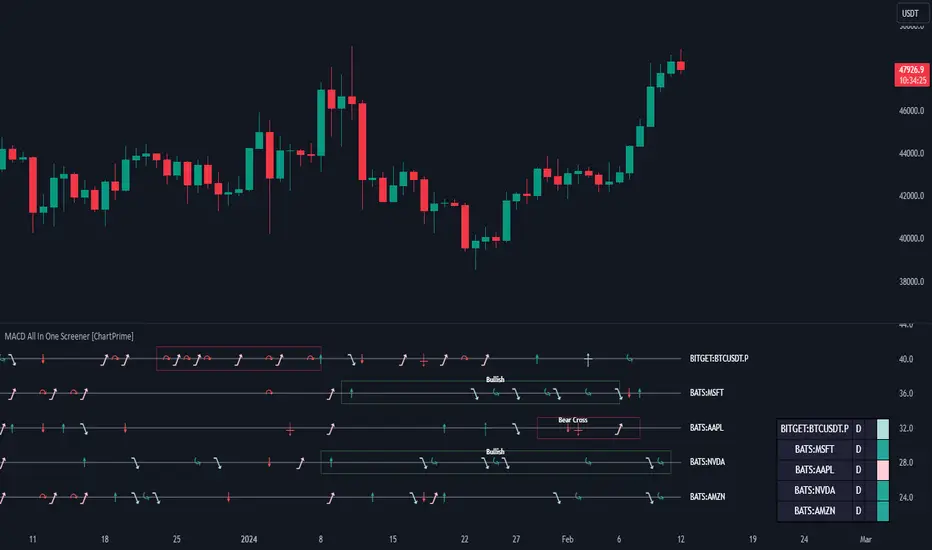
MACD All In One Screener [ChartPrime]INTRODUCTION
MACD All In One Screener (ChartPrime) is a multi instrument, multi timeframe indicator designed to provide traders with a comprehensive solution to monitoring the market. This indicator is designed to be easy to use and visually appealing while also being highly flexible and feature rich. Users can pick up to 10 symbols not including the chart's symbol and set up alerts for many different signals that the MACD produces. One standout feature of this indicator is its ability to display not only each symbol individually as a MACD but you can also view its chart from within this indicator. This removes the need to flip between symbols to see the price action for your basket.
On top of that we have designed this indicator to be friendly with "indicator on indicator" by providing outputs for all of the standards of price that users may want. Included is an overview section that shows all of the symbols signals symbolically over time. Additionally we have included a table for easy monitoring. This table includes the symbol, its timeframe, the current alert, and its histogram state. To make things as user friendly as possible we have also included rich error handling that tells you exactly what is wrong with your configuration.
HOW TO USE
To use this indicator, simply add it to your chart and navigate to the settings. From there select the symbols you want to monitor and the timeframes you want to use. Next you want to navigate down to the alerts section to select the what alerts you want to receive, and what symbols you want to get alerts for. Finally, you wan to create your alert using "Any alert() function call". Now your screener is all set up!
OVERVIEW OF INPUTS
View allows you to select what the indicator currently displays. You can pick from any one of the selected symbols, an overview of all of the symbols, or simply nothing. If you want to only use the table, "None" is provided so you can move the indicator into the chart panel.
View Toggle lets you pick from displaying the MACD for the selected symbol or the Price Action as a candle chart. To see your "indicator on indicator" you will have to select a symbol from the view list. There is a bug where if you select "Overview" while you are using "indicator on indicator" your added indicator will see the last symbol you viewed. To fix this, simply change the setting of your overlaid indicator and it will correct its self.
History Length is the number of historical bars to calculate over. This feature is here to prevent the indicator from breaking due to uneven historical data between the symbols.
Show Price Line toggles a dotted line that follows the current symbols closing price when "Price" is selected under the "View Toggle" dropdown.
Show Symbol Label toggles a label that displays the current symbols name and timeframe. This only impacts the single symbol view.
Overview Label Color adjusts the color of the symbol labels for both overview and single symbol view.
MA Type lets you pick what kind of moving average you want to use for the oscillator or signal. You can pick from the standard SMA or EMA.
Fast Length is a standard input for MACD. This lets you pick the period of the fast MA.
Slow Length , just like Fast Lenght, is a standard input for MACD. This lets you pick the period of the slow MA.
Signal Length is another standard input for MACD. This lets you configure the period of the signal MA.
MACD Cross Overlay Icon is a toggle to display MACD crosses when viewing a single symbol's MACD. When the MACD has a bullish cross it will plot a bullish dot, and when it has a bearish cross it will plot a bearish dot. This is purely visual.
Regular Bullish and Bearish toggles the visual display of the divergences on the single symbol view. This does not effect the indicators ability do send alerts.
Divergence Look Right adjusts the number of bars into the future to look for confirmation of a signal. This directly impacts lag but enhances stability.
Divergence Look Left adjusts the number of bars into the past to check for a signal. A longer period will filter out smaller moves
Maximum Lookback adjusts the maximum size of a divergence.
Minimum Lookback adjusts the minimum size of a divergence.
Divergence Drawings picks how you want to visualize the divergence. You can pick from displaying it as a line, a label, or both.
Enable Table toggles the overview table. When enabled it will show you the enabled symbols and their current state. From left to right: symbol name, timeframe, current alert, and histogram state.
Position picks where on the chart you want the table to be.
Text Color adjusts the text color of the table.
BG Color adjusts the background color of the table.
Frame Color adjust the frame color of the table.
Current Symbol Time Frame adjusts the timeframe of the chart's symbol.
Symbol 1 - 10 pick "Symbol's" symbol and timeframe. To use higher timeframes, the symbol's have to be the same type. You can't have a crypto and a stock using HTF at the same time as they don't have the same sessions and will result in an error. You can use unsafe mode (as described below) to potentially get around this.
Enable Symbol when enabled it will give you alerts for the symbol. This also enables the symbol in the overview. If this is disabled it won't send alerts, and it will not show up in overview, or the table.
Wait for Close enables waiting for the bar to close before printing an alert.
Alert Symbol Size picks what size you want the overview symbols to be.
Enable Cross Over 0 Alert: MACD crosses over the 0 line.
Enable Cross Under 0 Alert: MACD crosses under the 0 line.
Enable MACD Cross Bullish Alert: Bullish MACD cross.
Enable MACD Cross Bearish Alert: Bearish MACD cross.
Enable Histogram Bullish Turn Alert: MACD begins to turn bullish but hasn't crossed.
Enable Histogram Bearish Turn Alert: MACD begins to turn bearish but hasn't crossed.
Enable Histogram Bullish Continuation Alert: MACD is in a bullish cross state and it was declining but began rising again.
Enable Histogram Bearish Continuation Alert: MACD is in a bearish cross state and it was rising but began falling again.
Enable Bullish/Bearish Divergence Alert enables divergence alerts. Divergences are lagging, especially on a higher timeframe. These alerts will also tell you the time in the past when the divergence occurred.
Color Section is provided to allow for personalization of the indicator. Everything can be adjusted here.
Disable Error Checking: Only enable this if you want to bypass the built in error checking. This will enable 'Safe Requesting'. Safe Requesting will only request enabled symbols and you will not be able to view symbols that are not enabled in this mode. Only use this if you want to mix symbol types and you know it will work. (An example would be viewing stocks and SPY at the same time.)
CONCLUSION
The MACD All In One Screener (ChartPrime) is a versatile indicator designed to monitor multiple symbols across various timeframes. The flexibility in customization, from MACD settings to visual alerts and table presentations, allows users to tailor the screener to their needs and preferences. We hope you find this as useful and interesting as we do and wish you good luck in the market!
Enjoy
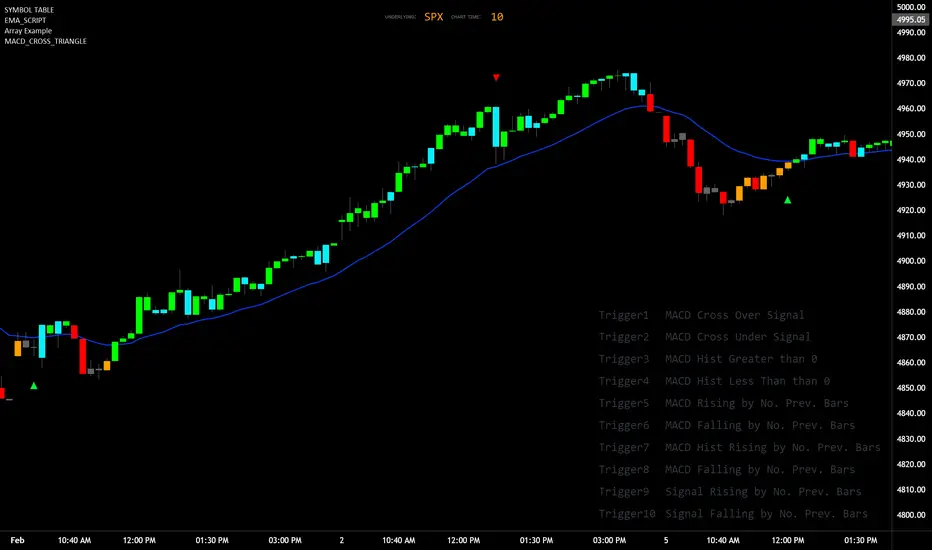
MACD_TRIGGER_CROSS_TRIANGLEMACD Triangle Trigger Indicator by thebearfib
Overview
The MACD Cross Triangle Indicator is a powerful tool for traders who rely on the MACD's signal line crossovers to make informed trading decisions. This indicator enhances the traditional MACD by allowing users to customize triggers for bullish and bearish signals and by displaying these signals directly on the chart with visually distinctive labels.
Features
Customizable Color Scheme: Choose distinct colors for bullish and bearish signals to fit your chart's theme or your personal preference.
Flexible Trigger Conditions: Select from a variety of trigger conditions based on MACD and signal line behaviors over a specified number of bars back.
Visual Signal Indicators: Bullish and bearish signals are marked with upward and downward triangles, making it easy to spot potential entry or exit points.
Detailed Trigger Descriptions: A comprehensive table lists all available triggers and their descriptions, aiding in selection and understanding of each trigger's mechanism.
Configuration Options
Bullish and Bearish Colors: Customize the color of the labels for bullish (upward) and bearish (downward) signals.
Trend Lookback Period: Choose how far back (in bars) the indicator should look to determine the trend, affecting the calculation of certain triggers.
Trigger Selection for Bullish and Bearish Signals: Pick specific triggers for both bullish and bearish conditions from a list of 10 different criteria, ranging from MACD crossovers to historical comparisons of MACD, signal line, and histogram values.
Label Size and Font Settings: Adjust the size of the signal labels on the chart and the font size of the trigger descriptions table to ensure readability and fit with your chart layout.
Trigger Descriptions Table Position and Color: Customize the position and color of the trigger descriptions table to match your chart's aesthetic and layout preferences.
Trigger Mechanisms
Trigger 1 to 10: Each trigger corresponds to a specific condition involving the MACD line, signal line, and histogram. These include crossovers, directional changes compared to previous bars, and comparisons of current values to historical values.
Usage
1. Select Trigger Conditions: Choose the desired triggers for bullish and bearish signals based on your trading strategy.
2. Customize Visuals: Set your preferred colors for the bullish and bearish labels, adjust label and font sizes, and configure the trigger descriptions table.
3. Analyze Signals: Watch for the upward (bullish) and downward (bearish) triangles to identify potential trading opportunities based on MACD crossover signals.
Conclusion
The MACD Cross Triangle Indicator offers a customizable and visually intuitive way to leverage MACD crossover signals for trading. With its flexible settings and clear signal indicators, traders can tailor the indicator to fit their strategy and improve their decision-making process on TradingView.
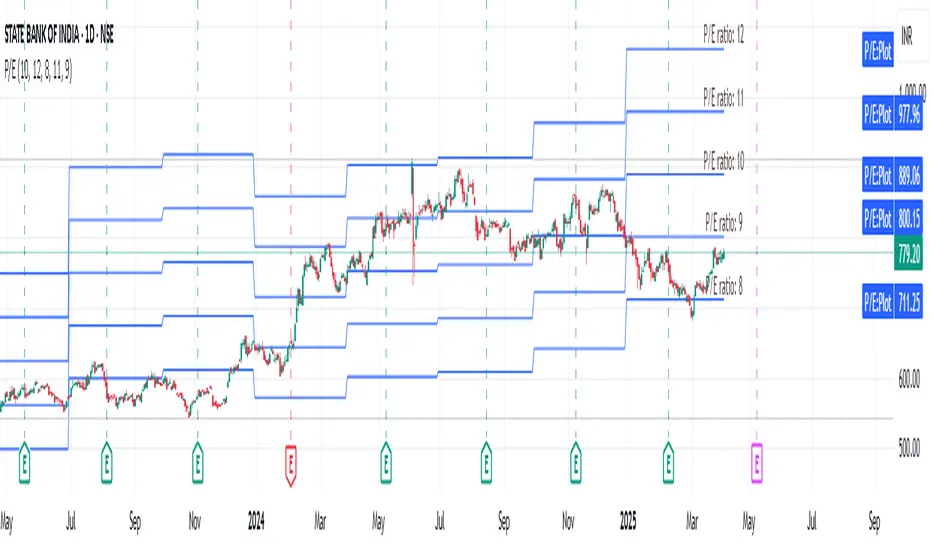
EPS GridIntroduction:
This simple indicator offers insights into the relationship between stock prices and earnings, aiding in the assessment of valuation dynamics during different periods.
Understanding Price-to-Earnings (P/E) Ratio:
The commonly used Price to Earnings (P/E) ratio, calculated as Current Price divided by Earnings Per Share (EPS) over the trailing 12 months (TTM), serves as a fundamental metric. Here, we use this formula to estimate a stock's price. For instance, multiplying EPS by 10 provides an approximation of the stock price with a P/E ratio of 10.
The Grid Concept:
Utilizing this principle, a visual grid is constructed to illustrate how stock prices correlate with earnings. This grid facilitates the identification of both potential bargains and overvalued stocks.
How to Utilize:
This indicator is pre-configured with earnings multiples of 10, 15, 20, and 25. Simply add it to your chart and observe whether earnings demonstrate consistent growth. If prices lag behind earnings, a potential catch-up phase may ensue in the future.
Happy Investing!
Embark on your investment journey armed with this indicator, and may it guide you towards informed decisions and successful ventures.
Monte Carlo Future Moves [ChartPrime]ORIGINS AND HISTORICAL BACKGROUND:
Prior to the the advent of the Monte Carlo method, examining well-understood deterministic problems via simulation generally utilized statistical sampling to gauge uncertainty estimations. The Monte Carlo (MC) approach inverts this paradigm by modeling with probabilistic metaheuristics to address deterministic problems. Addressing Buffon's needle problem, an early form of the Monte Carlo method estimated π (3.14159) by dropping needles on a floor. Later, the modern MC inception primarily began when Stanislaw Ulam was playing solitaire games while experiencing illness and recovery.
Ulam further developed, applied, and ascribed "Monte Carlo" as a classified code name to maintain a level of secrecy for the modern method applications during collaborative investigations on neutron diffusion and collision intricacies with John von Neumann. Despite having relevant data, physicist's conventional deterministic mathematical methods were unable to solve mysterious "neutronion problems". Monte Carlo filled in the gaps necessary to resolve this perplexing neutron problem with innovative statistics, and the resilient MC continues onward to have diverse application in many fields of science. MC also extends into the realm of relevance within finance.
APPLICATION IN FINANCE:
Building on its historical roots, the Monte Carlo method's transition into finance opened new avenues for risk assessment and predictive analysis. In financial markets, characterized by uncertainty and complex variables, this method offers a powerful tool for simulating a wide range of scenarios and assessing probabilities of different outcomes. By employing probabilistic models to predict price movements, the Monte Carlo method helps in creating more resilient and informed trading strategies. This approach is particularly valuable in options pricing, portfolio management, and risk assessment, where understanding the range of potential outcomes is crucial for making sound investment decisions. Our indicator utilizes this methodology, blending traditional financial analysis with advanced statistical techniques.
THE INDICATOR:
The Monte Carlo Future Moves (ChartPrime) indicator is designed to predict future price movements. It simulates various possible price paths, showing the likelihood of different outcomes. We have designed it to be simple to use and understand by displaying lines indicating the most likely bullish and bearish outcomes. The arrows point to these areas making it intuitive to understand. Also included is extreme price levels shown in blue and yellow. This is the most likely extreme range that the price will move to. The outcome distribution is there to show you the range of outcomes along with a visual representation of the possible future outcomes. To make things more user friendly we have also included a representation of this distribution as a background heatmap. The brighter the price level, the more likely the price will end at that level. Finally, we have also included a market bias indication on the side that shows you the general bullish/bearish probabilities.
HOW TO USE:
To use this indicator you want to first assess the market bias. From there you want to target the most likely polar outcome. You can use the range of outcomes to assess your risk and set a stop within a reasonable range of the desired target. By default the indicator projects 10 steps into the future, however this can be easily adjusted in the settings. Generally this indicator excels at mid-term estimations and may yield inconclusive results if the prediction period is too short or too long. You can change the granularity of the outcomes to give you a more or less detailed view of the future. That being said, a lower resolution can make the predictions less useful while a higher resolution can give you a less useful picture. If you decide to use a higher resolution we have included an option to smooth the final result. This is intended to reduce the uncertainty and noise in the predicted outcomes. It is advised to use the minimum level of smoothing possible as a high level of smoothing will greatly reduce the accuracy.
INPUT SECTION:
Derivative Source changes how the indicator sees the price movements. When you set this to Candle it will use the difference between the open and close of each candle. If set to Move, it will use the difference between closing prices. If you are in a market with gaps, you might want to use Candle as this will prevent the indicator from seeing gaps.
Number of Simulations is a crucial setting as it is the core of this indicator. This determines the number of simulations the indicator will use to get its final result. By default it is set to 1000 as we feel like that is around the minimum number of simulations required to get a reasonable output while maintaining stability. In tests the maximum number of simulations we have been able to consistently achieve is 2000.
Lookback is the number of historical candles to account for. A lookback that is too short will not have enough data to accurately assess the likelihood of a price movement, while a period that is too large can make the data less relevant. By default this is set to 1000 as we feel like this is a reasonable tradeoff between volume of data and relevance.
Steps Into Future is the prediction period. By default we have picked a period of 10 steps as this has a good balance between accuracy and usability. The more steps into the future you go, the more uncertain the future outcome will be.
Outcome Granularity controls the precision of the simulated outcomes. By default this is set to 40 as its a good balance between resolution and accuracy.
Outcome Smoothing allows you to smooth the outcome distribution. By default this is set to 0 as it is generally not needed for lower resolutions. Smoothing levels beyond 2 are not recommended as it will negatively impact the output.
Returns Granularity controls the level of definition in the collected price movements. This directly impacts indicator performance and is set to 50 by default because its a good balance between fidelity and usability. When this number is too small, the simulations will be less accurate while numbers too large will negatively impact the probabilities of the movements.
Drift is the trend component in the simulation. This adds the directionality of the simulations by biasing the movements in the current direction of the market. We have included both the standard formula for drift and linear regression. Both methods are well suited for simulating future price movements and have their own advantages. The drift period is set to 100 by default as its a good balance between current and historical directionality. You may want to increase or decrease this number depending on the current market conditions but it is advised to use a period that isn't too small. If your period is too small it can skew the outcomes too much resulting in poor performance. When this is set to 0 it will use the same period as your lookback.
Volatility Adjust , adjusts the simulation to include current volatility. This makes sure that the price movements in the simulation reflects the current market conditions better by making sure that each price move is at least a minimum size.
Returns Style allows you to pick between using percent moves and log returns. We have opted to make percent move the default as it is more intuitive for beginners however both settings yield similar results. Log returns can be less cpu intensive so it might be desirable for longer term predictions.
Precision adjusts the rounding of used when collecting the frequency of price movement sizes. By default this is set to 4 as its is fairly accurate without impacting performance too much. A larger number will make the indicator more precise but at the cost of cpu time. Precision levels that are too small can greatly reduce the accuracy of the simulation and even break the indicator all together.
Update Every Bar allows you to recalculate the prediction every bar and is there for you if you want to strictly use the market bias. It is not recommended to enable this feature but it is there for flexibility.
Side of Chart allows you to pick what side of the price action you want the visuals to be on. When its set to the right everything will be to the right of the starting point and when its set to Left it will position everything to the left of the starting point.
Move Visualization is there to give you an arrow to the most likely bullish and bearish moves. It is meant as a visual aid and visualization tool. The color of these arrows use the same colors as the distribution.
Most Likely Move is a horizontal line that indicates the most likely move. It is positioned in the same location as the Move Visualization.
Standard Deviation is horizontal lines at the extremities of the simulated price action. These represent the most likely range of the future outcomes. You can adjust the multiplier of the standard deviation but by default it is set to 2.
Most Likely Direction is a vertical bar that shows you the sum of the up and down probabilities. It is there to show you the bias of the outcomes and guide you in decision making.
Max Probability Zone is a horizontal line that highlights the location of the highest probability move. You can think of it almost like the POC in a volume distribution but in this case it is the "most likely" single outcome.
Outcome Distribution allows you to toggle the distribution on or off. This is the distribution of all of the simulated outcomes. You can toggle the scale width of the distribution to fit your visual style.
Distribution Text toggles the probability text inside of the distribution bars. When you have a large number for the outcome granularity this text may not be visible and you may want to disable this feature.
Background is a heatmap of the outcome distribution. This allows you to visualize the underlying distribution without the need for the distribution histogram. The brighter the color, the more likely the outcome is for that level. It can be useful for visualizing the range of possible outcomes.
Starting Line is simply a horizontal line indicating the starting point of the simulation. It just the opening price for the starting position.
Extend Lines allows you to extend the lines and background past the prediction period.
CONCLUSION:
With its intuitive visuals and flexible settings, the Monte Carlo Future Moves (ChartPrime) indicator is practice and easy to use. It brings clarity to price movement predictions, helping you to build confidence in your strategies. This indicator not only reflects the evolution of technical analysis but also touches on data-driven insights.
Enjoy

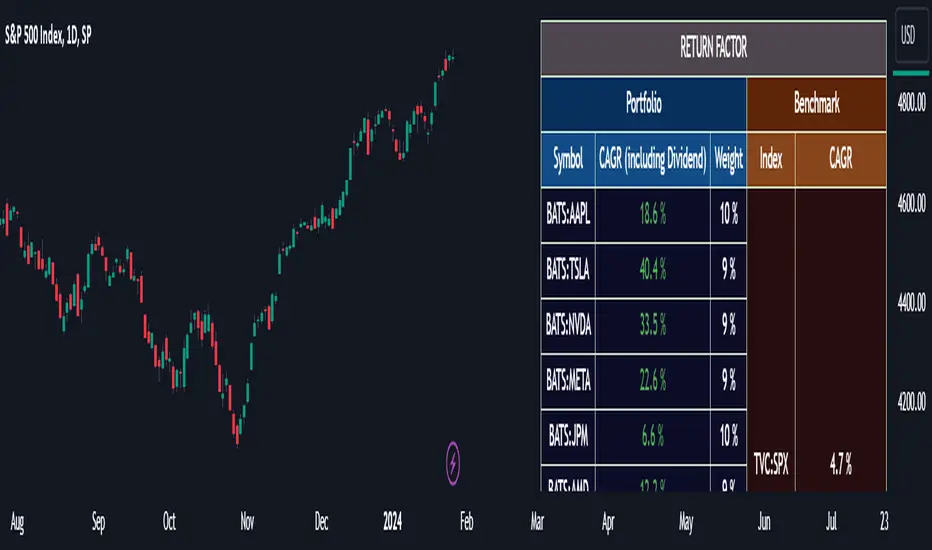
Portfolio Management [TrendX_]Portfolio Management is a powerful tool that helps you create and manage your own portfolio of stocks, based on your risk and return preferences.
*** Note: You should select the appropriate index for each stock as the benchmark to compare your portfolio’s performance.
*** Note: You should apply the indicator to the same chart as the benchmark, so that it can capture the historical trends of all the 10 stocks in your portfolio.
USAGE
Analyze your portfolio’s return factor, which shows the compound annual growth rate (CAGR) of each stock and the portfolio as a whole, as well as the weight of each stock in the portfolio.
The Weighting approach contains 2 options, Equal and Growth-based method:
Customize your portfolio by selecting up to 10 stocks from a wide range of markets and sectors:
Compare your portfolio’s performance with a benchmark of your choice, which is the S&P500 by default setting.
Evaluate your portfolio’s risk factor, which includes the capital asset pricing model (CAPM), the portfolio beta, and the Sharpe ratio of both the portfolio and the benchmark:
- CAPM is a model that calculates the expected return of the portfolio based on its risk and the risk-free rate of return.
- Portfolio beta is a measure of how sensitive the portfolio is to the movements of the benchmark. A beta of 1 means the portfolio moves in sync with the benchmark, a beta of less than 1 means the portfolio is less volatile than the benchmark, and a beta of more than 1 means the portfolio is more volatile than the benchmark.
- Sharpe ratio measures how much excess return the portfolio generates per unit of risk. It is calculated by subtracting the risk-free rate of return from the portfolio’s return, and dividing by the portfolio’s standard deviation. A higher Sharpe ratio means the portfolio has a better risk-adjusted return. A Sharpe ratio of more than 1 is considered good, a Sharpe ratio of more than 2 is considered very good, and a Sharpe ratio of more than 3 is considered excellent .
Adjust your portfolio’s rebalancing strategy, which determines when and how to change the weight of each stock in the portfolio to optimize your return and risk objectives. The tool also suggests a default hedging-stock asset, which is the US dollar interpreted through the dollar index (DXY):
- The dollar index is a measure of the value of the US dollar relative to a basket of other major currencies. It is often used as a proxy for the global economic sentiment and the demand for safe-haven assets. A rising dollar index means the US dollar is strengthening, which may indicate a bearish outlook for the stock market. A falling dollar index means the US dollar is weakening, which may indicate a bullish outlook for the stock market.
- The rebalancing strategy suggest increasing the weight of the hedging-stock asset when the dollar index is under positive supertrend condition, and decreasing the weight of the hedging-stock asset when the dollar index is in the downward supertrend. This way, you can hedge against the adverse effects of the stock market fluctuations on your portfolio, simply you can just cash out at the suggested hedging weight.
CONCLUSION
Investors can gain a deeper insight into their portfolio’s performance, risk, and potential, and make informed decisions to achieve their financial goals with confidence and ease.
DISCLAIMER
The results achieved in the past are not all reliable sources of what will happen in the future. There are many factors and uncertainties that can affect the outcome of any endeavor, and no one can guarantee or predict with certainty what will occur.
Therefore, you should always exercise caution and judgment when making decisions based on past performance.
Ichimoku Clouds Strategy Long and ShortOverview:
The Ichimoku Clouds Strategy leverages the Ichimoku Kinko Hyo technique to offer traders a range of innovative features, enhancing market analysis and trading efficiency. This strategy is distinct in its combination of standard methodology and advanced customization, making it suitable for both novice and experienced traders.
Unique Features:
Enhanced Interpretation: The strategy introduces weak, neutral, and strong bullish/bearish signals, enabling detailed interpretation of the Ichimoku cloud and direct chart plotting.
Configurable Trading Periods: Users can tailor the strategy to specific market windows, adapting to different market conditions.
Dual Trading Modes: Long and Short modes are available, allowing alignment with market trends.
Flexible Risk Management: Offers three styles in each mode, combining fixed risk management with dynamic indicator states for versatile trade management.
Indicator Line Plotting: Enables plotting of Ichimoku indicator lines on the chart for visual decision-making support.
Methodology:
The strategy utilizes the standard Ichimoku Kinko Hyo model, interpreting indicator values with settings adjustable through a user-friendly menu. This approach is enhanced by TradingView's built-in strategy tester for customization and market selection.
Risk Management:
Our approach to risk management is dynamic and indicator-centric. With data from the last year, we focus on dynamic indicator states interpretations to mitigate manual setting causing human factor biases. Users still have the option to set a fixed stop loss and/or take profit per position using the corresponding parameters in settings, aligning with their risk tolerance.
Backtest Results:
Operating window: Date range of backtests is 2023.01.01 - 2024.01.04. It is chosen to let the strategy to close all opened positions.
Commission and Slippage: Includes a standard Binance commission of 0.1% and accounts for possible slippage over 5 ticks.
Maximum Single Position Loss: -6.29%
Maximum Single Profit: 22.32%
Net Profit: +10 901.95 USDT (+109.02%)
Total Trades: 119 (51.26% profitability)
Profit Factor: 1.775
Maximum Accumulated Loss: 4 185.37 USDT (-22.87%)
Average Profit per Trade: 91.67 USDT (+0.7%)
Average Trade Duration: 56 hours
These results are obtained with realistic parameters representing trading conditions observed at major exchanges such as Binance and with realistic trading portfolio usage parameters. Backtest is calculated using deep backtest option in TradingView built-in strategy tester
How to Use:
Add the script to favorites for easy access.
Apply to the desired chart and timeframe (optimal performance observed on the 1H chart, ForEx or cryptocurrency top-10 coins with quote asset USDT).
Configure settings using the dropdown choice list in the built-in menu.
Set up alerts to automate strategy positions through web hook with the text: {{strategy.order.alert_message}}
Disclaimer:
Educational and informational tool reflecting Skyrex commitment to informed trading. Past performance does not guarantee future results. Test strategies in a simulated environment before live implementation

Multi VWAP [MW]Introduction
The Multi VWAP tool extends the concept of using the Anchored Volume Weighted Average Price, popularized by its founder, Brian Shannon, founder of AlphaTrends, and creates automatic AVWAPS for multiple anchor points, such as for 2-day, 3-day, 4-day, 5-day, and custom date anchors as well as automagically creating month-to-date and year-to-date anchors. Currently, most standard VWAP tools allow users to place custom anchored VWAPs, but the routine of doing this for every equity being watched can become cumbersome. This tool makes that process multi-times easier. Brian Shannon is also the author of “Maximum Trading Gains With Anchored VWAP: The Perfect Combination of Price, Time, and Volume”. Available at Amazon.
Settings
Daily VWAP : A continuous line of the the daily Volume Weighted Average Price (VWAP)
Weekly VWAP : A continuous line of the weekly VWAP
2-Day AVWAP : The anchored VWAP from 2 trading days ago (holidays and weekends are excluded in this calculation)
3-Day AVWAP : The anchored VWAP from 3 trading days ago
4-Day AVWAP : The anchored VWAP from 4 trading days ago
5-Day AVWAP : The anchored VWAP from 5 trading days ago. The slope of this line and the position of the price relative to this line can be used to determine trend direction.
10-Day AVWAP : The anchored VWAP from 10 trading days ago
Month-to-Date AVWAP : The anchored VWAP from the beginning of the current month
Year-to-Date AVWAP : The anchored VWAP from the beginning of the current year
Custom Date AVWAP : Sets a date to begin an anchored VWAP starting from any time.
Use only the most recent VWAP for Week, Month, and Year: Toggles on and off the continuous weekly, monthly, and yearly VWAPs
Calculations
This indicator does not provide buy or sell signals. It is simply the VWAP calculated starting from an “anchor point”, or start time. It is the calculated by the summation of Price x Volume / Volume for the period starting at the anchor point.
How to Interpret
According to Brian Shannon, VWAP is an objective measure of what the average trader has paid for a particular equity over a given period, and is the value that large institutional investors frequently use as a trade signal. Therefore, by definition, when the price is above an AVWAP, buyers are in control for that period of time. Likewise, if the price is below the AVWAP, sellers are in control for that period of time.
Shannon also distinguishes the importance of an increasing or decreasing 5 day VWAP, which reflects the price sentiment, objectively, for roughly the last trading week, or 5 trading days. Pricing below a decreasing 5-day VWAP is considered very bearish, while pricing above an increasing 5-day VWAP is considered bullish and is recommended before considering long positions.
Additionally, a custom VWAP can be generated to coincide with important events, such as FOMC meetings, CPI reports, earnings reports, etc.
Practically speaking, price action can tend to change direction when a significant VWAP is hit, voiding buy and sell signals. Like moving averages, this indicator can show, in real-time, how a buy or sell signal should be interpreted. A significant AVWAP line is a point of interest, and can serve as strong support or resistance, because large institutions may be using those values for entries or exits. For a great analysis of how to use AVWAP, visit the AlphaTrends channel on Youtube here or you can buy Brian Shannon’s “Anchored VWAP” book on Amazon.
Other Usage Notes and Limitations
It's important for traders to be aware of the limitations of any indicator and to use them as part of a broader, well-rounded trading strategy that includes risk management, fundamental analysis, and other tools that can help with reducing false signals, determining trend direction, and providing additional confirmation for a trade decision. Diversifying strategies and not relying solely on one type of indicator or analysis can help mitigate some of these risks.
Additionally, the indicator may take a little longer to load than usual. On the rare occasion where it fails to load, you may need to remove the indicator and add it back to your chart. Also, if you do encounter this problem, avoid redrawing your chart while the indicator is being added to the screen.
Acknowledgements
This script uses the MarketHolidays library by @Protervus. Also, for debugging, the JavaScript-style Debug Console by @algotraderdev and the TimeFormattingLibrary by @twingall were invaluable. And, of course, without Brian Shannon's books, videos, and interviews, this indicator would would not be possible.

Volume Profile [TFO]This indicator generates Volume Profiles from which to display insights about recent Volume Points of Control and High Volume Nodes. Volume Profile is a way to view trading volume by the price where trades have occurred, rather than the time when they occur (as seen by traditional Volume indicators).
By selecting a Resolution Timeframe (1m in this example), we can aggregate the volume at different prices to build a Volume Profile for a specified Profile Timeframe (1D in this example). In this indicator, we make the simple assumption that a given candle's volume is distributed evenly across all points. Realistically, this is seldom the case, but it gives us a starting point to easily estimate the volume at a given price, in turn helping us to build our profiles in a trivial way.
If we do this for all Resolution Timeframe candles within a Profile Timeframe (all 1m candles in a single 1D candle, in this example), then we can successfully aggregate this data and build a full Volume Profile. And thankfully, Pine Script's new polyline feature ultimately allow us to keep more Volume Profiles on our charts. Before polylines, we would have to consider using lines or boxes to represent the individual levels within a given profile, and each script currently has a cap of 500 lines and boxes, respectively. However, one single polyline can be used to draw the complex shape of an entire profile, and we may show up to 100 polylines in a given script. This helps us keep a lot more data on our charts!
Compared to TradingView's Session Volume Profile indicator (blue/yellow), we can see that our indicator (grey) is nearly identical, which verifies that our assumption of a uniform volume distribution is enough to roughly estimate a given Volume Profile. Note in this example the Row Size was set to 200, meaning that 200 levels are used to approximate profiles from each session's high to its low.
Show VPOC will show the volume point of control of each profile, which represents the price level where the largest amount of volume was traded for a given profile. This is shown with the red lines in the following chart.
Extend Last N VPOCs will look for the most recent, user-defined number of VPOCs (not including the current session's VPOC that's still developing) and extend them to the right of the chart as points of reference. The Show Labels Above option will annotate each VPOC with its respective date above a specified timeframe. This way, if one was using Volume Profiles on intraday timeframes, there wouldn't need to be several date strings all showing the same day.
Show Previous HVNs will show high volume nodes from the previous session. The HVN Strength setting is similar to a "pivot strength" that I use in a lot of my scripts - essentially, HVNs are validated by treating them as local highs. With a HVN Strength of 10 for example, if a given level contains more volume than the 10 levels above and below it, then it is validated as a HVN.
For a cleaner look and feel, HVNs can instead be shown as levels (lines) instead of areas (boxes). With levels enabled, solid lines denote the previous session's VPOC, and dotted lines represent all other HVNs. With areas enabled instead, the tops and bottoms will extend above/below the HVN level until a point with greater volume is discovered (marking the "end" of the node).
This indicator can be computationally intensive and may crash from taking too long to execute. In these cases, it's best to disable unused features, decrease the number of Rows, and/or simply reload the chart until it populates.
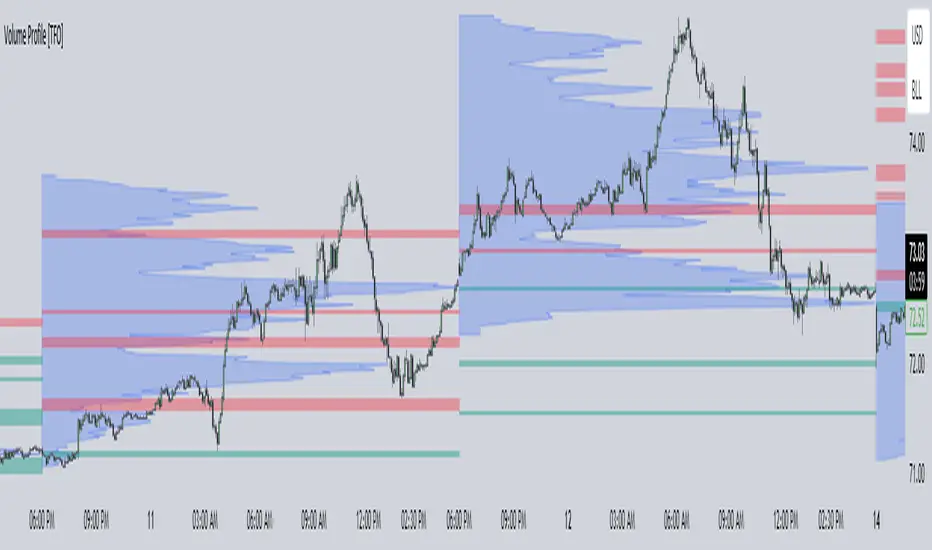
ADX and DI (Colored Candles Open-Source)The "ADX and DI (Colored Candles Open-Source)" indicator is a technical analysis tool used in trading. It utilizes the Average Directional Index (ADX) and the Directional Movement Indicators (+DI and -DI) to assess the strength and direction of a price trend. The ADX is calculated based on a 14-period lookback and is displayed as a histogram.
The color of the ADX histogram varies depending on the ADX value and the relative positions of +DI and -DI. Green and purple colors represent bullish and bearish trends respectively, with variations in shades indicating trend strength. Yellow and red colors indicate potential trend exhaustion for bullish and bearish trends, respectively, when ADX is above 50. Gray color is used when ADX is below 10, indicating a neutral trend.
Additionally, the script plots +DI and -DI lines with a fill between them to visually represent their crossover. Horizontal dotted lines are drawn at key ADX levels (0, 10, 25, 50) for reference. The candles on the chart are also colored to match the ADX histogram, providing a clear visual representation of the market trend.
