PEAD strategy█ OVERVIEW
This strategy trades the classic post-earnings announcement drift (PEAD).
It goes long only when the market gaps up after a positive EPS surprise.
█ LOGIC
1 — Earnings filter — EPS surprise > epsSprThresh %
2 — Gap filter — first regular 5-minute bar gaps ≥ gapThresh % above yesterday’s close
3 — Timing — only the first qualifying gap within one trading day of the earnings bar
4 — Momentum filter — last perfDays trading-day performance is positive
5 — Risk management
• Fixed stop-loss: stopPct % below entry
• Trailing exit: price < Daily EMA( emaLen )
█ INPUTS
• Gap up threshold (%) — 1 (gap size for entry)
• EPS surprise threshold (%) — 5 (min positive surprise)
• Past price performance — 20 (look-back bars for trend check)
• Fixed stop-loss (%) — 8 (hard stop distance)
• Daily EMA length — 30 (trailing exit length)
Note — Back-tests fill on the second 5-minute bar (Pine limitation).
Live trading: enable calc_on_every_tick=true for first-tick entries.
────────────────────────────────────────────
█ 概要(日本語)
本ストラテジーは決算後の PEAD を狙い、
EPS サプライズがプラス かつ 寄付きギャップアップ が発生した銘柄をスイングで買い持ちします。
█ ロジック
1 — 決算フィルター — EPS サプライズ > epsSprThresh %
2 — ギャップフィルター — レギュラー時間最初の 5 分足が前日終値+ gapThresh %以上
3 — タイミング — 決算当日または翌営業日の最初のギャップのみエントリー
4 — モメンタムフィルター — 過去 perfDays 営業日の騰落率がプラス
5 — リスク管理
• 固定ストップ:エントリー − stopPct %
• 利確:終値が日足 EMA( emaLen ) を下抜け
█ 入力パラメータ
• Gap up threshold (%) — 1 (ギャップ条件)
• EPS surprise threshold (%) — 5 (EPS サプライズ最小値)
• Past price performance — 20 (パフォーマンス判定日数)
• Fixed stop-loss (%) — 8 (固定ストップ幅)
• Daily EMA length — 30 (利確用 EMA 期間)
注意 — Pine の仕様上、バックテストでは寄付き 5 分足の次バーで約定します。
実運用で寄付き成行に合わせたい場合は calc_on_every_tick=true を有効にしてください。
────
ご意見や質問があればお気軽にコメントください。
Happy trading!
Cari dalam skrip untuk "20日线角度大于0的股票"

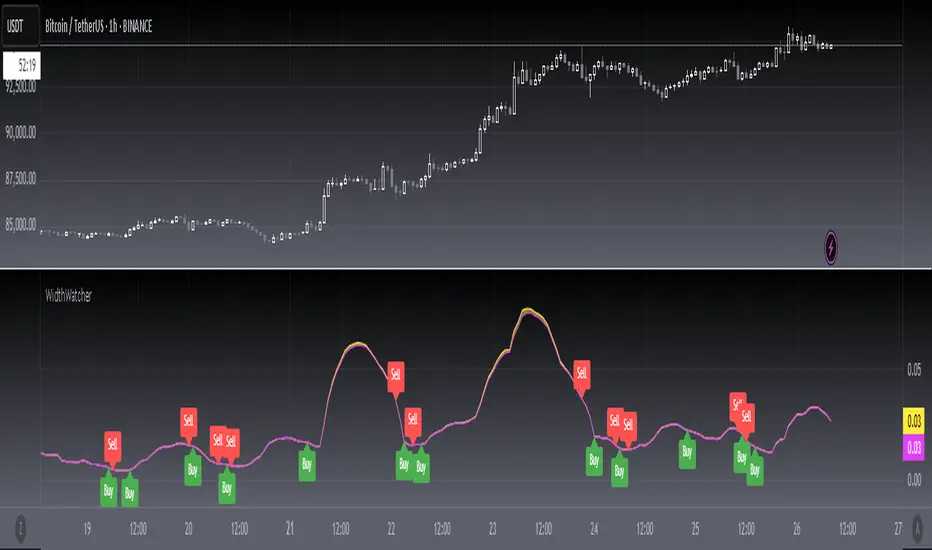
[blackcat] L1 Bollinger Bands Width WatcherOVERVIEW
The Bollinger Bands Width Watcher is an advanced tool designed to monitor the width of Bollinger Bands, providing insights into market volatility and potential trend reversals. This indicator calculates both absolute and relative widths of the bands, plotting them on the chart for easy visualization. It also generates buy and sell signals based on crossover events, helping traders make informed decisions 📊✅.
Today, this article introduces the final member of the Bollinger Bands trio—Bollinger Bands Width (BBW). Derived from the renowned Bollinger Bands, this indicator measures price volatility and identifies trading signals. First, let’s delve into what Bollinger Bands are. They consist of three lines associated with the price of a security:
The middle line is typically a 20-day Simple Moving Average (SMA).
The upper and lower bands represent two standard deviations above and below the middle band.
The Bollinger Bands Width measures the distance between these upper and lower bands.
Bollinger Bands Width = (Upper Band - Lower Band) / Middle Band
Calculating BBW involves subtracting the lower band from the upper band and dividing by the middle band to obtain the BBW value. However, interpreting BBW values alone isn't enough to determine if they're narrow or wide. Different instruments or timeframes might define narrowness differently. To gauge the significance of band narrowing accurately, analyzing past BBW fluctuations alongside price movements is essential.
One prominent theory involving Bollinger Bands is the "squeeze." A squeeze setup comprises two phases:
Low volatility, where bands narrow, and prices move sideways.
Increased volatility, where prices breach either the upper or lower band, initiating a new trend.
During a bullish squeeze, BBW diminishes, and breaking above the upper band signals a new uptrend. Conversely, in a bearish squeeze, BBW declines, and falling below the lower band indicates a new downtrend.
While BBW excels at spotting squeezes, traders must exercise caution. Even with a squeeze setup, a robust market trend might not materialize. Validating breakouts necessitates personal judgment and additional confirmation techniques.
Now, let's explore key parameters and settings:
Length: Defines the period for computing the base SMA, defaulting to 20 days.
Source: Specifies the data source per candle, defaulting to the closing price.
Standard Deviation: Sets the number of standard deviations from the SMA for the upper and lower bands, defaulting to 2.
FEATURES
Calculates Bollinger Bands Width using customizable parameters:
Smoothing Length: Number of bars used for calculating the moving average and standard deviation.
Source Price: Defaults to closing prices but can be adjusted.
Standard Deviation Multiplier: Controls the width of the bands.
Plots two types of Bollinger Bands Width:
Absolute width relative to the basis (Yellow Line).
Relative width compared to the close price (Fuchsia Line).
Fills the area between the two plotted lines for better visual context 🌈
Generates buy ('Buy') and sell ('Sell') labels based on crossover events 🏷️
Provides alerts for crossover signals to notify users of potential trade opportunities 🔔
HOW TO USE
Add the indicator to your TradingView chart by selecting it from the indicators list.
Adjust the Smoothing Length, Source Price, and Standard Deviation Multiplier as needed ⚙️.
Observe the plotted Bollinger Bands Width lines and filled areas for insights into market volatility.
Monitor the chart for buy and sell labels indicating potential trade opportunities.
Set up alerts based on the generated signals to receive notifications when conditions are met 📲.
LIMITATIONS
The indicator may generate false signals in highly volatile or ranging markets 🌪️.
Users should combine this indicator with other forms of analysis for more reliable trading decisions.
The effectiveness of the indicator may vary depending on the asset and timeframe being analyzed.
NOTES
Ensure that you have sufficient historical data available for accurate calculations.
Test the indicator thoroughly on demo accounts before applying it to live trading 🔍.
Customize the appearance and parameters as needed to fit your trading strategy.
RSI Strength & Consolidation Zones (Zeiierman)█ Overview
RSI Strength & Consolidation Zones (Zeiierman) is a hybrid momentum and volatility visualization tool that blends enhanced RSI interpretation with ADX-driven consolidation detection. This indicator doesn't just show where RSI is trending — it interprets how strong that trend is, when that strength changes, and where the market may be consolidating in anticipation of breakout movement.
Using a combination of Kalman-filtered RSI, custom-built DMI/ADX, and low-volatility zone recognition, it gives traders a dynamic RSI with strength-based coloring, while also highlighting consolidation zones to spot breakout opportunities.
█ Its uniqueness
Traditional RSI indicators lack context. They may show you when the market is overbought or oversold, but they won’t tell you how strong that condition is, or whether it’s likely to result in continuation or consolidation.
This tool aims to solve that by introducing adaptive strength metrics and structural compression zones, allowing traders to anticipate when the market is likely preparing for a move.
█ How It Works
⚪ Enhanced RSI
Combines traditional RSI and a custom RSI implementation
Smooths both through a Kalman filter for trend direction
Final RSI line reflects smoothed consensus between manual and built-in RSI
Adds an RSI + Strength overlay to show when the directional conviction is increasing
⚪ ADX-Driven Strength Layer
Directional Movement Index (DMI) is calculated both manually and with built-in smoothing
The average ADX value is used to calculate a strength modifier
When ADX exceeds 20, RSI is dynamically enhanced or dampened to reflect directional force
Resulting visual: RSI appears stronger or weaker based on confirmed trend conditions
⚪ Consolidation Zone Detection
When ADX falls below 20, the indicator enters a consolidation zone state
Boxes are drawn dynamically to contain the price within these low-volatility structures
Once the price breaks out of the zone, the indicator plots a breakout signal (▲ or ▼)
⚪ Breakouts
Breakout markers are placed at the first close outside the consolidation box
These signals serve as early indicators for potential trend continuation or reversal
█ How to Use
⚪ Confirm Momentum Strength
Use the RSI + Strength line to determine whether current momentum is backed by trend conviction. If strength expands alongside rising RSI, the move has confirmation.
⚪ Consolidations Zones
When RSI is around the midline, and a consolidation box appears, expect lower volatility and a range-bound market, followed by a breakout.
⚪ Use Breakout Signals for Entry
Look for ▲ or ▼ markers as early triggers. These often coincide with volume expansions or structural breaks.
█ Settings Explained
RSI Length – Number of bars used for RSI. Shorter = more sensitive.
DMI Length – Used in both custom and built-in ADX/DI calculations.
ADX Smoothing – Smooths the trend strength signal. Higher values = smoother strength detection.
Trend Confirmation (Filter Strength) – Adjusts the responsiveness of the Kalman filter.
-----------------
Disclaimer
The content provided in my scripts, indicators, ideas, algorithms, and systems is for educational and informational purposes only. It does not constitute financial advice, investment recommendations, or a solicitation to buy or sell any financial instruments. I will not accept liability for any loss or damage, including without limitation any loss of profit, which may arise directly or indirectly from the use of or reliance on such information.
All investments involve risk, and the past performance of a security, industry, sector, market, financial product, trading strategy, backtest, or individual's trading does not guarantee future results or returns. Investors are fully responsible for any investment decisions they make. Such decisions should be based solely on an evaluation of their financial circumstances, investment objectives, risk tolerance, and liquidity needs.

NR4/NR7 + Trend + MACD + VWAP FilterThe Ultimate Momentum-Compression Strategy
This strategy merges the power of price compression and trend confirmation, ensuring you're trading when the market is coiled and ready to move. By combining multiple filters—NR4/NR7, trend alignment, MACD momentum, and VWAP support—this setup identifies high-probability trade opportunities in dynamic, trending stocks. Here's how it works:
NR4/NR7 Patterns: These are narrow-range days where the current price range is smaller than the previous 4 or 7 days. This signals potential breakout or continuation setups, as the market is compressing before making a move.
Trend Confirmation: To ensure you're not trading against the current trend, the price must be above the 20 EMA, and the 10 EMA must be above the 20 EMA. This confirms a bullish structure, with the price trending in your favour.
MACD Momentum: The fast MACD line must be above the slow MACD line, confirming the trend is not only intact but also gaining momentum.
VWAP Filter: Price must be above the VWAP (Volume Weighted Average Price). This is the final confirmation that the market is in a strong, bullish phase, with buyers dominating the market.
By requiring all these conditions to align, this strategy takes the guesswork out of day trading. It ensures you're trading within a well-established trend, with compression patterns and momentum backing your trade. The result? You’re entering positions with confidence and clarity, poised to ride strong, sustained moves.
This strategy is for the trader who values both flexibility and discipline—able to capture dynamic moves while staying aligned with market structure and momentum. It’s a refined, systematic approach that makes decisions clear, without the emotional second-guessing.

Stochastics + CM Williams VixFix (Simple Buy Signal)📈 Stochastics + CM Williams VixFix (Simple Buy Signal)
This indicator combines two powerful tools to detect potential bottoming opportunities:
✅ Stochastics: Looks for momentum reversals. A signal is triggered when both %K and %D are below the oversold threshold (default: 20), suggesting the asset is deeply oversold.
✅ CM Williams Vix Fix: A volatility-based fear detector. When it spikes above its dynamic threshold, it indicates potential panic selling — often preceding a market bounce.
💡 Buy Signal is generated when:
%K and %D are both below 20
VixFix shows a volatility spike (green condition)
Use this script to identify high-probability reversal setups, especially during market corrections or panic phases.
Aggregate PDH High Break Alert**Aggregate PDH High Break Alert**
**Overview**
The “Aggregate PDH High Break Alert” is a lightweight Pine Script v6 indicator designed to instantly notify you when today’s price breaks above any prior-day high in a user-defined lookback window. Instead of manually scanning dozens of daily highs, this script automatically loops through the last _N_ days (up to 100) and fires a single-bar alert the moment price eclipses a specific day’s high.
**Key Features**
- **Dynamic Lookback**: Choose any lookback period from 1 to 100 days via a single `High-Break Lookback` input.
- **Single Security Call**: Efficiently retrieves the entire daily-high series in one call to avoid TradingView’s 40-call security limit.
- **Automatic Looping**: Internally loops through each prior-day high, so there’s no need to manually code dozens of lines.
- **Custom Alerts**: Generates a clear, formatted alert message—e.g. “Crossed high from 7 day(s) ago”—for each breakout.
- **Lightweight & Maintainable**: Compact codebase (<15 lines) makes tweaking and debugging a breeze.
**Inputs**
- **High-Break Lookback (days)**: Number of past days to monitor for high breaks. Valid range: 1–100.
**How to Use**
1. **Add to Chart**: Open TradingView, click “Indicators,” then “Create,” and paste in the code.
2. **Configure Lookback**: In the script’s settings, set your desired lookback window (e.g., 20 for the past 20 days).
3. **Enable Alerts**: Right-click the indicator’s name on your chart, select “Add Alert on Aggregate PDH High Break Alert,” and choose “Once per bar close.”
4. **Receive Notifications**: Whenever price crosses above any of the specified prior-day highs, you’ll get an on-screen and/or mobile push alert with the exact number of days ago.
**Use Cases**
- **Trend Confirmation**: Confirm fresh bullish momentum when today’s high outpaces any of the last _N_ days.
- **Breakout Trading**: Automate entries off multi-day highs without manual chart scanning.
- **System Integration**: Integrate with alerts to trigger orders in third-party bots or webhook receivers.
**Disclaimer**
Breakouts alone do not guarantee sustained moves. Combine with your preferred risk management, volume filters, and other indicators for higher-probability setups. Use on markets and timeframes where daily breakout behavior aligns with your strategy.

Zen MIG Reversal V1**Zen MIG Reversal V1**
Zen MIG Reversal is a pattern-based indicator that highlights rare reversal setups.
It’s designed to support traders in visually identifying potential turning points, especially following strong momentum or gap-style moves.
**How it works:**
- **Bullish Reversal:**
Detects 3 consecutive bullish candles. The third bar must have a low above the high of the first bar and below the 20 EMA. When this occurs, a light blue box is drawn across the 3-bar range, from high to the current bar’s low. A blue arrow appears below the prior bar.
- **Bearish Reversal:**
Detects 3 consecutive bearish candles. The third bar must have a high below the low of the first bar and above the 20 EMA. A light red box is drawn from low to the current bar’s high. A red arrow appears above the prior bar.
- Optional settings allow you to:
- Show or hide the EMA line
- Toggle the arrows
- Adjust smoothing settings for context
**Purpose:**
It’s best used for discretionary analysis, journaling, or studying price behavior in momentum-driven environments.
**Disclaimer:**
This script is for educational and informational purposes only. It does not provide financial advice or trade recommendations. Always backtest and use proper risk management before applying any indicator to live trading.

The Mayan CalendarThis indicator displays the current date in the Mayan Calendar, based on real-time UTC time. It calculates and presents:
🌀 Long Count (Baktun.Katun.Tun.Uinal.Kin) – A linear count of days since the Mayan epoch (August 11, 3114 BCE).
🔮 Tzolk'in Date – A 260-day sacred cycle combining a number (1–13) and one of 20 day names (e.g., 4 Ajaw).
🌾 Haab' Date – A 365-day civil cycle divided into 18 months of 20 days + 5 "nameless" days (Wayeb').
The calculations follow Smithsonian standards and align with the Maya Calendar Converter from the National Museum of the American Indian:
👉 maya.nmai.si.edu
The results are shown in a table overlay on your chart's top-right corner. This indicator is great for symbolic traders, astro enthusiasts, or anyone interested in ancient timekeeping systems woven into financial timeframes. Enjoy, time travelers! ⌛

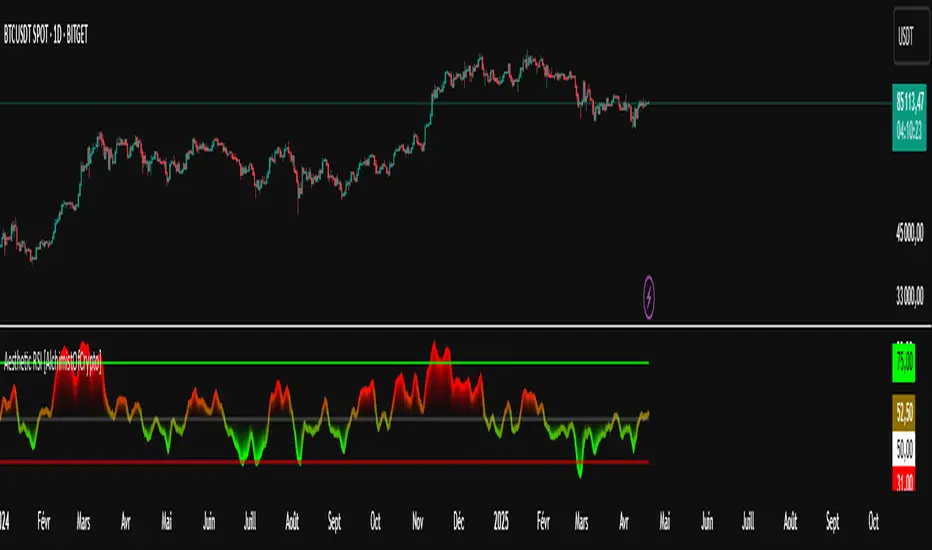
Aesthetic RSI [AlchimistOfCrypto]🌌 Aesthetic RSI – Unveiling the Fractal Forces of Markets 🌌
Category: Momentum Indicators 📈
"The RSI oscillator, formalized through an advanced mathematical prism, reveals the underlying fractal structures of price movements. This indicator draws inspiration from quantum principles of divergence-convergence where the probability of a return to equilibrium increases proportionally to the distance from the median point. Our implementation employs sophisticated algorithmic smoothing to filter out the stochastic noise inherent in financial markets, allowing visualization of the true momentum forces according to thermodynamic entropy principles applied to trading systems."
📊 Professional Trading Application
The Aesthetic RSI is a visually stunning and mathematically refined take on the classic Relative Strength Index. With customizable settings, advanced smoothing, and eight unique visual palettes, it empowers traders to detect momentum shifts and divergences with unparalleled clarity.
⚙️ Indicator Configuration
- Length 📏
The core parameter (default: 20) that determines the calculation period.
- Lower values (8-14): Increase sensitivity for short-term trading.
- Higher values (21-34): Provide stronger signals for position trading.
- OverBought/OverSold Thresholds 🎯
Customizable boundaries (default: 75/25) to identify extreme market conditions.
- Calibrate based on asset volatility: Higher volatility assets may need wider thresholds (80/20) to reduce false signals.
- Style 🎨
Eight meticulously crafted visual palettes optimized for pattern recognition:
- Miami Vice (default): High-contrast cyan/magenta scheme for spotting divergences.
- Cyberpunk: Yellow/purple combo to highlight momentum shifts.
- Classic: Traditional green/red for conventional analysis.
- High Contrast: Maximum visual separation for traders with visual impairments.
- Specialized palettes (Forest, Ocean, Fire, Monochrome): Tailored for diverse market conditions.
- Mode Selection 🔄
- Full: Displays a complete gradient spectrum across the RSI range, emphasizing momentum transitions between 35-65.
- OverZone: Focuses on actionable extreme zones, reducing noise in ranging markets.
🚀 How to Use
1. Adjust Length ⏰: Set the period based on your trading style (short-term or long-term).
2. Fine-Tune Thresholds 🎚️: Customize overbought/oversold levels to match the asset’s volatility.
3. Select a Palette 🌈: Choose a visual style that enhances your pattern recognition.
4. Choose Mode 🔍: Use "Full" for detailed momentum analysis or "OverZone" for extreme zone focus.
5. Spot Divergences ✅: Look for price-RSI divergences to anticipate reversals.
6. Trade with Precision 🛡️: Combine with other indicators for high-probability setups.
📅 Release Notes (April 2025)
Aesthetic RSI blends quantum-inspired mathematics with artistic visualization, redefining momentum analysis. Stay tuned for future enhancements! ✨
🏷️ Tags
#Trading #TechnicalAnalysis #RSI #Momentum #Divergence #MultiTimeframe #TradingStrategy #RiskManagement #Forex #Stocks #Crypto #Bitcoin #AlgoTrading #DayTrading #SwingTrading #TheAlchimist #QuantumTrading #VisualTrading #PatternRecognition
Session Breakouts & Trend Indicator# Session Breakouts & Trend Indicator
This indicator identifies high-probability trading opportunities by tracking key intraday sessions and their breakouts while aligning them with the overall market trend direction.
## What Makes This Indicator Unique
Unlike standard breakout indicators that only identify when price crosses a threshold, this indicator:
- Dynamically identifies and tracks important daily sessions (default: AM 09:00-10:00 and PM 15:00-16:00)
- Determines trend direction using a triple EMA system (20/50/200)
- Shows when breakouts align with the overall trend (higher probability setups)
- Provides visual confirmation with session ranges, breakout levels, and background highlighting
- Includes a comprehensive information panel showing trend/session alignment
## How It Works
The indicator tracks two important daily sessions:
1. **AM Session**: Typically the first hour of trading (default: 09:00-10:00)
2. **PM Session**: Typically the last hour of trading (default: 15:00-16:00)
For each session, it:
- Marks the high and low range
- Establishes breakout levels above/below these ranges
- Detects when price breaks beyond these levels
- Determines if the breakout aligns with the prevailing trend
The trend is calculated using three EMAs (20, 50, 200) for reliable trend identification.
## How To Use
1. Apply the indicator to your chart (works best on 5-minute timeframes)
2. Adjust session times to match your trading schedule if needed
3. Watch for breakouts above session highs (bullish) or below session lows (bearish)
4. Check the information panel to see if the breakout aligns with the trend
5. Enter trades in the direction of trend-aligned breakouts for higher probability setups
6. Set stop losses below the opposite side of the session range
## Settings
- **Session Times**: Customize AM and PM session times
- **EMA Lengths**: Adjust trend determination sensitivity
- **Visualization Options**: Toggle display of sessions, breakouts, and VWAP
- **Alert Settings**: Configure alerts for breakouts and trend-aligned conditions
This indicator is valuable for day traders and swing traders looking for objective entry points with higher probability of success.

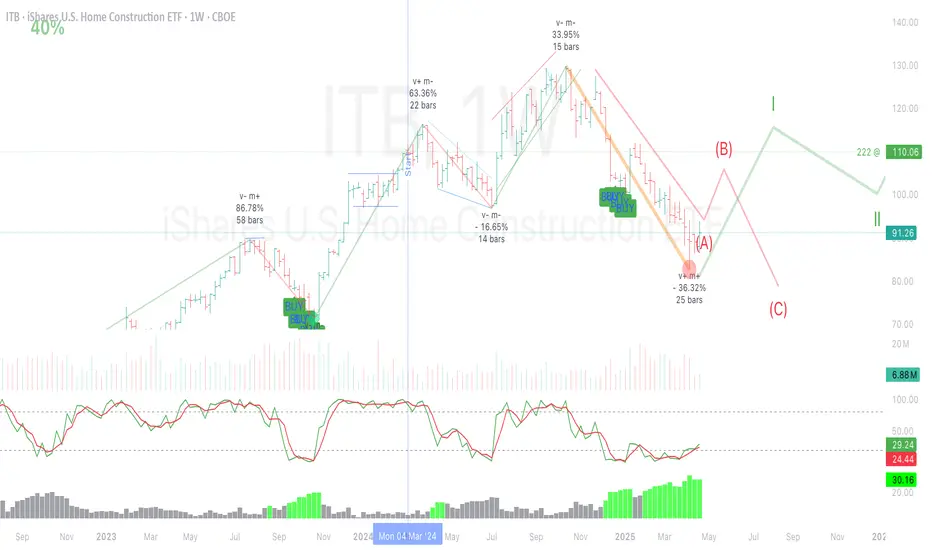
TASC 2025.05 Trading The Channel█ OVERVIEW
This script implements channel-based trading strategies based on the concepts explained by Perry J. Kaufman in the article "A Test Of Three Approaches: Trading The Channel" from the May 2025 edition of TASC's Traders' Tips . The script explores three distinct trading methods for equities and futures using information from a linear regression channel. Each rule set corresponds to different market behaviors, offering flexibility for trend-following, breakout, and mean-reversion trading styles.
█ CONCEPTS
Linear regression
Linear regression is a model that estimates the relationship between a dependent variable and one or more independent variables by fitting a straight line to the observed data. In the context of financial time series, traders often use linear regression to estimate trends in price movements over time.
The slope of the linear regression line indicates the strength and direction of the price trend. For example, a larger positive slope indicates a stronger upward trend, and a larger negative slope indicates the opposite. Traders can look for shifts in the direction of a linear regression slope to identify potential trend trading signals, and they can analyze the magnitude of the slope to support trading decisions.
One caveat to linear regression is that most financial time series data does not follow a straight line, meaning a regression line cannot perfectly describe the relationships between values. Prices typically fluctuate around a regression line to some degree. As such, analysts often project ranges above and below regression lines, creating channels to model the expected extent of the data's variability. This strategy constructs a channel based on the method used in Kaufman's article. It measures the maximum distances from points on the linear regression line to historical price values, then adds those distances and the current slope to the regression points.
Depending on the trading style, traders might look for prices to move outside an established channel for breakout signals, or they might look for price action to reach extremes within the channel for potential mean reversion opportunities.
█ STRATEGY CALCULATIONS
Primary trade rules
This strategy implements three distinct sets of rules for trend, breakout, and mean-reversion trades based on the methods Kaufman describes in his article:
Trade the trend (Rule 1) : Open new positions when the sign of the slope changes, indicating a potential trend reversal. Close short trades and enter a long trade when the slope changes from negative to positive, and do the opposite when the slope changes from positive to negative.
Trade channel breakouts (Rule 2) : Open new positions when prices cross outside the linear regression channel for the current sample. Close short trades and enter a long trade when the price moves above the channel, and do the opposite when the price moves below the channel.
Trade within the channel (Rule 3) : Open new positions based on price values within the channel's range. Close short trades and enter a long trade when the price is near the channel's low, within a specified percentage of the channel's range, and do the opposite when the price is near the channel's high. With this rule, users can also filter the trades based on the channel's slope. When the filter is active, long positions are allowed only when the slope is positive, and short positions are allowed only when it is negative.
Position sizing
Kaufman's strategy uses specific trade sizes for equities and futures markets:
For an equities symbol, the number of shares traded is $10,000 divided by the current price.
For a futures symbol, the number of contracts traded is based on a volatility-adjusted formula that divides $25,000 by the product of the 20-bar average true range and the instrument's point value.
By default, this script automatically uses these sizes for its trade simulation on equities and futures symbols and does not simulate trading on other symbols. However, users can control position sizes from the "Settings/Properties" tab and enable trade simulation on other symbol types by selecting the "Manual" option in the script's "Position sizing" input.
Stop-loss
This strategy includes the option to place an accompanying stop-loss order for each trade, which users can enable from the "SL %" input in the "Settings/Inputs" tab. When enabled, the strategy places a stop-loss order at a specified percentage distance from the closing price where the entry order occurs, allowing users to compare how the strategy performs with added loss protection.
█ USAGE
This strategy adapts its display logic for the three trading approaches based on the rule selected in the "Trade rule" input:
For all rules, the script plots the linear regression slope in a separate pane. The plot is color-coded to indicate whether the current slope is positive or negative.
When the selected rule is "Trade the trend", the script plots triangles in the separate pane to indicate when the slope's direction changes from positive to negative or vice versa. Additionally, it plots a color-coded SMA on the main chart pane, allowing visual comparison of the slope to directional changes in a moving average.
When the rule is "Trade channel breakouts" or "Trade within the channel", the script draws the current period's linear regression channel on the main chart pane, and it plots bands representing the history of the channel values from the specified start time onward.
When the rule is "Trade within the channel", the script plots overbought and oversold zones between the bands based on a user-specified percentage of the channel range to indicate the value ranges where new trades are allowed.
Users can customize the strategy's calculations with the following additional inputs in the "Settings/Inputs" tab:
Start date : Sets the date and time when the strategy begins simulating trades. The script marks the specified point on the chart with a gray vertical line. The plots for rules 2 and 3 display the bands and trading zones from this point onward.
Period : Specifies the number of bars in the linear regression channel calculation. The default is 40.
Linreg source : Specifies the source series from which to calculate the linear regression values. The default is "close".
Range source : Specifies whether the script uses the distances from the linear regression line to closing prices or high and low prices to determine the channel's upper and lower ranges for rules 2 and 3. The default is "close".
Zone % : The percentage of the channel's overall range to use for trading zones with rule 3. The default is 20, meaning the width of the upper and lower zones is 20% of the range.
SL% : If the checkbox is selected, the strategy adds a stop-loss to each trade at the specified percentage distance away from the closing price where the entry order occurs. The checkbox is deselected by default, and the default percentage value is 5.
Position sizing : Determines whether the strategy uses Kaufman's predefined trade sizes ("Auto") or allows user-defined sizes from the "Settings/Properties" tab ("Manual"). The default is "Auto".
Long trades only : If selected, the strategy does not allow short positions. It is deselected by default.
Trend filter : If selected, the strategy filters positions for rule 3 based on the linear regression slope, allowing long positions only when the slope is positive and short positions only when the slope is negative. It is deselected by default.
NOTE: Because of this strategy's trading rules, the simulated results for a specific symbol or channel configuration might have significantly fewer than 100 trades. For meaningful results, we recommend adjusting the start date and other parameters to achieve a reasonable number of closed trades for analysis.
Additionally, this strategy does not specify commission and slippage amounts by default, because these values can vary across market types. Therefore, we recommend setting realistic values for these properties in the "Cost simulation" section of the "Settings/Properties" tab.

Weighted Ichimoku StrategyLSE:HSBA
The Ichimoku Kinko Hyo indicator is a comprehensive tool that combines multiple signals to identify market trends and potential buying/selling opportunities. My weighted variant of this strategy attempts to assign specific weights to each signal, allowing for a more nuanced and customizable approach to trend identification. The intent is to try and make a more informed trading decision based on the cumulative strength of various signals.
I've tried not to make it a mishmash of this and that + MACD + RSI and on and on; most people have their preferred indicator that focuses on just that that they can use in conjunction.
The signals used can be grouped into two groups the 'Core Ichimoku Signals' & the 'Additional Signals' (at the end you will find the signals and their assigned weights followed by the thresholds where they align).
The Core Ichimoku Signals are the primary signals used in Ichimoku analysis, including Kumo Breakout, Chikou Cross, Kijun Cross, Tenkan Cross, and Kumo Twist.
While the Additional Signals provide further insights and confirmations, such as Kijun Confirmation, Tenkan-Kijun Above Cloud, Chikou Above Cloud, Price-Kijun Cross, Chikou Span Signal, and Price Positioning.
Entries are triggered when the cumulative weight of bullish signals exceeds a specified buy threshold, indicating a strong uptrend or potential trend reversal.
Exits are initiated when the cumulative weight of bearish signals surpasses a specified sell threshold, or when additional conditions such as consolidation patterns or ATR-based targets are met.
There are various exit types that you can choose between, which can be used separately or in conjunction with one another. As an example you might want to exit on a different condition during consolidation periods than during other periods or just use ATR with some other backstop.
They are listed in evaluation order i.e. ATR trumps all, Consolidation exit trumps the regular Kumo sell and so on:
**ATR Sell**: Exits trades based on ATR-based profit targets and stop-losses.
**Consolidation Exit**: Exits trades during consolidation periods to reduce drawdown.
**Sell Below Kumo**: Exits trades when the price is below the Kumo, indicating a potential downtrend.
**Sell Threshold**: Exits trades when the cumulative weight of bearish signals surpasses a specified sell threshold.
There are various 'filters' which are really behavior modifiers:
**Kumo Breakout Filter**: Requires price to close above the Kumo for buy signals (essentially a entry delay).
**Whipsaw Filter**: Ensures trend strength over specified days to reduce false signals.
**Buy Cooldown**: Prevents new entries until half the Kijun period passes after an exit (prevents flapping).
**Chikou Filter**: Delays exits unless the previous close is below the Chikou Span.
**Consolidation Trend Filter**: Prevents consolidation exits if the trend is bullish (rare, but happens).
Then there are some debugging options. Ichimoku periods have some presets (personally I like 8/22/44/22) but are freely configurable, preset to the traditional values for purists.
The list of signals and most thresholds follow, play around with them. Thats all.
Cheers,
**Core Ichimoku Signals**
**Kumo Breakout**
- 30 (Bullish) / -30 (Bearish)
- Indicates a strong trend when the price breaks above (bullish) or below (bearish) the Kumo (cloud). This signal suggests a significant shift in market sentiment.
**Chikou Cross**
- 20 (Bullish) / -20 (Bearish)
- Shows the relationship between the Chikou Span (lagging span) and the current price. A bullish signal occurs when the Chikou Span is above the price, indicating a potential uptrend. Conversely, a bearish signal occurs when the Chikou Span is below the price, suggesting a downtrend.
**Kijun Cross**
- 15 (Bullish) / -15 (Bearish)
- Signals trend changes when the Tenkan-sen (conversion line) crosses above (bullish) or below (bearish) the Kijun-sen (base line). This crossover is often used to identify potential trend reversals.
**Tenkan Cross**
- 10 (Bullish) / -10 (Bearish)
- Indicates short-term trend changes when the price crosses above (bullish) or below (bearish) the Tenkan-sen. This signal helps identify minor trend shifts within the broader trend.
**Kumo Twist**
- 5 (Bullish) / -5 (Bearish)
- Shows changes in the Kumo's direction, indicating potential trend shifts. A bullish Kumo Twist occurs when Senkou Span A crosses above Senkou Span B, and a bearish twist occurs when Senkou Span A crosses below Senkou Span B.
**Additional Signals**
**Kijun Confirmation**
- 8 (Bullish) / -8 (Bearish)
- Confirms the trend based on the price's position relative to the Kijun-sen. A bullish signal occurs when the price is above the Kijun-sen, and a bearish signal occurs when the price is below it.
**Tenkan-Kijun Above Cloud**
- 5 (Bullish) / -5 (Bearish)
- Indicates a strong bullish trend when both the Tenkan-sen and Kijun-sen are above the Kumo. Conversely, a bearish signal occurs when both lines are below the Kumo.
**Chikou Above Cloud**
- 5 (Bullish) / -5 (Bearish)
- Shows the Chikou Span's position relative to the Kumo, indicating trend strength. A bullish signal occurs when the Chikou Span is above the Kumo, and a bearish signal occurs when it is below.
**Price-Kijun Cross**
- 2 (Bullish) / -2 (Bearish)
- Signals short-term trend changes when the price crosses above (bullish) or below (bearish) the Kijun-sen. This signal is similar to the Kijun Cross but focuses on the price's direct interaction with the Kijun-sen.
**Chikou Span Signal**
- 10 (Bullish) / -10 (Bearish)
- Indicates the trend based on the Chikou Span's position relative to past price highs and lows. A bullish signal occurs when the Chikou Span is above the highest high of the past period, and a bearish signal occurs when it is below the lowest low.
**Price Positioning**
- 10 (Bullish) / -10 (Bearish)
- Shows indecision when the price is between the Tenkan-sen and Kijun-sen, indicating a potential consolidation phase. A bullish signal occurs when the price is above both lines, and a bearish signal occurs when the price is below both lines.
**Confidence Level**: Highly Sensitive
- **Buy Threshold**: 50
- **Sell Threshold**: -50
- **Notes / Significance**: ~2–3 signals, very early trend detection. High sensitivity, may capture noise and false signals.
**Confidence Level**: Entry-Level
- **Buy Threshold**: 58
- **Sell Threshold**: -58
- **Notes / Significance**: ~3–4 signals, often Chikou Cross or Kumo Breakout. Very sensitive, risks noise (e.g., false buys in choppy markets).
**Confidence Level**: Entry-Level
- **Buy Threshold**: 60
- **Sell Threshold**: -60
- **Notes / Significance**: ~3–4 signals, Kumo Breakout or Chikou Cross anchors. Entry point for early trends.
**Confidence Level**: Moderate
- **Buy Threshold**: 65
- **Sell Threshold**: -65
- **Notes / Significance**: ~4–5 signals, balances sensitivity and reliability. Suitable for moderate risk tolerance.
**Confidence Level**: Conservative
- **Buy Threshold**: 70
- **Sell Threshold**: -70
- **Notes / Significance**: ~4–5 signals, emphasizes stronger confirmations. Reduces false signals but may miss some opportunities.
**Confidence Level**: Very Conservative
- **Buy Threshold**: 75
- **Sell Threshold**: -75
- **Notes / Significance**: ~5–6 signals, prioritizes high confidence. Minimizes risk but may enter trades late.
**Confidence Level**: High Confidence
- **Buy Threshold**: 80
- **Sell Threshold**: -80
- **Notes / Significance**: ~6–7 signals, very strong confirmations needed. Suitable for cautious traders.
**Confidence Level**: Very High Confidence
- **Buy Threshold**: 85
- **Sell Threshold**: -85
- **Notes / Significance**: ~7–8 signals, extremely high confidence required. Minimizes false signals significantly.
**Confidence Level**: Maximum Confidence
- **Buy Threshold**: 90
- **Sell Threshold**: -90
- **Notes / Significance**: ~8–9 signals, maximum confidence level. Ensures trades are highly reliable but may result in fewer trades.
**Confidence Level**: Ultra Conservative
- **Buy Threshold**: 100
- **Sell Threshold**: -100
- **Notes / Significance**: ~9–10 signals, ultra-high confidence. Trades are extremely reliable but opportunities are rare.
**Confidence Level**: Extreme Confidence
- **Buy Threshold**: 110
- **Sell Threshold**: -110
- **Notes / Significance**: All signals align, extreme confidence. Trades are almost certain but very few opportunities.

AI-123's BTC vs Gold (Lag Correlation)
DISCLAIMER
I made this indicator with the help of ChatGPT and using what I have learned so far from The Pine Script Mastery Course, LOTS of edits based on what I have learned so far had to be made as well as additions and modifications to my liking thanks to what I have learned so far. I am aware this already exists but I have done my best to make a first ever script/indicator while learning how to properly publish as well, so please bear that in mind.
Overview
This indicator analyzes the correlation between Bitcoin (BTC) and Gold (XAUUSD), with a customizable lag applied to the Gold price, providing insight into the macro relationship between these two assets.
It is designed for traders and investors who want to track how Bitcoin and Gold move in relation to each other, particularly when Gold is lagged by a specific number of days.
Key Features:
BTC and Gold (Lagged) Price Overlay: Display Bitcoin (BTC) and Gold (XAUUSD) prices on the chart, with an adjustable lag applied to the Gold price.
Rolling Correlation Calculation: Measures the correlation between Bitcoin and lagged Gold prices over a customizable lookback period.
Adjustable Lag: The number of days that Gold is lagged relative to Bitcoin is fully customizable (default: 20 days).
Customizable Correlation Length: Allows you to choose the lookback period for the correlation (default: 50 days), providing flexibility for short-term or long-term analysis.
Normalized Plotting: Prices of Bitcoin and Gold are normalized for better visual alignment with the correlation values. BTC is divided by 1000, and Gold by 100.
Correlation Scaling: The correlation value is amplified by 10 for better visual clarity and comparison with price data.
Zero Line: Horizontal line representing a correlation of 0, making it easier to identify positive or negative correlation shifts.
Maximum Correlation Lines: Horizontal lines at +10 and -10 values for extreme correlation scenarios.
Input Settings:
Gold Symbol: Customize the Gold ticker (default: OANDA:XAUUSD).
Bitcoin Symbol: Customize the Bitcoin ticker (default: BINANCE:BTCUSDT).
Lag (in trading days): Adjust the number of trading days to lag the Gold price relative to Bitcoin (default: 20).
Correlation Length (days): Set the number of days over which the rolling correlation is calculated (default: 50).
How to Use:
Price Comparison: The BTC (Spot) and Lagged Gold plots give you a side-by-side visual comparison of the two assets, normalized for clarity.
Correlation Line: The correlation line helps you gauge the strength and direction of the relationship between BTC and lagged Gold. Positive values indicate a strong positive correlation, while negative values indicate a negative correlation.
Visual Analysis: Watch how the correlation shifts with changes in lag and correlation length to identify potential market dynamics between Bitcoin and Gold.
Potential Applications:
Macro Trading: Track how Bitcoin and Gold behave in relation to each other during periods of economic uncertainty or inflation.
Sentiment Analysis: Use the correlation data to understand the sentiment between digital and traditional assets.
Strategic Timing: Identify potential opportunities where Bitcoin and Gold show a strong correlation or diverge based on the lag adjustment.
Understanding Macro Trends/Correlations.
Disclaimer:
This indicator is for informational purposes only. The correlation between Bitcoin and Gold does not guarantee future performance, and users should conduct their own research and use risk management strategies when making trading decisions.
Notes: This script uses historical data, so results may vary across different timeframes.
Customization options allow users to adjust the lag and correlation length to better fit their trading strategy.
Future Enhancements: Additional Correlation Line: A second correlation line for different lengths of lag or different assets.
Color-Coding of Correlation: Future updates may include color-coded correlation strength, visually indicating positive or negative correlation more effectively.

Triple Confirmation Scalper v2 - Alarm CompatibleTriple Confirmation Scalper Strategy
A high-probability scalping strategy combining trend momentum, overbought/sold conditions, and volume confirmation to filter low-noise signals.
📊 Strategy Logic
Trend Direction
Dual EMA crossover (9 & 21 periods) for momentum and trend bias.
Overbought/Oversold Zones
RSI (14-period) to avoid entries at extremes.
Volume Spike Filter
OBV + 20-period volume average to confirm breakout validity.
Dynamic Risk Management
Stop-loss: Adaptive to recent price action (5-candle low/high ±1%).
Take-profit: 1.5% target (1.5:1 risk/reward).
🔍 Advanced Features
Precision VWAP (20-period, HLC3-based) for dynamic S/R levels.
Visual Aids:
EMA/VWAP bands + trend-colored background.
Volume spike alerts.
TradingView Alerts pre-configured for long/short signals.
⚙️ Default Settings
Commission: 0.1% factored into backtests.
Mode: Supports both long/short positions.
⚠️ Disclaimer
This is a technical analysis tool, not financial advice.
Past performance ≠ future results. Test thoroughly in a demo account.
Adjust parameters (e.g., EMA periods, RSI thresholds) to match your risk tolerance.
✅ TradingView Compliance Notes:
No exaggerated claims (e.g., "100% win rate").
Clear disclaimer included.
Focus on objective strategy logic (no promotional language).

Balancelink : Partition Function 1.0This script computes the partition function values 𝑝(𝑛) using Euler’s Pentagonal Number Theorem and displays them in a horizontally wrapped table directly on the chart. The partition function is a classic function in number theory that counts the number of ways an integer 𝑛 can be expressed as a sum of positive integers, disregarding the order of the summands.
Key Features
Efficient Calculation:
The script computes 𝑝(𝑛) for all orders from 0 up to a user-defined maximum (set by the "End Order" input). The recursive computation leverages Euler’s Pentagonal Number Theorem, ensuring the function is calculated correctly for each order.
Display Range Selection:
Users can select a specific range of orders (for example, from 𝑛 = 100 to 𝑛 = 200 to display.) This means you can focus on a particular segment of the partition function results without cluttering the chart.
Horizontally Wrapped Table:
The partition values are organized into a clean, horizontal table with a customizable number of columns per row (default is 20). When the number of values exceeds the maximum columns, the table automatically wraps onto a new set of rows for better readability.
Medium Text Size:
The table cells use a medium (normal) text size for easy viewing and clarity.
How to Use
Inputs:
Start Order (n): The starting index from which you want to display the partition function (default is 100).
End Order (n): The ending index up to which the partition function values will be displayed (default is 200).
Max Columns Per Row: Determines how many results are shown per row before wrapping to the next (default is 20).
Calculation:
The script calculates all 𝑝(𝑛) values from 0 up to the specified "End Order". It then extracts and displays only the values in the chosen range.
Visualization:
The computed values are shown in a neatly arranged table at the top right of your TradingView chart, making it simple to scroll through and inspect the partition function values.
Use Cases
Educational & Research:
Ideal for educators and students exploring concepts of integer partitions and number theory.
Data Analysis & Pattern Recognition:
Useful for those interested in the behavior and growth of partition numbers as 𝑛 increases.

Fractal Pattern AnalysisFractal Pattern Key Elements and How to Read Them
1. Williams Fractals (Triangle Markers)
Red Triangles Pointing Down: Bearish fractals - potential resistance points and selling opportunities
Green Triangles Pointing Up: Bullish fractals - potential support points and buying opportunities
When to Act: Look for bullish fractals forming during uptrends and bearish fractals during downtrends
2. Moving Averages
Yellow Line (20 EMA): Short-term trend
Blue Line (50 EMA): Medium-term trend
Red Line (200 EMA): Long-term trend
Interpretation: When shorter MAs cross above longer MAs, it's bullish; when they cross below, it's bearish
Key Signal: The alignment of all three MAs (stacked in order) confirms a strong trend
3. Background Color
Green Background: Uptrend (all MAs aligned bullishly)
Red Background: Downtrend (all MAs aligned bearishly)
Yellow Background: Sideways/neutral market (MAs not clearly aligned)
4. Market Structure Markers (Small Circles)
Green Circles: Higher highs and higher lows (bullish structure)
Red Circles: Lower highs and lower lows (bearish structure)
Pattern Recognition: Multiple green circles suggest continuing uptrend; multiple red circles suggest continuing downtrend
5. Reversal Diamonds ("Rev" Markers)
Yellow Diamonds: Potential trend reversal points
Usage: These mark where the current trend might be changing direction
Confirmation: Wait for price to close beyond the diamond before acting
6. Bollinger Bands (Blue Lines with Fill)
Middle Band: 20-period SMA
Upper/Lower Bands: Volatility channels
Signals: Price touching upper band in uptrend is strength; touching lower band in downtrend is weakness
Squeeze: When bands narrow, expect a volatility breakout soon
7. Status Table (Top Right)
Shows current trend, volume direction, and overall signal at a glance
"BUY" signal appears when multiple bullish conditions align
"SELL" signal appears when multiple bearish conditions align

RSI VWAP POC [Uncle Sam Trading]Category: Oscillators, Volume, Market Profile
Timeframe: Suitable for all timeframes
Markets: Crypto, Forex, Stocks, Commodities
Overview
The RSI VWAP POC indicator is a powerful and innovative oscillator that combines the Relative Strength Index (RSI), Volume-Weighted Average Price (VWAP), and Point of Control (POC) from market profile analysis. Designed to provide traders with clear, high-probability trading signals, this indicator helps you identify key market levels, spot overbought/oversold conditions, and time your entries and exits with precision. Whether you’re a day trader, swing trader, or scalper, this free tool adds significant value to your trading strategy by offering a unique blend of momentum, volume, and market profile insights.
How It Works
This indicator integrates three core components to deliver actionable insights:
RSI (Relative Strength Index): Measures momentum to identify overbought (above 70) and oversold (below 30) conditions, helping you anticipate potential reversals.
VWAP (Volume-Weighted Average Price): Calculates a volume-weighted price benchmark, which is used to compute a more accurate, volume-sensitive RSI. This ensures the indicator reflects true market dynamics.
POC (Point of Control): Derived from market profile analysis, the POC represents the price level with the highest traded volume in a session, acting as a critical support or resistance level.
The indicator plots a smoothed RSI based on VWAP, overlaid with market profile data on a user-defined higher timeframe (default: 4H). The POC is displayed as a red line, with aqua bars indicating the value area where the majority of trading volume occurred. When the RSI crosses the POC, the indicator generates clear buy and sell signals:
Strong Buy (SBU): RSI crosses above the POC in an oversold zone.
Strong Sell (SBD): RSI crosses below the POC in an overbought zone.
Additional features include:
Background colors to highlight bullish (green) or bearish (red) trends.
Shaded zones for overbought (70/60) and oversold (30/40) levels.
Customizable settings to fit your trading style and timeframe.
How This Indicator Adds Value
The RSI VWAP POC indicator offers several key benefits that enhance your trading performance:
High-Probability Signals: By combining RSI, VWAP, and POC, this indicator identifies trades at key market levels where price is likely to react, increasing your win rate.
Improved Timing: Clear buy and sell signals, such as ‘SBU’ and ‘SBD’, help you enter and exit trades at optimal points, maximizing profitability.
Risk Management: Overbought/oversold zones and trend confirmation via background colors help you avoid false signals, protecting your capital.
Versatility: Suitable for all markets (crypto, forex, stocks) and timeframes, making it a valuable tool for traders of all experience levels.
Time Efficiency: The indicator does the heavy lifting by analyzing momentum, volume, and market profile data, allowing you to focus on executing trades.
Real-World Performance Example: On a 1-hour Bitcoin chart with a 4-hour higher timeframe, this indicator identified a strong sell signal on April 6th at 12:00 ($82,000), leading to a 9% drop to $74,600. A subsequent strong buy signal on April 7th at 04:00 ($76,200) captured a 6% rise to $81,200 – a potential 25% profit with 5x leverage if exited at 5%.
How to Use
Add the Indicator: Search for “RSI VWAP POC ” in TradingView’s indicator library and add it to your chart.
Set Your Timeframe: The indicator works on any timeframe but is optimized for a 1-hour chart with a 4-hour higher timeframe (set in the settings).
Interpret Signals:
Look for ‘SBU’ (strong buy) labels when the RSI crosses above the POC in an oversold zone, indicating a potential buying opportunity.
Look for ‘SBD’ (strong sell) labels when the RSI crosses below the POC in an overbought zone, signaling a potential selling opportunity.
Use the background colors (green for bullish, red for bearish) to confirm the trend.
Combine with Your Strategy: Use the indicator alongside your existing analysis (e.g., support/resistance, candlestick patterns) for best results.
Settings and Customization
The indicator is highly customizable to suit your trading needs:
RSI Length (Default: 14): Adjust the sensitivity of the RSI. Use a shorter length (e.g., 10) for scalping, or a longer length (e.g., 20) for smoother signals.
EMA Smoothing Length (Default: 3): Smooths the RSI line. Increase to 5 or 7 for less choppy signals in volatile markets.
Higher Timeframe (Default: 240 minutes): Set to 240 (4 hours) for a 1-hour chart. Adjust based on your chart’s timeframe (e.g., 60 minutes for a 15-minute chart).
Value Area Percentage (Default: 100%): Defines the size of the value area around the POC. Lower to 70% for a tighter focus on key levels.
Overbought/Oversold Thresholds (Defaults: 70/30): Adjust these levels to match market conditions (e.g., 80/20 for trending markets).
Show POC Line (Default: True): Toggle the red POC line on or off.
Show Buy/Sell Signals: Enable ‘Show Strong Breakup Signals’ and ‘Show Strong Breakdown Signals’ to focus on high-probability trades.
Why Choose This Indicator?
The RSI VWAP POC indicator stands out by offering a unique combination of momentum, volume, and market profile analysis in a single, easy-to-use tool. It’s designed to help traders of all levels make informed decisions, reduce risk, and increase profitability. Whether you’re trading Bitcoin, forex pairs, or stocks, this indicator provides the clarity and precision you need to succeed.

RSI + MA + Divergence + SnR + Price levelOverview
This indicator combines several technical analysis tools to give traders a comprehensive view based on the RSI indicator. Its main features include:
RSI & Moving Averages on RSI:
RSI: Calculates the RSI based on the closing price (or a user-selected source) with a configurable period (default is 14).
EMA and WMA: Computes and plots an Exponential Moving Average (EMA with a period of 9) and a Weighted Moving Average (WMA with a period of 45) on the RSI, helping to smooth out signals and better identify trends.
Price Ladder Based on RSI:
Draws horizontal lines at specified target RSI levels (from targetRSI1 to targetRSI7, default levels ranging from 20 to 80).
Calculates a target price based on the price change relative to the averaged gains and losses, providing an estimated price level when the RSI reaches those critical levels.
Divergence Detection:
Identifies divergence between price and RSI:
Bullish Divergence: Detected when the price forms a lower low but RSI fails to confirm with a corresponding lower low, with the RSI falling under a configurable threshold (d_below).
Bearish Divergence: Detected when the price forms a higher high while the RSI does not, with the RSI exceeding a configurable upper threshold (d_upper).
Optionally displays labels on the chart to alert the trader when divergence signals are detected.
Auto Support & Resistance on RSI:
Automatically calculates and plots support and resistance lines based on the RSI over different lookback periods (e.g., 34, 89, 200 bars).
Helps traders identify key RSI levels where price reversals or breakouts might occur.
Benefits for the Trader
This indicator is designed to assist traders in their decision-making process by integrating multiple technical analysis elements:
Identifying Market Trends:
By combining the RSI with its moving averages (EMA, WMA), traders can better assess market trends and the strength of these trends, thereby improving trade entry accuracy.
Early Reversal Signals via Divergence:
Divergence signals (both bullish and bearish) can help forecast potential reversals in the market, allowing traders to adjust their strategies timely.
Determining RSI-Based Support/Resistance Levels:
Automatic identification of support and resistance levels on the RSI provides key areas where a price reversal or breakout may occur, assisting traders in setting stop-loss and take-profit levels strategically.
Price Target Forecasting with the Price Ladder:
The target price labels calculated at important RSI levels provide insights into potential price objectives, aiding in risk management and profit planning.
Flexible Configuration:
Traders can customize key parameters such as the RSI period, lengths for EMA and WMA, target RSI levels, divergence conditions, and support/resistance settings. This flexibility allows the indicator to adapt to different trading styles and strategies.
How to read data
Some use-cases
Used to estimate price according to the RSI level.
When you trade using RSI, you want to set your stop-loss or take-profit levels based on RSI. By looking at the price ladder, you know the corresponding price level to enter a trade.
Used to determine the entry zone.
RSI often reacts to its own previously established support/resistance levels. Use the Auto SnR feature to identify those zones.
Used to determine the trend.
RSI and its moving averages help identify the price trend:
Uptrend: 3 lines separate and point upward.
Downtrend: 3 lines separate and point downward.
Use WMA45 to determine the trend:
Uptrend: WMA45 is moving upward or trading above the 50 level.
Downtrend: WMA45 is moving downward or trading below the 50 level.
Sideways: WMA45 is trading around the 50 level.
Use EMA9 to confirm the trend: A crossover of EMA9 through WMA45 confirms the formation of a new trend.
Configuration
The script allows users to configure a number of important parameters to suit their analytical preferences:
RSI Settings:
RSI Length (rsiLengthInput): The number of periods used to compute the RSI (default is 14, adjustable as needed).
RSI Source (rsiSourceInput): Select the price source (default is the closing price).
RSI Color (rsiClr): The color used to display the RSI line.
Moving Averages on RSI:
EMA Length (emaLength): The period for calculating the EMA on RSI (default is 9).
WMA Length (wmaLength): The period for calculating the WMA on RSI (default is 45).
EMA Color (emaClr) and WMA Color (wmaClr): Customize the colors of the EMA and WMA lines.
Price Ladder Settings:
Toggle Price Ladder (showPrice): Enable or disable the display of the price ladder.
Target RSI Levels: targetRSI1 through targetRSI7: RSI values at which target prices are calculated (default values range from 20, 30, 40, 50, 60, 70 to 80).
Price Label Color (priceColor): The text color for displaying the target price labels.
Divergence Settings:
Divergence Toggle (calculateDivergence): Option to enable or disable divergence calculation and display.
Divergence Conditions:
d_below: RSI level below which bullish divergence is considered.
d_upper: RSI level above which bearish divergence is considered.
Display Divergence Labels (showDivergenceLabel): Option to display labels on the chart when divergence is detected.
Auto Support & Resistance on RSI:
Toggle Auto S&R (enableAutoSnR): Enable or disable automatic plotting of support and resistance levels.
Lookback Periods for Support/Resistance:
L1_lookback: Lookback period for level 1 (e.g., 34 bars).
L2_lookback: Lookback period for level 2 (e.g., 89 bars).
L3_lookback: Lookback period for level 3 (e.g., 200 bars).
Support and Resistance Colors:
rsiSupportClr: Color for the support line.
rsiResistanceClr: Color for the resistance line.
Alerts:
Divergence Alerts: Alert conditions are set up to notify the trader when bullish or bearish divergence is detected, aiding in timely decision-making.

Pino Trend Pack (SMA/EMA + Bollinger)🔹 Pino Trend Pack is a compact trend-following and volatility indicator that includes:
📈 Moving Averages:
- SMA 10, SMA 30
- EMA 21, EMA 55, EMA 89
(All configured for short-term to mid-term trend analysis by default, but fully adjustable for user preference.)
📊 Bollinger Bands:
- Period: 20
- Standard Deviation: 2.0
- Includes Upper Band, Lower Band, and Basis (SMA 20)
This pack is designed for traders who want a clean visual of price dynamics across multiple short-term trend layers, combined with volatility tracking. It helps you identify compression, expansion, and trend shifts at a glance.
🧠 Ideal for swing trading, short- to mid-term setups, or as a supporting tool in any confluence-based strategy.

Unusual Whale - Unusual Options Volume Data ScreenerHow to Use:
Custom Expiration Date: Use the calendar/date picker to select the expiration date. The chosen date is automatically converted to the "YYMMDD" format.
Custom Base Strike: Enter a round strike value from the options chain (for example, "270"). This value serves as the starting point (at-the-money) for the scan.
Strike Increment: Select the increment (e.g., 0.50, 1.00, 2.5, 5, or 10) to determine how the scan moves outward from the custom base strike.
Options per Side (Max 20): Choose the number of valid option strikes to scan on each side. The script scans downward (for calls) and upward (for puts) from the custom base strike.
Base Symbol: The base symbol is always taken from the chart (using syminfo.ticker); no manual entry is needed.
Scanning & Aggregation: The script automatically constructs option symbols using the base symbol, custom expiration date, option type (C or P), and the formatted strike. It retrieves volume data for these options and aggregates the cumulative volume for calls and puts separately.
Plotting: Cumulative call volume is plotted in green, and cumulative put volume is plotted in red—only if the required number of valid options is found.
Benefits of Scanning Options Volume for Unusual Activity:
Offers a comprehensive view of volume across multiple strikes, making unusual or extreme volume patterns easier to detect.
Helps gauge market sentiment by comparing aggregated call and put volumes, which may signal shifts in investor behavior.
Aggregating volume from several strike levels provides smoother, more reliable data than using a single strike, enhancing your analytical insights.
What to Do If Combinations Don't Yield Results:
Verify Your Inputs: Ensure that the Custom Base Symbol, Expiration Date, and Custom Base Strike are entered correctly and correspond to an active options chain.
Adjust Strike Increment: If the options aren’t loading as expected, try selecting a different strike increment that more closely matches the spacing in your options chain.
Reduce Options per Side: Lower the number of Options per Side (e.g., from 20 to a lower value) if the scan fails to find enough valid strikes.
Review Your Options Chain: Confirm that the contracts for the specified expiration and strike range exist and are available in your data feed.
Check Data Subscription: Make sure your TradingView plan includes access to the options data required for the selected symbols.
Cumulative Call Volume is Green, Put Volume is Red
Dynamic Volume Profile PoC SwiftedgeOverview
The Dynamic Volume Profile PoC is a powerful and visually intuitive indicator designed to help traders identify key support and resistance levels using a unique combination of pivot points, volume analysis, and dynamic Point of Control (PoC) levels. This script overlays directly on your chart, providing clear visual cues for potential breakout and rejection zones, making it easier to spot high-probability trading opportunities.
What It Does
This indicator combines three core components to deliver actionable insights:
Pivot Points: Identifies significant swing highs and lows to establish potential support and resistance levels.
Volume Oscillator: Measures volume momentum to confirm the strength of price movements, ensuring that breakouts or rejections are backed by significant volume.
Dynamic Point of Control (PoC): Calculates the midpoint between consecutive pivot points to create dynamic PoC levels, which act as key areas where price is likely to either break through (breakout) or reverse (rejection).
These components work together to highlight critical price levels where the market is likely to react, giving traders a clear framework for decision-making.
How It Works
Pivot Detection: The script uses pivot highs and lows (based on user-defined Left Bars and Right Bars) to identify significant price levels. These pivots form the foundation for calculating PoC levels.
PoC Calculation: Each time a new pivot is detected, the script calculates the midpoint between the current pivot and the previous pivot, creating a dynamic PoC level. These levels are plotted as horizontal lines on the chart, with a maximum of Max PoC Lines to Show (default: 2) visible at any time.
Volume Confirmation: A volume oscillator (short EMA of volume minus long EMA of volume) is used to filter breakouts and rejections. Breakouts or rejections are only signaled if the volume oscillator exceeds the Volume Threshold (default: 20), ensuring that price movements are supported by strong volume.
Visual Cues:
PoC levels are drawn as cyan lines with optional semi-transparent zones (controlled by Show PoC Zones). These zones are colored green for potential breakouts (price above PoC) and red for potential rejections (price below PoC).
Labels above and below each PoC level indicate trading opportunities: "Long if breakout"/"Long if rejected" (green) and "Short if breakout"/"Short if rejected" (red), depending on the price's direction relative to the PoC.
Break signals ("B") are plotted above or below bars when price crosses a pivot level with sufficient volume, colored red for downward breaks and green for upward breaks.
How to Use
Add the Indicator: Add the "Dynamic Volume Profile PoC " to your chart in TradingView.
Adjust Settings:
Left Bars and Right Bars (default: 15): Control the sensitivity of pivot detection. Lower values make the script more sensitive to smaller price swings.
Volume Threshold (default: 20): Set the minimum volume oscillator value required to confirm breakouts or rejections. Increase this for stricter confirmation.
Max PoC Lines to Show (default: 2): Define how many PoC levels are displayed at once.
Show PoC Zones (default: true): Toggle semi-transparent zones around PoC levels for better visualization.
Label Spacing Factor (default: 0.5): Adjust the vertical spacing between labels and the PoC box. Increase this value (e.g., to 1.0 or 2.0) for more spacing, or decrease it (e.g., to 0.3) for less.
Interpret the Signals:
Look for PoC levels (cyan lines) as key areas of interest.
Use the labels to identify potential trades: "Long if breakout" indicates a buy opportunity if price breaks above the PoC, while "Short if rejected" suggests a sell if price fails to break through.
Watch for "B" signals to confirm breakouts or rejections with volume support.
Combine with Your Strategy: Use the PoC levels and break signals as part of your broader trading strategy, such as trend-following or mean-reversion setups.
Why This Script is Unique
The Dynamic Volume Profile PoC stands out by combining pivot points, volume analysis, and dynamic PoC levels into a single, cohesive tool. Unlike traditional volume profile indicators that require a fixed range, this script dynamically updates PoC levels based on recent price action, making it more responsive to current market conditions. The addition of volume confirmation ensures that signals are backed by market participation, reducing false breakouts. The visually appealing design, with customizable spacing and semi-transparent zones, makes it easy to interpret key levels at a glance, even for traders unfamiliar with Pine Script.
Notes
This script works best on timeframes where pivot points are meaningful (e.g., 1H, 4H, or daily charts).
Adjust the Label Spacing Factor to ensure labels are well-spaced for your chart's zoom level and instrument.
For instruments with high volatility, you may need to increase the Volume Threshold to filter out noise.

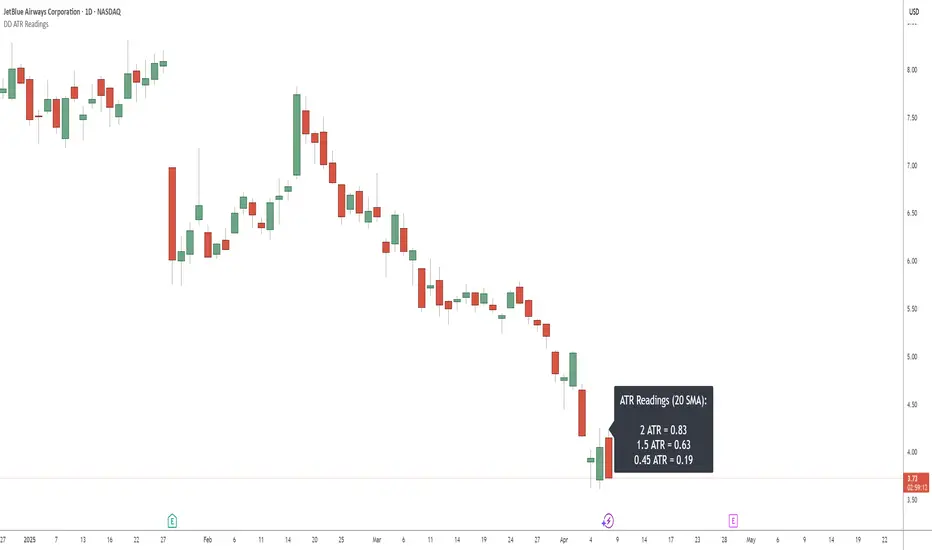
DD ATR ReadingsThe DD ATR Readings indicator displays customizable Average True Range (ATR) multiplier values directly on your chart. Unlike standard ATR indicators that only show a line, this indicator calculates and displays the exact numeric values for three different ATR multipliers, giving you precise volatility measurements for your trading decisions.
It's specifically created for people taking the "Deep Dip Buy" stock trading course, and attempts to provide a ready-to-go solution to allow easy position size calculations as per the course, with the required ATR values visible at a glance.
The default values of 2.0, 1.5 and 0.45 are the same values used by the course instructor in his charting software, but you can change these values to any multiplier you choose.
Any input from students or the instructor is welcome to improve this indicator so it offers more value to those looking to learn how to trade.
Features
Displays three customizable ATR multiplier values (default: 2.0, 1.5, and 0.45 from the course)
Uses either SMA or EMA for ATR calculation (20-period default)
Fully customizable label appearance (position, color, size)
Real-time value updates as you move through the chart
Clean, unobtrusive display that doesn't clutter your chart with additional lines
Customization Options
ATR Length: Number of bars used in the ATR calculation (default: 20)
ATR Multipliers: Three customizable multiplier values
SMA/EMA: Choose your preferred moving average type for ATR calculation
Label Style: Multiple positioning options for the text display
Colors and Size: Fully customizable appearance
RSI + ADX + ATR Combo Indicator: RSI + ADX + ATR Combo Filter
This indicator is a confluence filter tool that combines RSI, ADX, and ATR into a single, easy-to-read chart overlay. It is designed to help traders identify low-volatility, non-trending zones with balanced momentum—ideal for strategies that rely on breakouts or reversals.
🔍 Core Components:
RSI (Relative Strength Index)
Standard RSI with custom upper and lower bounds (default: 60 and 40).
Filters out extreme overbought/oversold regions and focuses on price consolidation zones.
ADX (Average Directional Index)
Measures trend strength.
When ADX is below a custom threshold (default: 20), it indicates a weak or range-bound trend.
ATR (Average True Range)
Represents volatility.
Low ATR values (default threshold: 2.5) are used to filter out high-volatility environments, helping refine entries.
🟣 Signal Logic:
A signal is highlighted with a background color when all three conditions are met:
RSI is between lower and upper bounds (e.g., 40 < RSI < 60) ✅
ADX is below the trend threshold (e.g., ADX < 20) ✅
ATR is below the volatility threshold (e.g., ATR < 2.5) ✅
These combined conditions suggest a low-volatility, low-trend strength, and balanced momentum zone—perfect for anticipating breakouts or strong directional moves.
