Modern Economic Eras DashboardOverview
This script provides a historical macroeconomic visualization of U.S. markets, highlighting long-term structural "eras" such as the Bretton Woods period, the inflationary 1970s, and the post-2020 "Age of Disorder." It overlays key economic indicators sourced from FRED (Federal Reserve Economic Data) and displays notable market crashes, all in a clean and rescaled format for easy comparison.
Data Sources & Indicators
All data is loaded monthly from official FRED series and rescaled to improve readability:
🔵 Real GDP (FRED:GDP): Total output of the U.S. economy.
🔴 Inflation Index (FRED:CPIAUCSL): Consumer price index as a proxy for inflation.
⚪ Debt to GDP (FRED:GFDGDPA188S): Federal debt as % of GDP.
🟣 Labor Force Participation (FRED:CIVPART): % of population in the labor force.
🟠 Oil Prices (FRED:DCOILWTICO): Monthly WTI crude oil prices.
🟡 10Y Real Yield (FRED:DFII10): Inflation-adjusted yield on 10-year Treasuries.
🔵 Symbol Price: Optionally overlays the charted asset’s price, rescaled.
Historical Crashes
The dashboard highlights 10 major U.S. market crashes, including 1929, 2000, and 2008, with labeled time spans for quick context.
Era Classification
Six macroeconomic eras based on Deutsche Bank’s Long-Term Asset Return Study (2020) are shaded with background color. Each era reflects dominant economic regimes—globalization, wars, monetary systems, inflationary cycles, and current geopolitical disorder.
Best Use Cases
✅ Long-term macro investors studying structural market behavior
✅ Educators and analysts explaining economic transitions
✅ Portfolio managers aligning strategy with macroeconomic phases
✅ Traders using history for cycle timing and risk assessment
Technical Notes
Designed for monthly timeframe, though it works on weekly.
Uses close price and standard request.security calls for consistency.
Max labels/lines configured for broader history (from 1860s to present).
All plotted series are rescaled manually for better visibility.
Originality
This indicator is original and not derived from built-in or boilerplate code. It combines multiple economic dimensions and market history into one interactive chart, helping users frame today's markets in a broader structural context.
Cari dalam skrip untuk "2020年+国债收益率"

Capitulation Volume Detector by @RhinoTradezOverview
Hey traders, want to catch the market when it’s totally losing it? The Capitulation Volume Detector is your go-to buddy for spotting those wild moments when panic selling takes over. Picture this: prices plummet, volume explodes, and everyone’s bailing out—that’s capitulation, and it might just signal a turning point. This script throws a bright marker on your chart whenever the chaos hits, so you can decide if it’s time to jump in or sit tight. Built fresh in Pine Script v6, it’s sleek, customizable, and packs an alert to keep you posted—perfect for stocks, indices like SPY, or even crypto chaos.
Inspired by epic sell-offs like March 2020’s COVID crash, this tool’s here to help you navigate the storm with a smile (and maybe a profit).
What It Does
Capitulation volume is that “everyone’s out!” moment: a steep price drop meets a massive volume surge, hinting that sellers are tapped out. It’s not a guaranteed reversal—sometimes the bleeding continues—but it’s a loud clue that fear’s peaked. Here’s the magic:
Volume Check : Measures current volume against a customizable average (default: 20 bars).
Price Plunge : Tracks the percentage drop from the last close.
Capitulation Cal l: When volume rockets past your threshold (e.g., 2x average) and price tanks (e.g., -5%), you get a red triangle above the bar.
Stay Alert : Fires off a detailed message (e.g., “Volume 300M > 200M, Drop -10%”) so you’re never caught off guard.
Think of it as your market meltdown radar—simple, effective, and ready to roll.
Functionality Breakdown
Volume Surge Spotter :
Uses a 20-bar Simple Moving Average (SMA) of volume as your baseline.
Flags any bar where volume exceeds this average by your chosen multiplier (default: 2x).
Price Drop Detector :
Calculates the percentage change from the prior close.
Triggers when the drop’s bigger than your set limit (default: -5%).
Capitulation Marker:
Combines both signals: high volume + sharp drop = capitulation.
Slaps a red triangle above the bar for instant “whoa, there it is!” vibes.
Real-Time Alerts :
Sends a custom alert with volume and drop details, keeping you in the loop without babysitting the chart.
Customization Options
Tune it to your trading style with these easy settings:
Volume Multiplier (x Avg): Starts at 2.0 (2x average volume). Bump it to 3.0 for only the wildest spikes or dial it to 1.5 for more frequent catches. Range: 1.0-10.0, step 0.1.
Price Drop Threshold (%): Default 5.0 (a -5% drop). Go big with 10.0 for crash-level falls or ease to 3.0 for lighter dips. Range: 1.0-20.0, step 0.1.
Average Volume Period: Default 20 bars. Stretch it to 50 for a broader view or shrink to 10 for quick reactions. Range: 1-100.
Capitulation Marker Color: Red by default—because panic’s loud! Switch it to blue, green, or pink to match your chart’s personality.
How to Use It
Drop It On : Add it to any chart with volume data—SPY daily for market moves, /ES 15-minute for intraday action, or your go-to stock.
Play with Settings : Hit the indicator’s config gear and tweak the multiplier, drop threshold, period, or marker color to fit your vibe.
Set an Alert : Right-click the indicator, add an alert with “Any alert() function call,” and get pinged when capitulation strikes.
Watch the Action : Look for those red triangles on big drop days—pair with your favorite reversal signals for extra oomph.
Pro Tips
Daily Charts : Catch market-wide capitulations like March 23, 2020 (SPY: -10%, 3x volume).
Intraday : Spot flash crashes or sector sell-offs on 15-minute or 5-minute bars.
Context Matters : High volume alone isn’t enough—check the VIX or candlestick patterns (e.g., hammers) to confirm a bottom.

Economic Crises by @zeusbottradingEconomic Crises Indicator by @zeusbottrading
Description and Use Case
Overview
The Economic Crises Highlight Indicator is designed to visually mark major economic crises on a TradingView chart by shading these periods in red. It provides a historical context for financial analysis by indicating when major recessions occurred, helping traders and analysts assess the performance of assets before, during, and after these crises.
What This Indicator Shows
This indicator highlights the following major economic crises (from 1953 to 2020), which significantly impacted global markets:
• 1953 Korean War Recession
• 1957 Monetary Tightening Recession
• 1960 Investment Decline Recession
• 1969 Employment Crisis
• 1973 Oil Crisis
• 1980 Inflation Crisis
• 1981 Fed Monetary Policy Recession
• 1990 Oil Crisis and Gulf War Recession
• 2001 Dot-Com Bubble Crash
• 2008 Global Financial Crisis (Great Recession)
• 2020 COVID-19 Recession
Each of these periods is shaded in red with 80% transparency, allowing you to clearly see the impact of economic downturns on various financial assets.
How This Indicator is Useful
This indicator is particularly valuable for:
✅ Comparative Performance Analysis – It allows traders and investors to compare how different assets (e.g., Gold, Silver, S&P 500, Bitcoin) performed before, during, and after major economic crises.
✅ Identifying Market Trends – Helps recognize recurring patterns in asset price movements during times of financial distress.
✅ Risk Management & Strategy Development – Understanding how markets reacted in the past can assist in making better-informed investment decisions for future downturns.
✅ Gold, Silver & Bitcoin as Safe Havens – Comparing precious metals and cryptocurrencies against traditional stocks (e.g., SPY) to analyze their performance as hedges during economic turmoil.
How to Use It in Your Analysis
By overlaying this indicator on your Gold, Silver, SPY, and Bitcoin chart (for example), you can quickly spot historical market reactions and use that insight to predict possible behaviors in future downturns.
⸻
How to Apply This in TradingView?
1. Click on Use on chart under the image.
2. Overlay it with Gold ( OANDA:XAUUSD ), Silver ( OANDA:XAGUSD ), SPY ( AMEX:SPY ), and Bitcoin ( COINBASE:BTCUSD ) for comparative analysis.
⸻
Conclusion
This indicator serves as a powerful historical reference for traders analyzing asset performance during economic downturns. By studying past crises, you can develop a data-driven investment strategy and improve your market insights. 🚀📈
Let me know if you need any modifications or enhancements!

Classic Nacked Z-Score ArbitrageThe “Classic Naked Z-Score Arbitrage” strategy employs a statistical arbitrage model based on the Z-score of the price spread between two assets. This strategy follows the premise of pair trading, where two correlated assets, typically from the same market sector, are traded against each other to profit from relative price movements (Gatev, Goetzmann, & Rouwenhorst, 2006). The approach involves calculating the Z-score of the price spread between two assets to determine market inefficiencies and capitalize on short-term mispricing.
Methodology
Price Spread Calculation:
The strategy calculates the spread between the two selected assets (Asset A and Asset B), typically from different sectors or asset classes, on a daily timeframe.
Statistical Basis – Z-Score:
The Z-score is used as a measure of how far the current price spread deviates from its historical mean, using the standard deviation for normalization.
Trading Logic:
• Long Position:
A long position is initiated when the Z-score exceeds the predefined threshold (e.g., 2.0), indicating that Asset A is undervalued relative to Asset B. This signals an arbitrage opportunity where the trader buys Asset B and sells Asset A.
• Short Position:
A short position is entered when the Z-score falls below the negative threshold, indicating that Asset A is overvalued relative to Asset B. The strategy involves selling Asset B and buying Asset A.
Theoretical Foundation
This strategy is rooted in mean reversion theory, which posits that asset prices tend to return to their long-term average after temporary deviations. This form of arbitrage is widely used in statistical arbitrage and pair trading techniques, where investors seek to exploit short-term price inefficiencies between two assets that historically maintain a stable price relationship (Avery & Sibley, 2020).
Further, the Z-score is an effective tool for identifying significant deviations from the mean, which can be seen as a signal for the potential reversion of the price spread (Braucher, 2015). By capturing these inefficiencies, traders aim to profit from convergence or divergence between correlated assets.
Practical Application
The strategy aligns with the Financial Algorithmic Trading and Market Liquidity analysis, emphasizing the importance of statistical models and efficient execution (Harris, 2024). By utilizing a simple yet effective risk-reward mechanism based on the Z-score, the strategy contributes to the growing body of research on market liquidity, asset correlation, and algorithmic trading.
The integration of transaction costs and slippage ensures that the strategy accounts for practical trading limitations, helping to refine execution in real market conditions. These factors are vital in modern quantitative finance, where liquidity and execution risk can erode profits (Harris, 2024).
References
• Gatev, E., Goetzmann, W. N., & Rouwenhorst, K. G. (2006). Pairs Trading: Performance of a Relative-Value Arbitrage Rule. The Review of Financial Studies, 19(3), 1317-1343.
• Avery, C., & Sibley, D. (2020). Statistical Arbitrage: The Evolution and Practices of Quantitative Trading. Journal of Quantitative Finance, 18(5), 501-523.
• Braucher, J. (2015). Understanding the Z-Score in Trading. Journal of Financial Markets, 12(4), 225-239.
• Harris, L. (2024). Financial Algorithmic Trading and Market Liquidity: A Comprehensive Analysis. Journal of Financial Engineering, 7(1), 18-34.

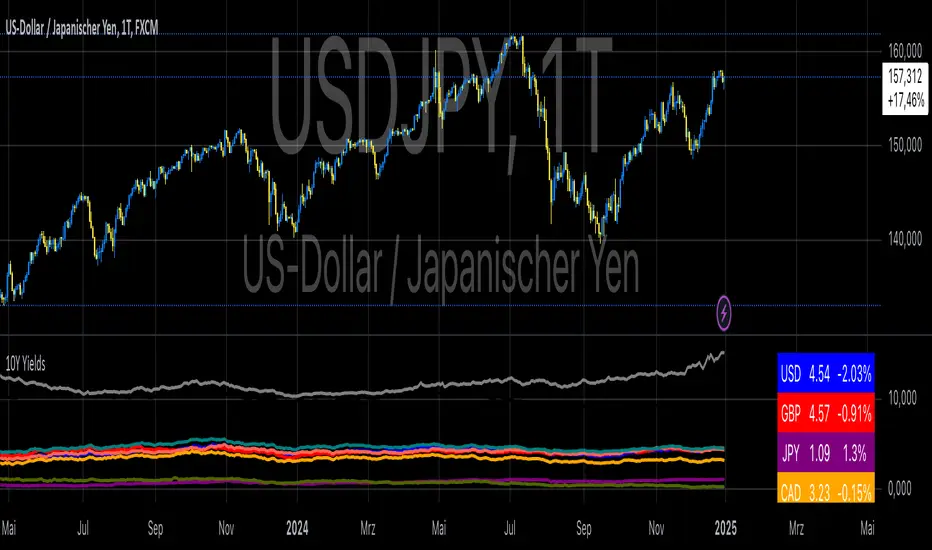
10-Year Yields Table for Major CurrenciesThe "10-Year Yields Table for Major Currencies" indicator provides a visual representation of the 10-year government bond yields for several major global economies, alongside their corresponding Rate of Change (ROC) values. This indicator is designed to help traders and analysts monitor the yields of key currencies—such as the US Dollar (USD), British Pound (GBP), Japanese Yen (JPY), and others—on a daily timeframe. The 10-year yield is a crucial economic indicator, often used to gauge investor sentiment, inflation expectations, and the overall health of a country's economy (Higgins, 2021).
Key Components:
10-Year Government Bond Yields: The indicator displays the daily closing values of 10-year government bond yields for major economies. These yields represent the return on investment for holding government bonds with a 10-year maturity and are often considered a benchmark for long-term interest rates. A rise in bond yields generally indicates that investors expect higher inflation and/or interest rates, while falling yields may signal deflationary pressures or lower expectations for future economic growth (Aizenman & Marion, 2020).
Rate of Change (ROC): The ROC for each bond yield is calculated using the formula:
ROC=Current Yield−Previous YieldPrevious Yield×100
ROC=Previous YieldCurrent Yield−Previous Yield×100
This percentage change over a one-day period helps to identify the momentum or trend of the bond yields. A positive ROC indicates an increase in yields, often linked to expectations of stronger economic performance or rising inflation, while a negative ROC suggests a decrease in yields, which could signal concerns about economic slowdown or deflation (Valls et al., 2019).
Table Format: The indicator presents the 10-year yields and their corresponding ROC values in a table format for easy comparison. The table is color-coded to differentiate between countries, enhancing readability. This structure is designed to provide a quick snapshot of global yield trends, aiding decision-making in currency and bond market strategies.
Plotting Yield Trends: In addition to the table, the indicator plots the 10-year yields as lines on the chart, allowing for immediate visual reference of yield movements across different currencies. The plotted lines provide a dynamic view of the yield curve, which is a vital tool for economic analysis and forecasting (Campbell et al., 2017).
Applications:
This indicator is particularly useful for currency traders, bond investors, and economic analysts who need to monitor the relationship between bond yields and currency strength. The 10-year yield can be a leading indicator of economic health and interest rate expectations, which often impact currency valuations. For instance, higher yields in the US tend to attract foreign investment, strengthening the USD, while declining yields in the Eurozone might signal economic weakness, leading to a depreciating Euro.
Conclusion:
The "10-Year Yields Table for Major Currencies" indicator combines essential economic data—10-year government bond yields and their rate of change—into a single, accessible tool. By tracking these yields, traders can better understand global economic trends, anticipate currency movements, and refine their trading strategies.
References:
Aizenman, J., & Marion, N. (2020). The High-Frequency Data of Global Bond Markets: An Analysis of Bond Yields. Journal of International Economics, 115, 26-45.
Campbell, J. Y., Lo, A. W., & MacKinlay, A. C. (2017). The Econometrics of Financial Markets. Princeton University Press.
Higgins, M. (2021). Macroeconomic Analysis: Bond Markets and Inflation. Harvard Business Review, 99(5), 45-60.
Valls, A., Ferreira, M., & Lopes, M. (2019). Understanding Yield Curves and Economic Indicators. Financial Markets Review, 32(4), 72-91.
Quadruple WitchingThis Pine Script code defines an indicator named "Display Quadruple Witching" that highlights the chart background in green on specific days known as "Quadruple Witching." Quadruple Witching refers to the third Friday of March, June, September, and December when four types of financial contracts—stock index futures, stock index options, stock options, and single stock futures—expire simultaneously. This phenomenon often leads to increased market volatility and trading volume.
The indicator calculates the date of the third Friday of each quarter and highlights the chart background on these dates. This feature helps traders anticipate potential market impacts associated with Quadruple Witching.
Importance of Quadruple Witching
Quadruple Witching is significant in financial markets for several reasons:
Increased Market Activity: On these dates, the market often experiences a surge in trading volume as traders and institutions adjust their positions in response to the expiration of multiple derivative contracts (CFA Institute, 2020).
Price Movements: The simultaneous expiration of various contracts can lead to substantial price fluctuations and increased market volatility. These movements can be unpredictable and present both risks and opportunities for traders (Bodnaruk, 2019).
Market Impact: The adjustments made by institutional investors and traders due to the expirations can have a pronounced impact on stock prices and market indices. This effect is particularly noticeable in the days surrounding Quadruple Witching (Campbell, 2021).
References
CFA Institute. (2020). The Impact of Quadruple Witching on Financial Markets. CFA Institute Research Foundation. Retrieved from CFA Institute.
Bodnaruk, A. (2019). The Effect of Option Expiration on Stock Prices. Journal of Financial Economics, 131(1), 45-64. doi:10.1016/j.jfineco.2018.08.004
Campbell, J. Y. (2021). The Behaviour of Stock Prices Around Expiration Dates. Journal of Financial Economics, 141(2), 577-600. doi:10.1016/j.jfineco.2021.01.001
These references provide a deeper understanding of how Quadruple Witching influences market dynamics and why being aware of these dates can be crucial for trading strategies.

Correlation Coefficient - DXY & XAUPublishing my first indicator on TradingView. Essentially a modification of the Correlation Coefficient indicator, that displays a 2 ticker symbols' correlation coefficient vs, the chart presently loaded.. You can modify the symbols, but the default uses DXY and XAU, which have been displaying strong negative correlation.
As with the built-in CC (Correlation Coefficient) indicator, readings are taken the same way:
Positive Correlation = anything above 0 | stronger as it moves up towards 1 | weaker as it moves back down towards 0
Negative Correlation = anything below 0 | stronger moving down towards -1 | weaker moving back up towards 0
This is primarily created to work with the Bitcoin weekly chart, for comparing DXY and Gold (XAU) price correlations (in advance, when possible). If you change the chart timeframe to something other than weekly, consider playing with the Length input, which is set to 35 by default where I think it best represents correlations with Bitcoin's weekly timeframe for DXY and Gold.
The intention is that you might be able to determine future direction of Bitcoin based on positive or negative correlations of Gold and/or the US Dollar Index. DXY has been making peaks and valleys prior to Bitcoin since after March 2020 black swan event, where it peaked just after instead. In the future, it may flip over again and Bitcoin may hit major highs or lows prior to DXY, again. So, keep an eye on the charts for all 3, as well as the indicator correlations.
Currently, we've moved back into negative correlation between Bitcoin and DXY, and positive correlation with Bitcoin and Gold:
Negative Correlation b/w Bitcoin and DXY - if DXY moves up, Bitcoin likely moves down, or if DXY moves down, Bitcoin likely moves up (or if Bitcoin were to move first before DXY, as it did on March 2020, instead)
Positive Correlation b/w Bitcoin and Gold - Bitcoin and Gold will likely move up or down with each other.
DXY is represented by the green histogram and label, Gold is represented by the yellow histogram and label. Again, you can modify the tickers you want to check against, and you can modify the colors for their histograms / labels.
The inspiration from came from noticing areas of same date or delayed negative correlation between Bitcoin and DXY, here is one of my most recent posts about that:
Please let me know if you have any questions, or would like to see updates to the indicator to make it easier to use or add more useful features to it.
I hope this becomes useful to you in some way. Thank you for your support!
Cheers,
dudebruhwhoa :)

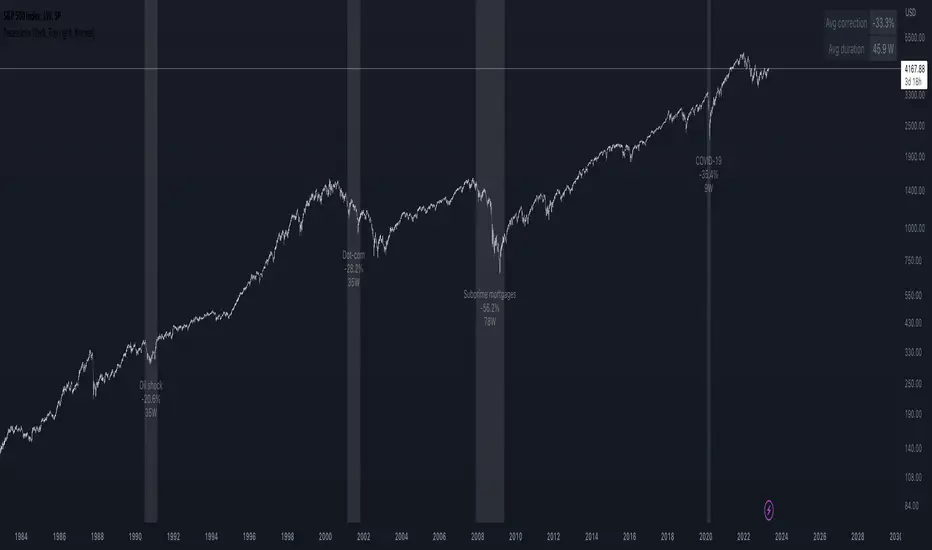
Recessions & crises shading (custom dates & stats)Shades your chart background to flag events such as crises or recessions, in similar fashion to what you see on FRED charts. The advantage of this indicator over others is that you can quickly input custom event dates as text in the menu to analyse their impact for your specific symbol. The script automatically labels, calculates and displays the peak to through percentage corrections on your current chart.
By default the indicator is configured to show the last 6 US recessions. If you have custom events which will benefit others, just paste the input string in the comments below so one can simply copy/paste in their indicator.
Example event input (No spaces allowed except for the label name. Enter dates as YYYY-MM-DD.)
2020-02-01,2020-03-31,COVID-19
2007-12-01,2009-05-31,Subprime mortgages
2001-03-01,2001-10-30,Dot-com bubble
1990-07-01,1991-03-01,Oil shock
1981-07-01,1982-11-01,US unemployment
1980-01-01,1980-07-01,Volker
1973-11-01,1975-03-01,OPEC
Days in rangeThis script is a little widget that I made to do some homework on the VIX.
As you can see in the chart I was analyzing the 2008 market crash and the stats that followed it after until the market started to recover.
You can see that theory in my "Ideas" tab.
This is an interactive set of lines that you can use to count the the bars inside and outside of your chosen range, and the percentage outside that range.
You should initially enter the price range of your product in the menu and set some arbitrary dates that you can easily see on your chart.
Drag and drop the lines around to suit what price and the dates you are analyzing.
The table will display the bar count inside and outside of the range, the total bars, and the percentage outside that range.
I personally used this as a tool to study the overall average of the product, compared with the behavior during major market events.
It is currently my opinion that post 2020 analysis needs to take into account the behavior of any given product prior to 2020 when the
VIX was in its comfort zone. Not to say that a price valuation hasn't been set, but that the movement to that price was outside of "Normal Market Conditions,"
and the time factor to return to that value might be skewed. Other factors would need to be considered at that point pertaining to your specific product or corelating indicator.
I could see this tool being useful to Forex and commodities traders. But that isn't my field so that that for what it is. I do think it would perform best on something that is more
pegged to a price range. I personally would use it on product's, like the VIX, that I use as an indicator product. That is what it was designed for.
But I suppose it could be used for Mean price and time related analysis, maybe with a Vwap, SMA or other breakout style indicators.
Volume analysis might be pretty sporty. Possibly time patterns... the possibilities could be endless. Or... limited.
I am publishing this for my trade group so that it can be tinkered with to find other helpful ways to use it.
If anyone finds something interesting with other indicators, please drop a comment below and I could consider creating a script to integrate with this tool.

Adaptive Candlestick Pattern Recognition System█ INTRODUCTION
Nearly three years in the making, intermittently worked on in the few spare hours of weekends and time off, this is a passion project I undertook to flesh out my skills as a computer programmer. This script currently recognizes 85 different candlestick patterns ranging from one to five candles in length. It also performs statistical analysis on those patterns to determine prior performance and changes the coloration of those patterns based on that performance. In searching TradingView's script library for scripts similar to this one, I had found a handful. However, when I reviewed the ones which were open source, I did not see many that truly captured the power of PineScrypt or leveraged the way it works to create efficient and reliable code; one of the main driving factors for releasing this 5,000+ line behemoth open sourced.
Please take the time to review this description and source code to utilize this script to its fullest potential.
█ CONCEPTS
This script covers the following topics: Candlestick Theory, Trend Direction, Higher Timeframes, Price Analysis, Statistic Analysis, and Code Design.
Candlestick Theory - This script focuses solely on the concept of Candlestick Theory: arrangements of candlesticks may form certain patterns that can potentially influence the future price action of assets which experience those patterns. A full list of patterns (grouped by pattern length) will be in its own section of this description. This script contains two modes of operation for identifying candlestick patterns, 'CLASSIC' and 'BREAKOUT'.
CLASSIC: In this mode, candlestick patterns will be identified whenever they appear. The user has a wide variety of inputs to manipulate that can change how certain patterns are identified and even enable alerts to notify themselves when these patterns appear. Each pattern selected to appear will have their Profit or Loss (P/L) calculated starting from the first candle open succeeding the pattern to a candle close specified some number of candles ahead. These P/L calculations are then collected for each pattern, and split among partitions of prior price action of the asset the script is currently applied to (more on that in Higher Timeframes ).
BREAKOUT: In this mode, P/L calculations are held off until a breakout direction has been confirmed. The user may specify the number of candles ahead of a pattern's appearance (from one to five) that a pattern has to confirm a breakout in either an upward or downward direction. A breakout is constituted when there is a candle following the appearance of the pattern that closes above/at the highest high of the pattern, or below/at its lowest low. Only then will percent return calculations be performed for the pattern that's been identified, and these percent returns are broken up not only by the partition they had appeared in but also by the breakout direction itself. Patterns which do not breakout in either direction will be ignored, along with having their labels deleted.
In both of these modes, patterns may be overridden. Overrides occur when a smaller pattern has been detected and ends up becoming one (or more) of the candles of a larger pattern. A key example of this would be the Bearish Engulfing and the Three Outside Down patterns. A Three Outside Down necessitates a Bearish Engulfing as the first two candles in it, while the third candle closes lower. When a pattern is overridden, the return for that pattern will no longer be tracked. Overrides will not occur if the tail end of a larger pattern occurs at the beginning of a smaller pattern (Ex: a Bullish Engulfing occurs on the third candle of a Three Outside Down and the candle immediately following that pattern, the Three Outside Down pattern will not be overridden).
Important Functionality Note: These patterns are only searched for at the most recently closed candle, not on the currently closing candle, which creates an offset of one for this script's execution. (SEE LIMITATIONS)
Trend Direction - Many of the patterns require a trend direction prior to their appearance. Noting TradingView's own publication of candlestick patterns, I utilize a similar method for determining trend direction. Moving Averages are used to determine which trend is currently taking place for candlestick patterns to be sought out. The user has access to two Moving Averages which they may individually modify the following for each: Moving Average type (list of 9), their length, width, source values, and all variables associated with two special Moving Averages (Least Squares and Arnaud Legoux).
There are 3 settings for these Moving Averages, the first two switch between the two Moving Averages, and the third uses both. When using individual Moving Averages, the user may select a 'price point' to compare against the Moving Average (default is close). This price point is compared to the Moving Average at the candles prior to the appearance of candle patterns. Meaning: The close compared to the Moving Average two candles behind determines the trend direction used for Candlestick Analysis of one candle patterns; three candles behind for two candle patterns and so on. If the selected price point is above the Moving Average, then the current trend is an 'uptrend', 'downtrend' otherwise.
The third setting using both Moving Averages will compare the lengths of each, and trend direction is determined by the shorter Moving Average compared to the longer one. If the shorter Moving Average is above the longer, then the current trend is an 'uptrend', 'downtrend' otherwise. If the lengths of the Moving Averages are the same, or both Moving Averages are Symmetrical, then MA1 will be used by default. (SEE LIMITATIONS)
Higher Timeframes - This script employs the use of Higher Timeframes with a few request.security calls. The purpose of these calls is strictly for the partitioning of an asset's chart, splitting the returns of patterns into three separate groups. The four inputs in control of this partitioning split the chart based on: A given resolution to grab values from, the length of time in that resolution, and 'Upper' and 'Lower Limits' which split the trading range provided by that length of time in that resolution that forms three separate groups. The default values for these four inputs will partition the current chart by the yearly high-low range where: the 'Upper' partition is the top 20% of that trading range, the 'Middle' partition is 80% to 33% of the trading range, and the 'Lower' partition covers the trading range within 33% of the yearly low.
Patterns which are identified by this script will have their returns grouped together based on which partition they had appeared in. For example, a Bullish Engulfing which occurs within a third of the yearly low will have its return placed separately from a Bullish Engulfing that occurred within 20% of the yearly high. The idea is that certain patterns may perform better or worse depending on when they had occurred during an asset's trading range.
Price Analysis - Price Analysis is a major part of this script's functionality as it can fundamentally change how patterns are shown to the user. The settings related to Price Analysis include setting the number of candles ahead of a pattern's appearance to determine the return of that pattern. In 'BREAKOUT' mode, an additional setting allows the user to specify where the P/L calculation will begin for a pattern that had appeared and confirmed. (SEE LIMITATIONS)
The calculation for percent returns of patterns is illustrated with the following pseudo-code (CLASSIC mode, this is a simplified version of the actual code):
type patternObj
int ID
int partition
type returnsArray
float returns
// No pattern found = na returned
patternObj TEST_VAL = f_FindPattern()
priorTestVal = TEST_VAL
if not na( priorTestVal )
pnlMatrixRow = priorTestVal.ID
pnlMatrixCol = priorTestVal.partition
matrixReturn = matrix.get(PERCENT_RETURNS, pnlMatrixRow, pnlMatrixCol)
percentReturn = ( (close - open ) / open ) * 100%
array.push(matrixReturn.returns, percentReturn)
Statistic Analysis - This script uses Pine's built-in array functions to conduct the Statistic Analysis for patterns. When a pattern is found and its P/L calculation is complete, its return is added to a 'Return Array' User-Defined-Type that contains numerous fields which retain information on a pattern's prior performance. The actual UDT is as follows:
type returnArray
float returns = na
int size = 0
float avg = 0
float median = 0
float stdDev = 0
int polarities = na
All values within this UDT will be updated when a return is added to it (some based on user input). The array.avg , array.median and array.stdev will be ran and saved into their respective fields after a return is placed in the 'returns' array. The 'polarities' integer array is what will be changed based on user input. The user specifies two different percentages that declare 'Positive' and 'Negative' returns for patterns. When a pattern returns above, below, or in between these two values, different indices of this array will be incremented to reflect the kind of return that pattern had just experienced.
These values (plus the full name, partition the pattern occurred in, and a 95% confidence interval of expected returns) will be displayed to the user on the tooltip of the labels that identify patterns. Simply scroll over the pattern label to view each of these values.
Code Design - Overall this script is as much of an art piece as it is functional. Its design features numerous depictions of ASCII Art that illustrate what is being attempted by the functions that identify patterns, and an incalculable amount of time was spent rewriting portions of code to improve its efficiency. Admittedly, this final version is nearly 1,000 lines shorter than a previous version (one which took nearly 30 seconds after compilation to run, and didn't do nearly half of what this version does). The use of UDTs, especially the 'patternObj' one crafted and redesigned from the Hikkake Hunter 2.0 I published last month, played a significant role in making this script run efficiently. There is a slight rigidity in some of this code mainly around pattern IDs which are responsible for displaying the abbreviation for patterns (as well as the full names under the tooltips, and the matrix row position for holding returns), as each is hard-coded to correspond to that pattern.
However, one thing I would like to mention is the extensive use of global variables for pattern detection. Many scripts I had looked over for ideas on how to identify candlestick patterns had the same idea; break the pattern into a set of logical 'true/false' statements derived from historically referencing candle OHLC values. Some scripts which identified upwards of 20 to 30 patterns would reference Pine's built-in OHLC values for each pattern individually, potentially requesting information from TradingView's servers numerous times that could easily be saved into a variable for re-use and only requested once per candle (what this script does).
█ FEATURES
This script features a massive amount of switches, options, floating point values, detection settings, and methods for identifying/tailoring pattern appearances. All modifiable inputs for patterns are grouped together based on the number of candles they contain. Other inputs (like those for statistics settings and coloration) are grouped separately and presented in a way I believe makes the most sense.
Not mentioned above is the coloration settings. One of the aims of this script was to make patterns visually signify their behavior to the user when they are identified. Each pattern has its own collection of returns which are analyzed and compared to the inputs of the user. The user may choose the colors for bullish, neutral, and bearish patterns. They may also choose the minimum number of patterns needed to occur before assigning a color to that pattern based on its behavior; a color for patterns that have not met this minimum number of occurrences yet, and a color for patterns that are still processing in BREAKOUT mode.
There are also an additional three settings which alter the color scheme for patterns: Statistic Point-of-Reference, Adaptive coloring, and Hard Limiting. The Statistic Point-of-Reference decides which value (average or median) will be compared against the 'Negative' and 'Positive Return Tolerance'(s) to guide the coloration of the patterns (or for Adaptive Coloring, the generation of a color gradient).
Adaptive Coloring will have this script produce a gradient that patterns will be colored along. The more bullish or bearish a pattern is, the further along the gradient those patterns will be colored starting from the 'Neutral' color (hard lined at the value of 0%: values above this will be colored bullish, bearish otherwise). When Adaptive Coloring is enabled, this script will request the highest and lowest values (these being the Statistic Point-of-Reference) from the matrix containing all returns and rewrite global variables tied to the negative and positive return tolerances. This means that all patterns identified will be compared with each other to determine bullish/bearishness in Adaptive Coloring.
Hard Limiting will prevent these global variables from being rewritten, so patterns whose Statistic Point-of-Reference exceed the return tolerances will be fully colored the bullish or bearish colors instead of a generated gradient color. (SEE LIMITATIONS)
Apart from the Candle Detection Modes (CLASSIC and BREAKOUT), there's an additional two inputs which modify how this script behaves grouped under a "MASTER DETECTION SETTINGS" tab. These two "Pattern Detection Settings" are 'SWITCHBOARD' and 'TARGET MODE'.
SWITCHBOARD: Every single pattern has a switch that is associated with its detection. When a switch is enabled, the code which searches for that pattern will be run. With the Pattern Detection Setting set to this, all patterns that have their switches enabled will be sought out and shown.
TARGET MODE: There is an additional setting which operates on top of 'SWITCHBOARD' that singles out an individual pattern the user specifies through a drop down list. The names of every pattern recognized by this script will be present along with an identifier that shows the number of candles in that pattern (Ex: " (# candles)"). All patterns enabled in the switchboard will still have their returns measured, but only the pattern selected from the "Target Pattern" list will be shown. (SEE LIMITATIONS)
The vast majority of other features are held in the one, two, and three candle pattern sections.
For one-candle patterns, there are:
3 — Settings related to defining 'Tall' candles:
The number of candles to sample for previous candle-size averages.
The type of comparison done for 'Tall' Candles: Settings are 'RANGE' and 'BODY'.
The 'Tolerance' for tall candles, specifying what percent of the 'average' size candles must exceed to be considered 'Tall'.
When 'Tall Candle Setting' is set to RANGE, the high-low ranges are what the current candle range will be compared against to determine if a candle is 'Tall'. Otherwise the candle bodies (absolute value of the close - open) will be compared instead. (SEE LIMITATIONS)
Hammer Tolerance - How large a 'discarded wick' may be before it disqualifies a candle from being a 'Hammer'.
Discarded wicks are compared to the size of the Hammer's candle body and are dependent upon the body's center position. Hammer bodies closer to the high of the candle will have the upper wick used as its 'discarded wick', otherwise the lower wick is used.
9 — Doji Settings, some pulled from an old Doji Hunter I made a while back:
Doji Tolerance - How large the body of a candle may be compared to the range to be considered a 'Doji'.
Ignore N/S Dojis - Turns off Trend Direction for non-special Dojis.
GS/DF Doji Settings - 2 Inputs that enable and specify how large wicks that typically disqualify Dojis from being 'Gravestone' or 'Dragonfly' Dojis may be.
4 Settings related to 'Long Wick Doji' candles detailed below.
A Tolerance for 'Rickshaw Man' Dojis specifying how close the center of the body must be to the range to be valid.
The 4 settings the user may modify for 'Long Legged' Dojis are: A Sample Base for determining the previous average of wicks, a Sample Length specifying how far back to look for these averages, a Behavior Setting to define how 'Long Legged' Dojis are recognized, and a tolerance to specify how large in comparison to the prior wicks a Doji's wicks must be to be considered 'Long Legged'.
The 'Sample Base' list has two settings:
RANGE: The wicks of prior candles are compared to their candle ranges and the 'wick averages' will be what the average percent of ranges were in the sample.
WICKS: The size of the wicks themselves are averaged and returned for comparing against the current wicks of a Doji.
The 'Behavior' list has three settings:
ONE: Only one wick length needs to exceed the average by the tolerance for a Doji to be considered 'Long Legged'.
BOTH: Both wick lengths need to exceed the average of the tolerance of their respective wicks (upper wicks are compared to upper wicks, lower wicks compared to lower) to be considered 'Long Legged'.
AVG: Both wicks and the averages of the previous wicks are added together, divided by two, and compared. If the 'average' of the current wicks exceeds this combined average of prior wicks by the tolerance, then this would constitute a valid 'Long Legged' Doji. (For Dojis in general - SEE LIMITATIONS)
The final input is one related to candle patterns which require a Marubozu candle in them. The two settings for this input are 'INCLUSIVE' and 'EXCLUSIVE'. If INCLUSIVE is selected, any opening/closing variant of Marubozu candles will be allowed in the patterns that require them.
For two-candle patterns, there are:
2 — Settings which define 'Engulfing' parameters:
Engulfing Setting - Two options, RANGE or BODY which sets up how one candle may 'engulf' the previous.
Inclusive Engulfing - Boolean which enables if 'engulfing' candles can be equal to the values needed to 'engulf' the prior candle.
For the 'Engulfing Setting':
RANGE: If the second candle's high-low range completely covers the high-low range of the prior candle, this is recognized as 'engulfing'.
BODY: If the second candle's open-close completely covers the open-close of the previous candle, this is recognized as 'engulfing'. (SEE LIMITATIONS)
4 — Booleans specifying different settings for a few patterns:
One which allows for 'opens within body' patterns to let the second candle's open/close values match the prior candles' open/close.
One which forces 'Kicking' patterns to have a gap if the Marubozu setting is set to 'INCLUSIVE'.
And Two which dictate if the individual candles in 'Stomach' patterns need to be 'Tall'.
8 — Floating point values which affect 11 different patterns:
One which determines the distance the close of the first candle in a 'Hammer Inverted' pattern must be to the low to be considered valid.
One which affects how close the opens/closes need to be for all 'Lines' patterns (Bull/Bear Meeting/Separating Lines).
One that allows some leeway with the 'Matching Low' pattern (gives a small range the second candle close may be within instead of needing to match the previous close).
Three tolerances for On Neck/In Neck patterns (2 and 1 respectively).
A tolerance for the Thrusting pattern which give a range the close the second candle may be between the midpoint and close of the first to be considered 'valid'.
A tolerance for the two Tweezers patterns that specifies how close the highs and lows of the patterns need to be to each other to be 'valid'.
The first On Neck tolerance specifies how large the lower wick of the first candle may be (as a % of that candle's range) before the pattern is invalidated. The second tolerance specifies how far up the lower wick to the close the second candle's close may be for this pattern. The third tolerance for the In Neck pattern determines how far into the body of the first candle the second may close to be 'valid'.
For the remaining patterns (3, 4, and 5 candles), there are:
3 — Settings for the Deliberation pattern:
A boolean which forces the open of the third candle to gap above the close of the second.
A tolerance which changes the proximity of the third candle's open to the second candle's close in this pattern.
A tolerance that sets the maximum size the third candle may be compared to the average of the first two candles.
One boolean value for the Two Crows patterns (standard and Upside Gapping) that forces the first two candles in the patterns to completely gap if disabled (candle 1's close < candle 2's low).
10 — Floating point values for the remaining patterns:
One tolerance for defining how much the size of each candle in the Identical Black Crows pattern may deviate from the average of themselves to be considered valid.
One tolerance for setting how close the opens/closes of certain three candle patterns may be to each other's opens/closes.*
Three floating point values that affect the Three Stars in the South pattern.
One tolerance for the Side-by-Side patterns - looks at the second and third candle closes.
One tolerance for the Stick Sandwich pattern - looks at the first and third candle closes.
A floating value that sizes the Concealing Baby Swallow pattern's 3rd candle wick.
Two values for the Ladder Bottom pattern which define a range that the third candle's wick size may be.
* This affects the Three Black Crows (non-identical) and Three White Soldiers patterns, each require the opens and closes of every candle to be near each other.
The first tolerance of the Three Stars in the South pattern affects the first candle body's center position, and defines where it must be above to be considered valid. The second tolerance specifies how close the second candle must be to this same position, as well as the deviation the ratio the candle body to its range may be in comparison to the first candle. The third restricts how large the second candle range may be in comparison to the first (prevents this pattern from being recognized if the second candle is similar to the first but larger).
The last two floating point values define upper and lower limits to the wick size of a Ladder Bottom's fourth candle to be considered valid.
█ HOW TO USE
While there are many moving parts to this script, I attempted to set the default values with what I believed may help identify the most patterns within reasonable definitions. When this script is applied to a chart, the Candle Detection Mode (along with the BREAKOUT settings) and all candle switches must be confirmed before patterns are displayed. All switches are on by default, so this gives the user an opportunity to pick which patterns to identify first before playing around in the settings.
All of the settings/inputs described above are meant for experimentation. I encourage the user to tweak these values at will to find which set ups work best for whichever charts they decide to apply these patterns to.
Refer to the patterns themselves during experimentation. The statistic information provided on the tooltips of the patterns are meant to help guide input decisions. The breadth of candlestick theory is deep, and this was an attempt at capturing what I could in its sea of information.
█ LIMITATIONS
DISCLAIMER: While it may seem a bit paradoxical that this script aims to use past performance to potentially measure future results, past performance is not indicative of future results . Markets are highly adaptive and often unpredictable. This script is meant as an informational tool to show how patterns may behave. There is no guarantee that confidence intervals (or any other metric measured with this script) are accurate to the performance of patterns; caution must be exercised with all patterns identified regardless of how much information regarding prior performance is available.
Candlestick Theory - In the name, Candlestick Theory is a theory , and all theories come with their own limits. Some patterns identified by this script may be completely useless/unprofitable/unpredictable regardless of whatever combination of settings are used to identify them. However, if I truly believed this theory had no merit, this script would not exist. It is important to understand that this is a tool meant to be utilized with an array of others to procure positive (or negative, looking at you, short sellers ) results when navigating the complex world of finance.
To address the functionality note however, this script has an offset of 1 by default. Patterns will not be identified on the currently closing candle, only on the candle which has most recently closed. Attempting to have this script do both (offset by one or identify on close) lead to more trouble than it was worth. I personally just want users to be aware that patterns will not be identified immediately when they appear.
Trend Direction - Moving Averages - There is a small quirk with how MA settings will be adjusted if the user inputs two moving averages of the same length when the "MA Setting" is set to 'BOTH'. If Moving Averages have the same length, this script will default to only using MA 1 regardless of if the types of Moving Averages are different . I will experiment in the future to alleviate/reduce this restriction.
Price Analysis - BREAKOUT mode - With how identifying patterns with a look-ahead confirmation works, the percent returns for patterns that break out in either direction will be calculated on the same candle regardless of if P/L Offset is set to 'FROM CONFIRMATION' or 'FROM APPEARANCE'. This same issue is present in the Hikkake Hunter script mentioned earlier. This does not mean the P/L calculations are incorrect , the offset for the calculation is set by the number of candles required to confirm the pattern if 'FROM APPEARANCE' is selected. It just means that these two different P/L calculations will complete at the same time independent of the setting that's been selected.
Adaptive Coloring/Hard Limiting - Hard Limiting is only used with Adaptive Coloring and has no effect outside of it. If Hard Limiting is used, it is recommended to increase the 'Positive' and 'Negative' return tolerance values as a pattern's bullish/bearishness may be disproportionately represented with the gradient generated under a hard limit.
TARGET MODE - This mode will break rules regarding patterns that are overridden on purpose. If a pattern selected in TARGET mode would have otherwise been absorbed by a larger pattern, it will have that pattern's percent return calculated; potentially leading to duplicate returns being included in the matrix of all returns recognized by this script.
'Tall' Candle Setting - This is a wide-reaching setting, as approximately 30 different patterns or so rely on defining 'Tall' candles. Changing how 'Tall' candles are defined whether by the tolerance value those candles need to exceed or by the values of the candle used for the baseline comparison (RANGE/BODY) can wildly affect how this script functions under certain conditions. Refer to the tooltip of these settings for more information on which specific patterns are affected by this.
Doji Settings - There are roughly 10 or so two to three candle patterns which have Dojis as a part of them. If all Dojis are disabled, it will prevent some of these larger patterns from being recognized. This is a dependency issue that I may address in the future.
'Engulfing' Setting - Functionally, the two 'Engulfing' settings are quite different. Because of this, the 'RANGE' setting may cause certain patterns that would otherwise be valid under textbook and online references/definitions to not be recognized as such (like the Upside Gap Two Crows or Three Outside down).
█ PATTERN LIST
This script recognizes 85 patterns upon initial release. I am open to adding additional patterns to it in the future and any comments/suggestions are appreciated. It recognizes:
15 — 1 Candle Patterns
4 Hammer type patterns: Regular Hammer, Takuri Line, Shooting Star, and Hanging Man
9 Doji Candles: Regular Dojis, Northern/Southern Dojis, Gravestone/Dragonfly Dojis, Gapping Up/Down Dojis, and Long-Legged/Rickshaw Man Dojis
White/Black Long Days
32 — 2 Candle Patterns
4 Engulfing type patterns: Bullish/Bearish Engulfing and Last Engulfing Top/Bottom
Dark Cloud Cover
Bullish/Bearish Doji Star patterns
Hammer Inverted
Bullish/Bearish Haramis + Cross variants
Homing Pigeon
Bullish/Bearish Kicking
4 Lines type patterns: Bullish/Bearish Meeting/Separating Lines
Matching Low
On/In Neck patterns
Piercing pattern
Shooting Star (2 Lines)
Above/Below Stomach patterns
Thrusting
Tweezers Top/Bottom patterns
Two Black Gapping
Rising/Falling Window patterns
29 — 3 Candle Patterns
Bullish/Bearish Abandoned Baby patterns
Advance Block
Collapsing Doji Star
Deliberation
Upside/Downside Gap Three Methods patterns
Three Inside/Outside Up/Down patterns (4 total)
Bullish/Bearish Side-by-Side patterns
Morning/Evening Star patterns + Doji variants
Stick Sandwich
Downside/Upside Tasuki Gap patterns
Three Black Crows + Identical variation
Three White Soldiers
Three Stars in the South
Bullish/Bearish Tri-Star patterns
Two Crows + Upside Gap variant
Unique Three River Bottom
3 — 4 Candle Patterns
Concealing Baby Swallow
Bullish/Bearish Three Line Strike patterns
6 — 5 Candle Patterns
Bullish/Bearish Breakaway patterns
Ladder Bottom
Mat Hold
Rising/Falling Three Methods patterns
█ WORKS CITED
Because of the amount of time needed to complete this script, I am unable to provide exact dates for when some of these references were used. I will also not provide every single reference, as citing a reference for each individual pattern and the place it was reviewed would lead to a bibliography larger than this script and its description combined. There were five major resources I used when building this script, one book, two websites (for various different reasons including patterns, moving averages, and various other articles of information), various scripts from TradingView's public library (including TradingView's own source code for *all* candle patterns ), and PineScrypt's reference manual.
Bulkowski, Thomas N. Encyclopedia of Candlestick Patterns . Hoboken, New Jersey: John Wiley & Sons Inc., 2008. E-book (google books).
Various. Numerous webpages. CandleScanner . 2023. online. Accessed 2020 - 2023.
Various. Numerous webpages. Investopedia . 2023. online. Accessed 2020 - 2023.
█ AKNOWLEDGEMENTS
I want to take the time here to thank all of my friends and family, both online and in real life, for the support they've given me over the last few years in this endeavor. My pets who tried their hardest to keep me from completing it. And work for the grit to continue pushing through until this script's completion.
This belongs to me just as much as it does anyone else. Whether you are an institutional trader, gold bug hedging against the dollar, retail ape who got in on a squeeze, or just parents trying to grow their retirement/save for the kids. This belongs to everyone.
Private Beta for new features to be tested can be found here .
Vires In Numeris

VIX/VOLI RatioWe all know TVC:VIX . But what is NASDAQ:VOLI ?
VOLI is basically a measure of expectations for market volatility over the next 30 calendar days as expressed by ATM options on AMEX:SPY
nations.com
So why is this VIX /VOLI ratio important? It's because it can give an important measure of options skew.
It can show the premium of OTM options (particularly puts) over ATM.
It can show if traders are interested in owning wings in AMEX:SPY
Not a lot of info can be taken by just looking at the ratio as a standalone nominal value. Plus, the ratio is noisy and spotting a clear trend can be hard.
For these reasons, I decided to code this indicator (which is best used on the Daily chart).
I added two EMA clouds, 7 and 12 and color code them with respect to their positions. If 7 > 12, cloud will be green. If 7 < 12, cloud will be red. This will give a better view of how the ratio is trending.
I then added a lookback period that can be changed from the indicator's setting (along with the fast and slow EMAs).
The lookback period will be used to get the following parameters:
- highest value
- lowest value
- 10th, 30th, 50th, 70th and 90th percentiles
- Percentile Rank
- Average, Median and Mode
Having all these values in a table will give a better idea of where the current ratio sits.

SPX Fair Value Bands V2An updated version of the SPX Fair Value Bands script from dharmatech and based on the net liquidity concept by MaxJAnderson .
Now with full customization of parameters through the settings (Dialog Box) and allowing the options to the use of
1) Standard Bands based on Offsets of the Fair Value
2) Bollinger Bands
3) Keltner Channels
to better capture buy/sell areas rather than relying on noisy unreliably (and unevenly) updated data from the Treasury/Fed.
==================================
Net Liquidity's importance in the new post-COVID QE to QT regime as described MaxJAnderson
----------------
" In past cycles, size of Fed's balance sheet changed a lot, while TGA and RRP changed relatively little. So size of balance sheet roughly equated Net Liquidity.
(The Treasury General Account) TGA and (Reverse Repo) RRP didn't matter. They were rounding errors by comparison.
But starting in 2020, relative changes in TGA and RRP have been THREE TIMES LARGER than the change in size of the Fed's balance sheet. As result, changes in TGA and RRP have taken over as the primary drivers Net Liquidity.
This is new, and changes the game significantly. Again - the size of the Fed's balance sheet doesn't matter.
What matters is the portion of it that's available to circulate in the economy (Net Liquidity).
And ever since 2020, the Treasury and Reverse Repo have become what controls that. Not the size of Fed's balance sheet.
----------------
The idea that follows is simple,short when $SPX reaches extreme levels of overvaluation, and close out when SPX returns to being undervalued. Here's the formulas I currently use to determine fair value:
Fair Value = (Fed Bal Sheet - TGA - RRP)/1.1 - 1625
And here's the trading rules I currently follow:
Short when diff of $SPX - Fair Value > 350
Close when diff of $SPX - Fair Value < 150
When one of these rules is triggered upon market close on a given day, trades are entered at open of the following day "

Yearly Monthly Vertical Lines [MsF]This indicator that draws vertical lines for each year and month starting from the specified date and time.
For example, starting from August 26th, 2022,
The annual vertical lines are Aug 26th, 2022, Aug 26th, 2021, Aug 26th, 2020, Aug 26th, 2019, Aug 26th, 2018, Aug 26th, 2017...
It is useful to check the action of the chart at the event of each year and month.
Caution:
Since there is a limit to the Bar-Count that can be specified in the script language, depending on the chart period setting It may not be displayed.
-------------------------
指定した日時を起点として、年、月ごとに垂直線(縦線)を描画するインジケータです。
例えば、2022/9/1を起点とした場合、
年次のラインは、2021/9/1、2020/9/1、2019/9/1、2018/9/1、2017/9/1、2016/9/1...
に描画します。
年、月ごとのイベント時のチャートの動きを確認するのに便利です。
※過去イベント時の価格変動確認の際、手作業で垂直線を引くのが面倒なため、作成しました。
<注意>
スクリプト言語で指定できるBarCntに制限がある為、チャートの期間設定によっては
表示されない場合があります。※今後改善の余地あり

[blackcat] L2 FArden Thomas Voting With Multiple TimeframesLevel 2
Background
For Traders’ Tips of November 2020, the focus is F. Arden Thomas’ article in the August 2020 issue, “Voting With Multiple Timeframes”.
Function
F. Arden Thomas sums up the returns by a stochastic indicator in a voting process over seven different timeframes, and uses the resulting votes for trade signals. He shows us a new way of using the classic stochastic oscillator by combining many timeframes into a single value by voting. By using this voting process, buy and sell signals derived from many intervals become clearly visible on the chart. This is an interesting concept that can be applied to many common indicators such as the RSI or ADX, not just the stochastic.
Although the author creates a voting system by counting the number of times the indicator is in overbought/oversold range, I thought it would be interesting to create a composite indicator by averaging the stochastic value over multiple timeframes into a single indicator that moves along the standard scale.
Remarks
Maroon~ Red color bars for bullish market.
Teal~ Green color bars for bearish market.
This is a Level 2 free and open source indicator.
Feedbacks are appreciated.

CoinFlip Indicator + StrategyFlip a coin every Monday.
Heads, go long. Tail, go short. Stoploss at 1 ATR, and Take profit at 1 ATR too. 1:1 risk to reward ratio.
After backtesting 2018, 2019, and 2020 with 28 major currency pairs. We are getting close to a 50% win rate with an 8% standard deviation.
Believe it or not, this simple performs better than lots of the popular indicators out there.
Don't believe me? Test it out yourself!!
Use this as a baseline for your backtest and expose all your other crappy indicators :)
HOW TO USE:
As an indicator:
1. Use a daily chart
2. Green arrow below chart, go long, set a stop-loss at 1 x ATR, and take profit at 1 x ATR
3. Red arrow above chart, go short, set a stop-loss at 1 x ATR, and take profit at 1 x ATR
As an indicator:
1. In setting, set a year to test (default to 2020)
2. Go to the strategy tester and observe the stats
P.s. You can also set the period of the ATR to another value other than 14 periods.

BTC Cap Dominance RSI StrategyThis strategy is based on the BTC Cap Dominance RSI indicator, which is a combination of the RSI of Bitcoin Market Cap and the RSI of Bitcoin Dominance. The concept of this strategy is to get a good grasp of the bitcoin market flow by combining bitcoin dominance as well as bitcoin market cap.
BTC Cap Dominance (BCD) RSI is defined as:
BCD RSI = (BTC Cap RSI + BTC Dominance RSI) / 2
Case 1 (Bull market):
Both Cap RSI and Dominance RSI values are high
Case 2 (Neutral market):
Cap RSI is high but Dominance RSI is low
Cap RSI is low but Dominance RSI is high
Case 3 (Bear market):
Both Cap RSI and Dominance RSI values are low
When the BCD RSI value closes the candle above the Bull level, it triggers a long signal and when the value closes below the Bear level, it triggers a short signal.
(Note) Please note that TradingView's market cap symbols (CRYPTOCAP:TOTAL and CRYPTOCAP:TOTAL2) started in January 2020, so strategy backtesting is possible from this point on.
(Note) Since the real-time BCD RSI value does not come out with this strategy, it is recommended to use it together because the current value can be known and the long-short signal can be predicted in advance by using a separate BCD RSI Index together.
If "Use Combination of dominance RSI ?" is not checked in addition to the recommended default value of the strategy, the recommended values are Length (14), Bull level (74), Bear level (25).
_______________________________________________________________________
이 전략은 비트코인 시가총액의 RSI와 비트코인 도미넌스 RSI를 조합하여 만든 BTC Cap Dominance RSI 지표를 기반으로 만들어졌습니다. 이 전략의 컨셉은 비트코인 시가총액뿐만 아니라 비트코인 도미넌스를 조합함으로써 비트코인 시장 흐름을 잘 파악할 수 있도록 하는 것입니다.
BTC Cap Dominance (BCD) RSI는 다음과 같이 정의하였습니다.
BCD RSI = (BTC Cap RSI + BTC Dominance RSI) / 2
Case 1 (강세 장):
Cap RSI와 Dominance RSI 값 모두 높은 경우
Case 2 (횡보 장):
Cap RSI는 높지만 Dominance RSI는 낮은 경우
Cap RSI는 낮지만 Dominance RSI는 높은 경우
Case 3 (약세 장):
Cap RSI와 Dominance RSI 값 모두 낮은 경우
BCD RSI 값이 Bull level 위에서 캔들 마감할 경우 long 신호를 트리거하고 Bear level 아래에서 캔들 마감할 경우 short 신호를 트리거합니다.
(주의) 트레이딩뷰의 시가총액 심볼들 (CRYPTOCAP:TOTAL과 CRYPTOCAP:TOTAL2)이 2020년 1월부터 시작하였으므로 이 시점부터 전략 백테스팅이 가능한 점을 유의하십시오.
(주의) 이 전략은 실시간 BCD RSI 값이 나오지 않기 때문에 별도의 BCD RSI Index를 함께 사용하면 현재 값을 알 수 있어 롱숏 신호를 사전에 예측할 수 있으므로 함께 사용하기를 권장합니다.
전략의 추천 기본값 외에 "Use Combination of dominance RSI ?"를 체크하지 않는 경우 권장하는 값은 Length (14), Bull level (74), Bear level (25) 입니다.

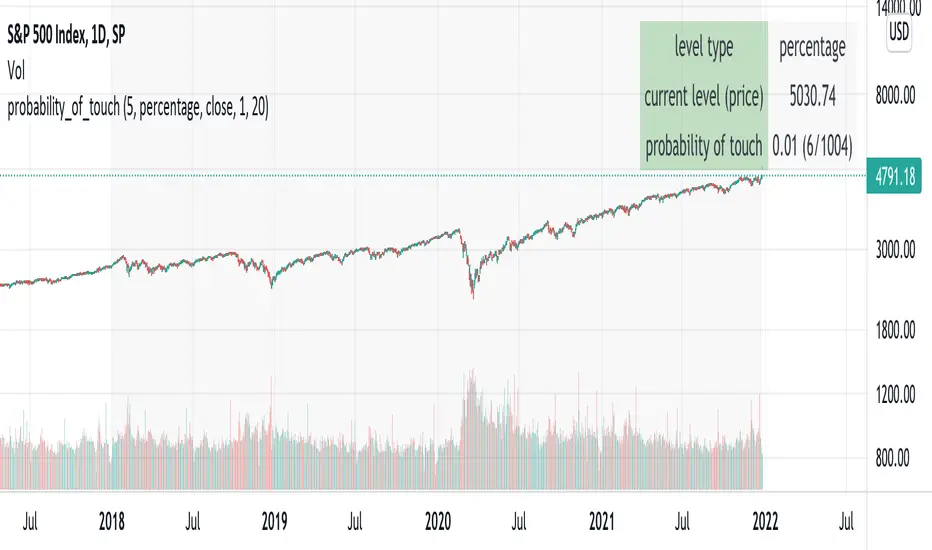
probability_of_touchBased on historical data (rather than theory), calculates the probability of a price level being "touched" within a given time frame. A "touch" means that price exceeded that level at some point. The parameters are:
- level: the "level" to be touched. it can be a number of points, percentage points, or standard deviations away from the mark price. a positive level is above the mark price, and a negative level is below the mark price.
- type: determines the meaning of the "level" parameter. "price" means price points (i.e. the numbers you see on the chart). "percentage" is expressed as a whole number, not a fraction. "stdev" means number of standard deviations, which is computed from recent realized volatlity.
- mark: the point from which the "level" is measured.
- length: the number of days within which the level must be touched.
- window: the number of days used to compute realized volatility. this parameter is only used when "type" is "stdev".
- debug: displays a fuchsia "X" over periods that touched the level. note that only a limited number of labels can be drawn.
- start: only include data after this time in the calculation.
- end: only include data before this time in the calculation.
Example: You want to know how many times Apple stock fell $1 from its closing price the next day, between 2020-02-26 and today. Use the following parameters:
level: -1
type: price
mark: close
length: 1
window:
debug:
start: 2020-02-26
end:
How does the script work? On every bar, the script looks back "length" days and sees if any day exceeded the "mark" price from "length" days ago, plus the limit. The probability is the ratio of such periods wherein price exceeded the limit to the total number of periods.
CDC ActionZone Multi-TF,Mult-Ticker with alert() [P-O-Concept]This is proof-of-concept for using single screen displaying triggering signal of multiple stock/crypto
This source code is subject to the terms of the Mozilla Public License 2.0 at mozilla.org
1. Original CDC Action Zone v3 2020 by © piriya33
Source of original indicator :
2. Table concept/part of code is pulled from Portfolio Tracker
***************************************************************************
CDC Action Zone is based on a simple EMA crossover between EMA12 and EMA26
The zones are defined by the relative position of price in relation to the two EMA lines
Different zones can be use to activate / deactivate other trading strategies
The strategy can also be used on its own with acceptable result, buy on the first green candle
and sell on the first red candle
***************************************************************************
Hint Color Meaning :
Green = FastMA > SlowMA and Price is above FastMA
Blue = FastMA < SlowMA and Price is above both MA
LightBlue = FastMA < SlowMA and Price is between both MA
Red = FastMA < SlowMA and Price is below FastMA
Orange = FastMA > SlowMA and Price is below both MA
Yellow = FastMA > SlowMA and Price is between both MA
Blue/LightBlue/Orange/Yellow should be used with another indicator (such as divergent or so)
Cautions:
- This indicator is not meant to be used as "Signal" or "Trading System"
- This indicator provide a quick-glimpse to multiple ticker in same screen. You'll still have to see indications using original CDC Action Zone (If you're using with CDC System), or combining with another indicator (For shorter tf or scalping, or short/long cover)
- Up to 10 Tickers / Timeframe + Current ticker
Alert Creation Guideline
If this indicator will be used as alert. The timeframe for ticker should be set to "same as" the chart you're using, ie, to set alert on 4h, it should be created in 4h-timeframe (Alert is fired on bar close, using 1D-TABLE in 4H-CHART may trigger alert up to 6 times. else if using in 4H-TABLE in 1D-CHART the alert may not trigger at all)
Considering using ohlc4, hlc3, hl2 for market with no session
PS. Send me a message if you see any bug. (especially if using JSON, I have no chance to test with multiple alert at same tick.)

WEEKLY BTC TRADING SCRYPTWeekly BTC Trading Scrypt(WBTS)
This script is only suggested for cryptocurrencies and weekly buying strategy which is long term.Using it in another markets(e.g forex,stock,e.t.c) is not suggested. The thing makes it different than other strategies we try to understand bull and bear seasons and buying selected crypto currency as using formula if weekly closing value crossover eight weeks simple moving avarage buy,else if selected crypto currency's weekly closing value crossunder eight weeks simple avarage sell. Eight week moving avarage is also uses weekly closing prices but for being able to use this strategy ,trading pair must have more than eight candles in weekly chart otherwise the 8 weeks simple moving avarage value cannot be calculated and script does not work.
This script has a chart called WBTS and it has following features:
Strategy group consist of 3 inputs:
1)Source: Close by default. Our whole strategy uses close values. You can change it but not suggested.
2)Loss Ratio: Because of the cases like the circumstances that manipulates market or high volatility , sometimes graphic show wrong buying signals and this ratio saves user from big money looses(Note : This ratio will always work when selling condition occurs to make user take his profit or prevent him to loss more money because of a wrong positive comes from the indicator.)
3)Reward Ratio : When selling condition happens it will exit user with more profit(if price is already higher than buying point) otherwise it will dimunish loss a bit(if user is below of buying point) or prevents looses(if user is in buying point when selling condition happened.
MA group consist of 2 inputs:
COLOR:Specifies color of the moving avarage.It is equal to #FF3232by hex color code by default.
LINE WIDTH: Specifies linewidth of the moving avarage. It is 2 by default.
GRAPHIC group consist of 2 inputs:
COLOR: It specifies the color of the line which consist of weekly closing prices. It is equal to #6666FF hex color code by default.
LINE WIDTH: Specifies linewidth of the line which consist of weekly closing prices. It is 2 by default.
STRATEGY EXECUTION YEAR: It will show the orders,profits and looses done by script after the input year giving in it.It is 2020 by default.
The last feature is strategy equity,it is not in one of these groups. User should click on settings button on the WBTS indicator than chose Style section and there is a deactivated check box near in the plot section if user activate it, the equity line will show in indicator's graph.
Logic of This Strategy:The story of this strategy began when I studied BTC's price movement from 2020 to today with 8 weeks simple moving avarage (it takes weekly closes as source) and weekly clossing values. I understood that there was a perfect interest between bull and bear market and following conditions:
buy_condition=crossover(weekly_closing_values,8_week_simple_moving_avarage)
sell_condition=crossover(weekly_closing_values,8_week_simple_moving_avarage)
and I tried same thing on the same and bigger time frames("for example i studied how the strategy works from the beginning to today with bitcoin and what is our final equity") with bitcoin and other cryptocurrencies and this made me saw better the relation between giving conditions and general market psychology, however I also witnessed some wrong positives coming by script and used a risk reward ratio to save user and set risk reward ratio 1/3 after a research.
For both conditions(buy_condition and sell_condition),when they are realised,script will alert users and an order will be triggered.
Before finishing the description,from settings/properties/ user can set initial capital,base currency,order size and type,but it is 100000 for initial_amount and 1 contract for order size by default.
In backtesting I used the options like the following example :
Initial capital=1000
Base_curreny=USD
Order size=40 USD
Properties place must set different by every single user according to his or her capital and order size must not be higher than his total money because this script is not the best or a good script for derivatives. It is only written for long term-crypto spot trading and I strongly recommend to users that margin may cause bad results and please do not use it with any margin or any market different than crypto market.
Thank you very much for reading)

SPX Excess CAPE YieldHere we are looking at the Excess CAPE yield for the SPX500 over the last 100+ years
"A higher CAPE meant a lower subsequent 10-year return, and vice versa. The R-squared was a phenomenally high 0.9 — the CAPE on its own was enough to explain 90% of stocks’ subsequent performance over a decade. The standard deviation was 1.37% — in other words, two-thirds of the time the prediction was within 1.37 percentage points of the eventual outcome: this over a quarter-century that included an equity bubble, a credit bubble, two epic bear markets, and a decade-long bull market."
assets.bwbx.io
In December of 2020 Dr. Robert Shiller the Yale Nobel Laurate suggested that an improvement on CAPE could be made by taking its inverse (the CAPE earnings yield) and subtracting the us10 year treasury yield.
"His model plainly suggests that stocks will do badly over the next 10 years, and that bonds will do even worse. This was the way Shiller put it in a research piece for Barclays Plc in October, (which can be found on SSRN Below):
In summary, investors expect a certain return in equities as compensation for investing in a riskier asset class, and as interest rates have declined, the relative expected return for equities has increased dramatically. We believe this may quantitatively help to explain investors current preference for equities over bonds, and as such the quick recoveries we are observing (with the exception of the UK), whilst still in the midst of a pandemic. In the US in particular, we are once again observing stretched valuations and high CAPE ratios compared to history."
Sources:
papers.ssrn.com
www.bloomberg.com
The standard trading view disclaimer applies to this post -- please consult your own investment advisor before making investment decisions. This post is for observation only and has no warranty etc. www.tradingview.com
Best,
JM

TSI HMA CCIHi!
This strategy has TSI and CCI indicators with the CCI being based on a HMA instead of the Price.
There is a number of conditions that must combine to create buy or sell signals, but it is basically a couple of MA crossovers.
The strategy opens new orders on each candle if the conditions are met, Either direction, so it is hedging.
It wont open new orders if there is a floating loss, and so is constantly attempting to hold a floating profit (drawup instead of drawdown)
But It has a StopLoss (set by user) for closing of losing orders, and it closes all orders in basket style when account is in profit to users set amount target profit.
Low commission set to simulate swap but Forex pairs generally dont have commission like the crypto exchanges do. So if you use this on cryptos, remember to increase the commission to your brokers amount.
Crypto users will likely find that because this opens so many orders the commission could erase its profits.
So i recommend this for Forex only, and perhaps, only NZDUSD 4H chart. other pairs, change settings for.
The strategy has settings for testing on target time spans, so you could test it on just Jan-Feb 2020 for example, if you want, or from Jan 2020 to present day.
Have Fun! Open Script for copy/paste/edit/publish your own version :)

HTF High/Low Repaint StrategyHere is an another attempt to demonstrate repainting and how to avoid them. It happened few times to me that I develop a strategy which is giving immense returns - only to realize after few forward testing that it is repainting. Sometimes, it is well disguised even during forward testing.
In this simple strategy, conditions are as below:
Buy : When a 3M bar produces high and low higher than it's previous 3M bar high, low
Sell : When a 3M bar produces high and low lower than its previous 3M bar high, low.
Default setting is : lookahead = on and offset = 0
This means current 3M bar high low is plotted for all the daily bars within this month. Which means, strategy looks ahead of time to see this 3M bar high is higher than previous 3M bar high during the start of the first daily bar. Hence, this combination leads to massive repaint.
For example, trade made on October 2nd 2018 already knows well ahead of time that price is going to go down in next 3 months:
Similarly, after 2 years on October 2nd 2020 - the strategy already knows that last 3M high is going to be breached on 7th December 2020
Solution: If you are using security for higher timeframes, safer option is always to use offset 1. Further details in the trading view script:
BUT
It may still repaint if we are passing function to security.
For example:
f_secureSecurity(_symbol, _res, _src) => security(_symbol, _res, _src , lookahead = barmerge.lookahead
This function will likely avoid any repainting with Higher timeframe if we are passing in built variables such as high, low, close, open etc. But, if we try to pass supertrend, this will not produce right results. This is because supertrend calculation in turn uses high/low/close values which do not consider the offset while calculating. Hence, even with offset 1, this will still produce issues.
Hence, the call:
= f_secureSecurity(syminfo.tickerid, derivedResolution, supertrend(3,10), offset) will again lead to massive repainting. Solution to this is to implement supertrend function and use high, low, close values derived from secureSecurity.
Quick tips to identify or be suspicious about repainting
Unbelievable results on all timeframes and all instruments with both long and short trades
Lower timeframes giving significantly higher returns on backtest when compared to higher timeframe
If these things happen, be wary about repainting and do a through check of all security function usage in your strategy.
All the best :)
PS: Apply 3-5 days resolution and see the fun. Also, WHC is one hell of a Christmas tree. Could have made immense profit in the same strategy even without repainting.
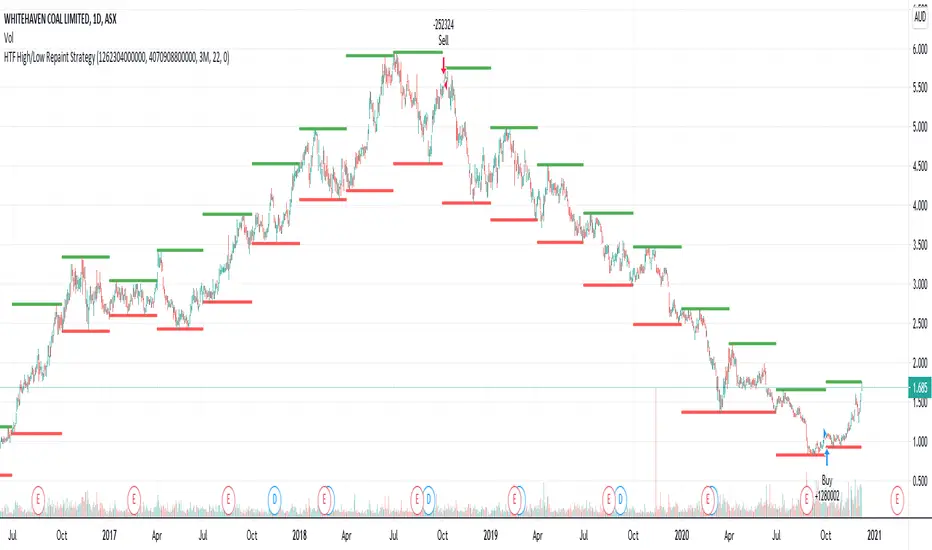
Bitlinc MARSI Study AST w/ Take Profit & Stop loss - beta 0.1This script is beta 0.1 - will update as soon as the script is tradable
This script is based on AST on a 10 minute timeframe. You can change the asset and the timeframe for any asset you want to trade, but for it to work correct ALL settings have to be testes in the Strategy section of the TradingView. Each assets and timeframe require a different mixture of settings. This is NOT a one settings fits all trading for all assets on any timeframe. Below are the settings and explanation on how it works.
How it fires a buy / sell:
The script will plot an RSI with upper and lower bands in a separate indicator window. The idea behind this script is to fire a LONG when MA crosses OVER lower band and fire a SHORT when the MA crosses under the lower band. Each order that fires is an OCO (Order Cancels Order) for pyramiding.
Settings:
You have full control of these settings as mentioned above, you must configure every part of this script for each asset and timeframe you trade.
- Length of MA
- Length
- Upper bands of RSI
- Lower bands of RSI
- Take profit percentage
- Stop loss percentage
- Month to start and end the strategy (within 2020)
- Day to start and end the strategy (within 2020)
- Quantity type
- Slippage
- Pyramiding
***Remember that after the signal to enter or exit a trade is fired, the alert will trigger AFTER the close of the candle that caused the tigger to fire
