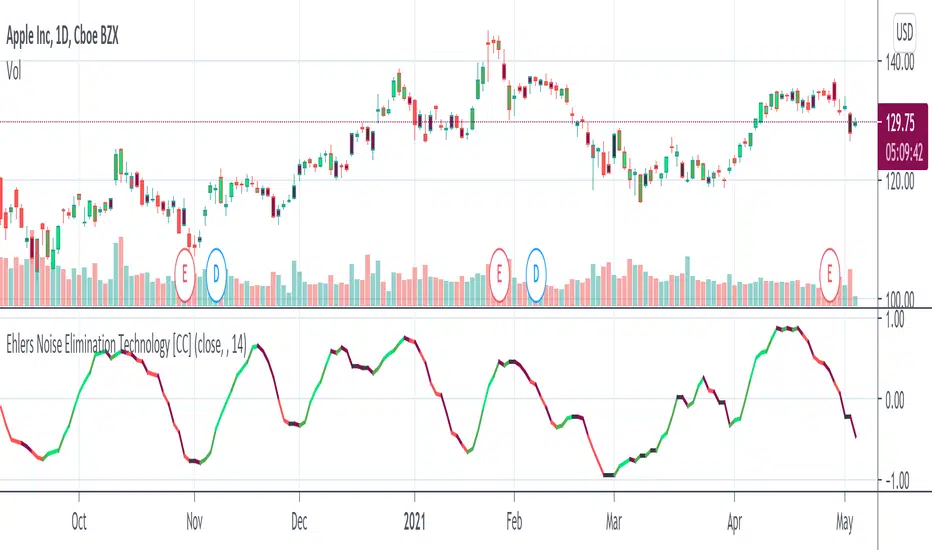
Ehlers Noise Elimination Technology [CC]The Noise Elimination Technology Indicator was created by John Ehlers (Stocks and Commodities Dec 2020 pg 17) and he created this indicator to be used with his version of RSI but I think it works well with any price data or any indicator really.
I'm trying a new signal system due to a request from @luckyCamel58789 so let me know what you think. I now differentiate between a buy and a strong buy when the indicator increases over itself twice and vice versa. Dark green is a strong buy and light green is a regular buy. Dark red is a strong sell and light red is a regular sell.
Let me know what indicators you would like to see me publish!
Cari dalam skrip untuk "2020年+国债收益率"
Zweig Market Breadth Thrust Indicator StrategyThe Breadth Thrust Indicator is a technical indicator which determines market momentum, signaling the start of a potential new bull market.
The Breadth Thrust Indicator was developed by Martin Zweig, an American stock investor, financial analyst, and investment adviser. According to Zweig, the concept is based on the principle that the sudden change of money in the investment markets elevates stocks and signals increased liquidity. In other words, this indicator is all about how quickly the NYSE's advancing and declining numbers go from poor to great in a compressed time period.
A "Thrust" indicates that the stock market has rapidly changed from an oversold condition to one of strength, but has not yet become overbought. This is very rare and has happened only a few times. Dr . Zweig also points out that most bull markets begin with a Breadth Thrust.
More info can be found at www.investopedia.com
I have inspired by indicator introduced in TradingView by LazyBear and adopted the logic from there. Thanks LazyBear !!!
Though indicator signals the new Bull market, but I have not found much information how to use it in daily market. So I had come up with a strategy, which would allow us to trade SPY, QQQ , AMEX and securities under these markets.
I have used MA setting as 65 (since Zweig indicator setting was 10 days , based on that I set 65 for Hourly chart ... 10d x 6.5 Hrs = 65 in my startegy). You have to change this setting if you change the timeframe. Also , note that this strategy is for Stock Market only.
Strategy Rule/Settings
===================
Select the market type based on your security symbol.
SPY => use NYSE
QQQ => use NASDAQ
any other security => check exchange it was listed and select the corresponding market.
if you dont know , use COMBINED option
BUY
====
when indicator cross 0.40 from below
Note:
1. see how well it picks the bottoms ... example : Nov 2020 ....
2. setting 0.45 is also produces good results , only thing is you get more signals.
EXIT
=====
Exit when indicator cross down from 0.60 . I have used RSI (5) for partial exits. These two are available in settings
Close the whole position when indicator crossing down 0.40
STOP LOSS
=========
defaulted to 5%
Please Note , I have tested SPY , QQQ on Horly chart with MA 65. You need to chnage the MA setting based on your time frame and check the results.
WARNING
========
For the use of educational purposes only

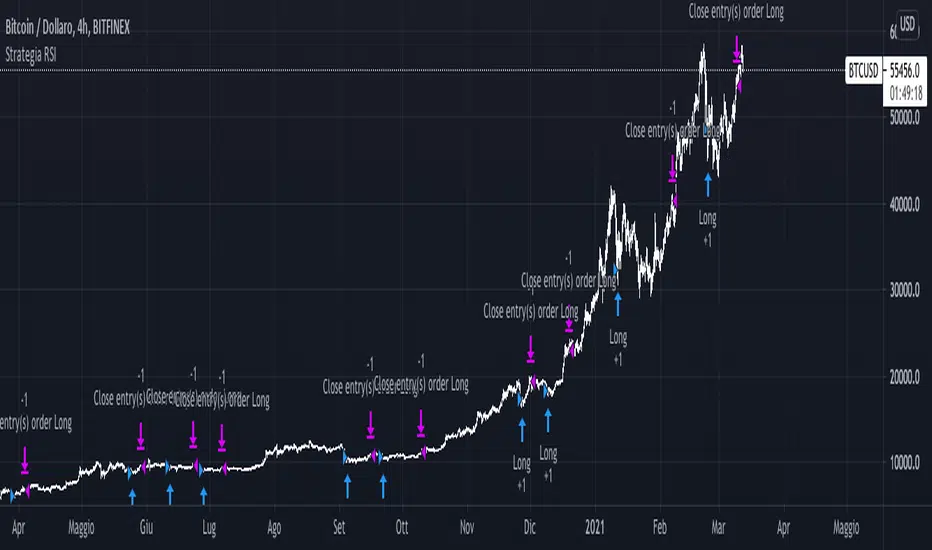
Strategia RSI sempliceQuesto semplice script sfrutta il RSI a 14 periodi per comprare (solo long) quando RSI crocia al rialzo i 30 (oversold line) e chiude l'operazione quando RSI crocia al ribasso i 70 (overbought line).
La strategia è stata progettata sul TimeFrame delle 4H (su BTC) e dimostra come una semplicissima strategia con un solo segnale poteva portare un 20% dal 2020 ad oggi su BTC/USD
RedK Strength of MovementThis is a quick indicator i wrote to inspect the strength of price movement and show when what i consider to be "a quality trend" has been established. the code is open and commented - the "math concept" is really simple and i'm not sure if this has already been coded before :) - my apologies if it was.
my main goal was to identify opportunities to establish "simple, straight" long call or put positions for the stocks i follow
- what i noticed thru the years is that some opportunities will present themselves to take these basic option positions but they are "rare", maybe once or twice a year -- for example, in 2020, TSLA presented 2 such opportunities around the split and the index inclusion - so i needed an indicator that exposes these setups. if you can time yourself with these setups, they are incredibly rewarding.
these setups will happen when the SoM reaches 100% (in either directions) while it's in agreement with the prevailing trend (hence the need to use the SoM with a MACD or something like the Ribbon) - if the SoM hits the 100% in one direction and the trend is not in the same direction, that signal is invalid. see the chart for some examples.
a quick useful observation, is that the SoM will sometimes also act as a leading indicator for an imminent change in trend direction, which makes sense .. given that the SoM relies on exposing the "relative" movement or change of price (close for example) - thru the use of the stoch() function - and that this "change value" will usually expand in the direction of a strong trend and starts to contract ahead of a reversal.
Please fee free to use this code, leverage the indicator, or give feedback
i may come back later and update this with some features (like making this volume-weighted)
best of luck!

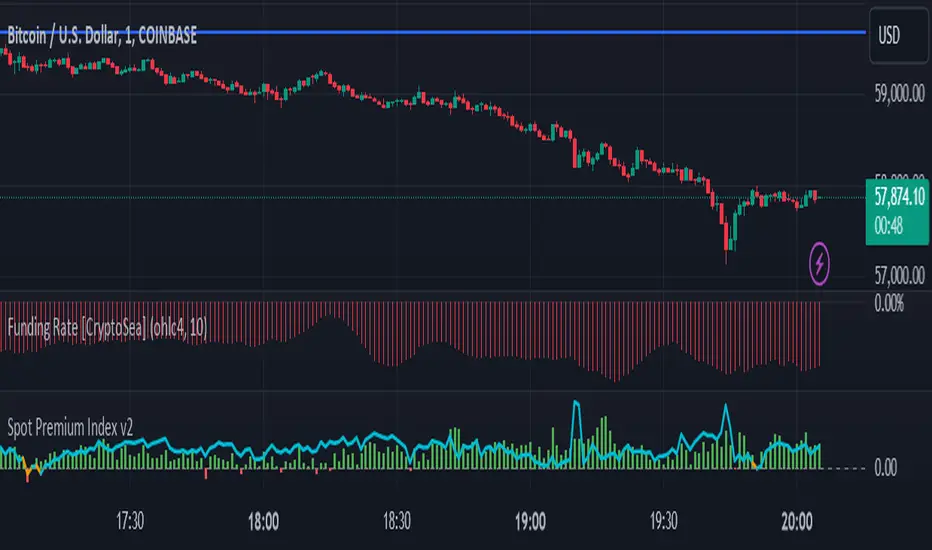
BTC Coinbase PremiumThis script is base on another script by oh 92.
It basically shows you where the price of Bitcoin (in USD) on Coinbase trades at a premium against an average of several futures exchanges.
Coinbase premium shows spot interest on bitcoin which happens either when futures are shorting heavily but spot holds the price up (often bullish especially when price is at a support level).
Negative premium shows that futures are leading price during an uptrend or spot is leading price during a downtrend.
Strong positive premium is often considered bullish.
Strong negative premium is often considered bearish even if price goes up.
The histogramm coinbase premium vs an average of several futures exchanges (Bitmex, Bitfinex, Binance, FTX, Phemex and Bitstamp).
The line diagramm shows coinbase premium vs Bybit.
In contrast to the script by oh92 this script uses different exchages (especially Bybit as a lot of former Bitmex traders changed to Bybit during september and october 2020).
All values are in percent because differences in USD only are not suitable for historic prices. This means if CB-premium is -0.1 then futures trade 0.1% lower than coinbase.
TradingView Alerts to MT4 MT5 - Forex, indices, commoditiesHowdy Algo-Traders! This example script has been created for educational purposes - to present how to use and automatically execute TradingView Alerts on real markets.
I'm posting this script today for a reason. TradingView has just released a new feature of the PineScript language - ALERT() function. Why is it important? It is finally possible to set alerts inside PineScript strategy-type script, without the need to convert the script into study-type. You may say triggering alerts straight from strategies was possible in PineScript before (since June 2020), but it had its limitations. Starting today you can attach alert to any custom event you might want to include in your PineScript code.
With the new feature, it is easier not only to execute strategies, but to maintain codebase - having to update 2 versions of the code with each single modification was... ahem... inconvenient. Moreover, the need to convert strategy into study also meant it was required to rip the code from all strategy...() calls, which carried a lot of useful information, like entry price, position size, and more, definitely influencing results calculated by strategy backtest. So the strategy without these features very likely produced different results than with them. While it was possible to convert these features into study with some advanced "coding gymnastics", it was also quite difficult to test whether those gymnastics didn't introduce serious, bankrupting bugs.
//////
How does this new feature work? It is really simple. On your custom events in the code like "GoLong" or "GoShort", create a string variable containing all the values you need inside your alert and this string variable will be your alert's message. Then, invoke brand new alert() function and that's it (see lines 67 onwards in the script). Set it up in CreateAlert popup and enjoy. Alerts will trigger on candle close as freq= parameter specifies. Detailed specification of the new alert() function can be found in TradingView's PineScript Reference (www.tradingview.com), but there's nothing more than message= and freq= parameters. Nothing else is needed, it is very simple. Yet powerful :)
//////
Alert syntax in this script is prepared to work with TradingConnector. Strategy here is not too complex, but also not the most basic one: it includes full exits, partial exits, stop-losses and it also utilizes dynamic variables calculated by the code (such as stop-loss price). This is only an example use case, because you could handle variety of other functionalities as well: conditional entries, pending entries, pyramiding, hedging, moving stop-loss to break-even, delivering alerts to multiple brokers and more.
//////
This script is a spin-off from my previous work, posted over a year ago here: Some comments on strategy parameters have been discussed there, but let me copy-paste most important points:
* Commission is taken into consideration.
* Slippage is intentionally left at 0. Due to shorter than 1 second delivery time of TradingConnector, slippage is practically non-existing.
* This strategy is NON-REPAINTING and uses NO TRAILING-STOP or any other feature known to be causing problems.
* The strategy was backtested on EURUSD 6h timeframe, will perform differently on other markets and timeframes.
Despite the fact this strategy seems to be still profitable, it is not guaranteed it will continue to perform well in the future. Remember the no.1 rule of backtesting - no matter how profitable and good looking a script is, it only tells about the past. There is zero guarantee the same strategy will get similar results in the future.
Full specs of TradingView alerts and how to set them up can be found here: www.tradingview.com

Strange_index_version jan2021_1this is an indicator show the most important support and resistant in crypto market for some days in Jan 2020
just chosse which date you want to see the resistant and support in it and the indicator will plot it

Vortex and RSI ts 2020* System long only (for shares).
* Enter if Vortex up crosses up vortex down and there is the classical second test of a close higher than previous' high
* Exit if
a) RSI crosses under 70 OR
b) on the contrary, Vortex down crosses up vortex up and there is the classical second test of a close lower than previous' low
* fixed money management to be optimized added.

Pyramiding Entries On Early Trends (by Coinrule)Pyramiding the entries in a trading strategy may be risky but at the same time very profitable with a proper risk management approach. This strategy seeks to spot early signs of uptrends and increase the position's size while the right conditions persist.
Each trade comes with its stop-loss and take-profit to enforce a proportional risk/reward profile.
The strategy uses a mix of Moving Average based setups to define the buy-signal.
The Moving Average (200) is above the Moving Average (100), which prevents from buying when the uptrend is already in its late stages
The Moving Average (9) is above the Moving Average (100), indicating that the coin is not in a downtrend.
The price crossing above the Moving Average (9) confirms the potential upside used to fire the buy order.
Each entry comes with a stop-loss and a take-profit in a ratio of 1-to-1. After over 400 backtests, we opted for a 3% TP and 3% SL, which provides the best results.
The strategy is optimized on a 1-hour time frame.
The Advantages of this strategy are:
It offers the possibility of adjusting the size of the position proportionally to the confidence in the possibilities that an uptrend will eventually form.
Low drawdowns. On average, the percentage of trades in profit is above 60%, and the stop-loss equal to the take-profit reduces the overall risk.
This strategy returned good returns both with trading pairs with Fiat/stable coins and with BTC. Considering the mixed trends that cryptocurrencies experienced during 2020 vs BTC, this strengthens the strategy's reliability.
The strategy assumes each order to trade 20% of the available capital and pyramids the entries up to 7 times.
A trading fee of 0.1% is taken into account. The fee is aligned to the base fee applied on Binance, which is the largest cryptocurrency exchange.

NET MyRSIIn this script, I will convert the MyRSI function from John F. Ehlers mentions in the May 2018 issue of Stocks and Commodities. I will build on top of the idea and add a noise elimination Technique presented in the December 2020 issue of Stocks and Commodities.
My Rsi
Is an RSI alike version of the well-known RSI indicator where the output is range-bound between -1 and 1 values. The indicator accrues Closes up and Closes down and plots their ratio divided by their sum.
Noise Elimination Technique
As a noise elimination technique, we are using a slightly modified and simplified version of Kendall Correlation that allows us to use it on a single indicator. In general Kendall Correlation is used to measure an association between two sets of variables.
Conclusion
This publishing is solely for research purposes and should not be directly traded with. More detailed information can be found in those Two publications of Stocks and Commodities.

GBTC Fomo Panic PremiumIt is rumored that GBTC price action leads the Bitcoin market. This indicator compares GBTC fomo/panic levels to the (Binance) BTC spot market. Fomo is measured as large percentage moves of the high price from the min over a look-back period. Panic is measured as large percentage moves of the low price from the max over a look-back period. A prime example of this indicator's usage would be as a sell signal confirmation during the 2020 pre-Thanksgiving panic exhibited on the 1-hour chart while the 20 EMA was still above the 99 SMA.
You can customize the leading and lagging markets and the length of the lookback period. I would love to hear what parameters, markets and timeframes work for you. Maybe there is a way to leave comments, or hit me up on Twitter: @thirdreplicator
May you profit and enjoy.

Pinescript v4 - The Holy Grail (Trailing Stop)After studying several other scripts, I believe I have found the Holy Grail! (Or perhaps I've just found a bug with Tradingview's Pinescript v4 language) Anyhow, I'm publishing this script in the hope that someone smarter than myself could shed some light on the fact that adding a trailing stop to any strategy seems to make it miraculously...no that's an understatement...incredulously, stupendously, mind-bendingly profitable. I'm talking about INSANE profit factors, higher than 200x, with drawdowns of <10%. Sounds too good to be true? Maybe it is...or you could hook it up to your LIVE broker, and pray it doesn't explode. This is an upgraded version of my original Pin Bar Strategy.
Recommended Chart Settings:
Asset Class: Forex
Time Frame: H1
Long Entry Conditions:
a) Exponential Moving Average Fan up trend
b) Presence of a Bullish Pin Bar
c) Pin Bar pierces the Exponential Moving Average Fan
Short Entry Conditions:
a) Exponential Moving Average down trend
b) Presence of a Bearish Pin Bar
c) Pin Bar pierces the Exponential Moving Average Fan
Exit Conditions:
a) Trailing stop is hit
b) Moving Averages cross-back (optional)
c) It's the weekend
Default Robot Settings:
Equity Risk (%): 3 //how much account balance to risk per trade
Stop Loss (x*ATR, Float): 0.5 //stoploss = x * ATR, you can change x
Stop Loss Trail Points (Pips): 1 //the magic sauce, not sure how this works
Stop Loss Trail Offset (Pips): 1 //the magic sauce, not sure how this works
Slow SMA (Period): 50 //slow moving average period
Medium EMA (Period): 18 //medium exponential moving average period
Fast EMA (Period): 6 //fast exponential moving average period
ATR (Period): 14 // average true range period
Cancel Entry After X Bars (Period): 3 //cancel the order after x bars not triggered, you can change x
Backtest Results (2019 to 2020, H1, Default Settings):
AUDUSD - 1604% profit, 239.6 profit factor, 4.9% drawdown (INSANE)
NZDUSD - 1688.7% profit, 100.3 profit factor, 2.5% drawdown
GBPUSD - 1168.8% profit, 98.7 profit factor, 0% drawdown
USDJPY - 900.7% profit, 93.7 profit factor, 4.9% drawdown
USDCAD - 819% profit, 31.7 profit factor, 8.1% drawdown
EURUSD - 685.6% profit, 26.8 profit factor, 5.9% drawdown
USDCHF - 1008% profit, 18.7 profit factor, 8.6% drawdown
GBPJPY - 1173.4% profit, 16.1 profit factor, 7.9% drawdown
EURAUD - 613.3% profit, 14.4 profit factor, 9.8% drawdown
AUDJPY - 1619% profit, 11.26 profit factor, 9.1% drawdown
EURJPY - 897.2% profit, 6 profit factor, 13.8% drawdown
EURGBP - 608.9% profit, 5.3 profit factor, 9.8% drawdown (NOT TOO SHABBY)
As you can clearly see above, this forex robot is projected by the Tradingview backtester to be INSANELY profitable for all common forex pairs. So what was the difference between this strategy and my previous strategies? Check my code and look for "trail_points" and "trail_offset"; you can even look them up in the PineScript v4 documentation. They specify a trailing stop as the exit condition, which automatically closes the trade if price reverses against you.
I however suspect that the backtester is not properly calculating intra-bar price movement, and is using a simplified model. With this simplfied approach, the trailing stop code becomes some sort of "holy grail" generator, making every trade entered profitable.
Risk Warning:
This is a forex trading strategy that involves high risk of equity loss, and backtest performance will not equal future results. You agree to use this script at your own risk.
Hint:
To get more realistic results, and *maybe* overcome the intrabar simulation error, change the settings to: "Stop Loss Trail Points (pips)": 100
I am not sure if this eradicates the bug, but the entries and exits look more proper, and the profit factors are more believable.

Zignaly TutorialThis strategy serves as a beginner's guide to connect TradingView signals to Zignaly Crypto Trading Platform.
It was originally tested at BTCUSDT pair and 1D timeframe.
Before using this documentation it's recommended that you:
Use default TradingView strategy script or another script and setup its associated alert manually. Just make the alert pop-up in the screen.
Create a 'Copy-Trader provider' (or Signal Provider) in Zignaly and send signals to it either thanks to your browser or with some basic programming.
SETTINGS
__ SETTINGS - Capital
(CAPITAL) Capital quote invested per order in USDT units {100.0}. This setting is only used when '(ZIG) Provider type' is set to 'Signal Provider'.
(CAPITAL) Capital percentage invested per order (%) {25.0}. This setting is only used when '(ZIG) Provider type' is set to 'Copy Trader Provider'.
__ SETTINGS - Misc
(ZIG) Enable Alert message {True}: Whether to enable alert message or not.
(DEBUG) Enable debug on order comments {True}: Whether to show alerts on order comments or not.
Number of decimal digits for Prices {2}.
(DECIMAL) Maximum number of decimal for contracts {3}.
__ SETTINGS - Zignaly
(ZIG) Integration type {TradingView only}: Hybrid : Both TradingView and Zignaly handle take profit, trailing stops and stop losses. Useful if you are scared about TradingView not firing an alert. It might arise problems if TradingView and Zignaly get out of sync. TradingView only : TradingView sends entry and exit orders to Zignaly so that Zignaly only buys or sells. Zignaly won't handle stop loss or other settings on its own.
(ZIG) Zignaly Alert Type {WebHook}: 'Email' or 'WebHook'.
(ZIG) Provider type {Copy Trader Provider}: 'Copy Trader Provider' or 'Signal Provider'. 'Copy Trader Provider' sends a percentage to manage. 'Signal Provider' sends a quote to manage.
(ZIG) Exchange: 'Binance' or 'Kucoin'.
(ZIG) Exchange Type {Spot}: 'Spot' or 'Futures'.
(ZIG) Leverage {1}. Set it to '1' when '(ZIG) Exchange Type' is set to 'Spot'.
__ SETTINGS - Strategy
(STRAT) Strategy Type: 'Long and Short', 'Long Only' or 'Short Only'.
(STOPTAKE) Take Profit? {false}: Whether to enable Take Profit.
(STOPTAKE) Stop Loss? {True}: Whether to enable Stop Loss.
(TRAILING) Enable Trailing Take Profit (%) {True}: Whether to enable Trailing Take Profit.
(STOPTAKE) Take Profit % {3.0}: Take profit percentage. This setting is only used when '(STOPTAKE) Take Profit?' setting is set to true.
(STOPTAKE) Stop Loss % {2.0}: Stop loss percentage. This setting is only used when '(STOPTAKE) Stop Loss?' setting is set to true.
(TRAILING) Trailing Take Profit Trigger (%) {2.5}: Trailing Stop Trigger Percentage. This setting is only used when '(TRAILING) Enable Trailing Take Profit (%)' setting is set to true.
(TRAILING) Trailing Take Profit as a percentage of Trailing Take Profit Trigger (%) {25.0}: Trailing Stop Distance Percentage. This setting is only used when '(TRAILING) Enable Trailing Take Profit (%)' setting is set to true.
(RECENT) Number of minutes to wait to open a new order after the previous one has been opened {6}.
DEFAULT SETTINGS
By default this strategy has been setup with these beginner settings:
'(ZIG) Integration type' : TradingView only
'(ZIG) Provider type' : 'Copy Trader Provider'
'(ZIG) Exchange' : 'Binance'
'(ZIG) Exchange Type' : 'Spot'
'(STRAT) Strategy Type' : 'Long Only'
'(ZIG) Leverage' : '1' (Or no leverage)
but you can change those settings if needed.
FIRST STEP
For both future of spot markets you should make sure to change '(ZIG) Zignaly Alert Type' to match either WebHook or Email. If you have a non paid account in TradingView as in October 2020 you would have to use Email which it's free to use.
RECOMMENDED SETTINGS
__ RECOMMENDED SETTINGS - Spot markets
'(ZIG) Exchange Type' setting should be set to 'Spot'
'(STRAT) Strategy Type' setting should be set to 'Long Only'
'(ZIG) Leverage' setting should be set to '1'
__ RECOMMENDED SETTINGS - Future markets
'(ZIG) Exchange Type' setting should be set to 'Futures'
'(STRAT) Strategy Type' setting should be set to 'Long and Short'
'(ZIG) Leverage' setting might be changed if desired.
__ RECOMMENDED SETTINGS - Signal Providers
'(ZIG) Provider type' setting should be set to 'Signal Provider'
'(CAPITAL) Capital quote invested per order in USDT units' setting might be changed if desired.
__ RECOMMENDED SETTINGS - Copy Trader Providers
'(ZIG) Provider type' setting should be set to 'Copy Trader Provider'
'(CAPITAL) Capital percentage invested per order (%)' setting might be changed if desired.
Strategy Properties setting: 'Initial Capital' might be changed if desired.
INTEGRATION TYPE EXPLANATION
'Hybrid': Both TradingView and Zignaly handle take profit, trailing stops and stop losses. Useful if you are scared about TradingView not firing an alert. It might arise problems if TradingView and Zignaly get out of sync.
'TradingView only': TradingView sends entry and exit orders to Zignaly so that Zignaly only buys or sells. Zignaly won't handle stop loss or other settings on its own.
HOW TO USE THIS STRATEGY
Beginner: Copy and paste the strategy and change it to your needs. Turn off '(DEBUG) Enable debug on order comments' setting.
Medium: Reuse functions and inputs from this strategy into your own as if it was a library.
Advanced: Check Strategy Tester. List of trades. Copy and paste the different suggested 'alert_message' variable contents to your script.
Expert: I needed a way to pass data from TradingView script to the alert. Now I know it's the 'alert_message' variable. I can do this own my own.
ALERTS SETUP
This is the important piece of information that allows you to connect TradingView to Zignaly in a semi-automatic manner.
__ ALERTS SETUP - WebHook
Webhook URL: https : // zignaly . com / api / signals.php?key=MYSECRETKEY
Message: { {{strategy.order.alert_message}} , "key" : "MYSECRETKEY" }
__ ALERTS SETUP - Email
Setup a new Hotmail account
Add it as an 'SMS email' in TradingView Profile settings page.
Confirm your own the email address
Create a rule in your Hotmail account that 'Redirects' (not forwards) emails to 'signals @ zignaly . email' when (1): 'Subject' includes 'Alert', (2): 'Email body' contains string 'MYZIGNALYREDIRECTTRIGGER' and (3): 'From' contains 'noreply @ tradingview . com'.
In 'More Actions' check: Send Email-to-SMS
Message: ||{{strategy.order.alert_message}}||key=MYSECRETKEY||
MYZIGNALYREDIRECTTRIGGER
'(DEBUG) Enable debug on order comments' is turned on by default so that you can see in the Strategy Tester. List of Trades. The different orders alert_message that would have been sent to your alert. You might want to turn it off it some many letters in the screen is problem.
STRATEGY ADVICE
If you turn on 'Take Profit' then turn off 'Trailing Take Profit'.
ZIGNALY SIDE ADVICE
If you are a 'Signal Provider' make sure that 'Allow reusing the same signalId if there isn't any open position using it?' setting in the profile tab is set to true.
You can find your 'MYSECRETKEY' in your 'Copy Trader/Signal' provider Edit tab at 'Signal URL'.
ADDITIONAL ZIGNALY DOCUMENTATION
docs . zignaly . com / signals / how-to -- How to send signals to Zignaly
3 Ways to send signals to Zignaly
SIGNALS
FINAL REMARKS
This strategy tries to match the Pine Script Coding Conventions as best as possible.

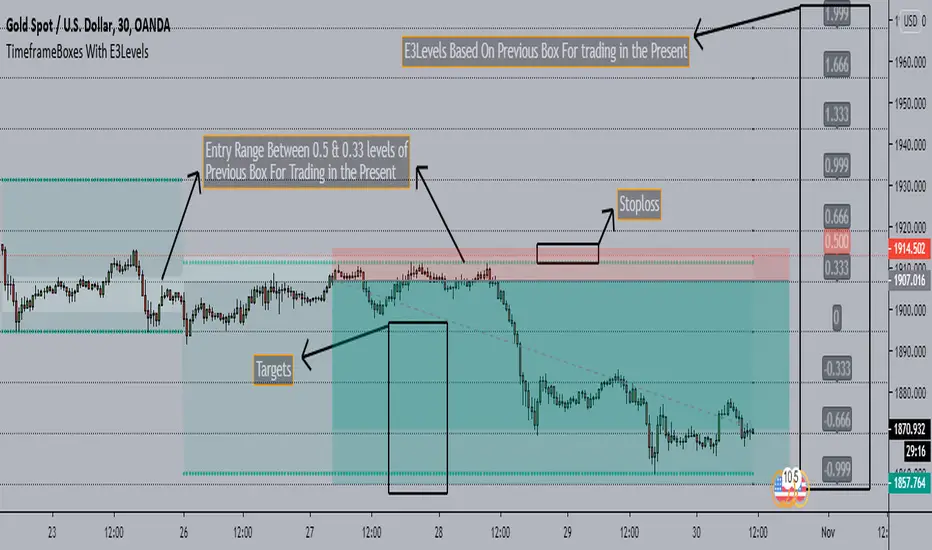
TimeframeBoxes(DailyBox) With E3Levels - SaeedKhakestar Method*** This is a Repaint Indicator that uses HIGH & LOW of Previous Range in the Custom Period(12H,1D,2D,3D & Weekly) for Trading In the Present with E3 Levels
TimeframeBoxes(DailyBox) With E3Levels - SaeedKhakestar Method
Version 1.00
Created by TWA_TradeWithAmir(TWA_PriceActionTips)
Updated 10/29/2020
Based On SaeedKhakestar Method(Trigger Price Action)
*With Entry Range
*With E3 Levels
*12H,1D,2D,3D & Weekly Boxes
*Entry Range & E3 Levels Belongs to Previous Box
*TRex Method
Pivot Range - Fisher's Methodology(1D & 3D & W & M)Pivot Range - Fisher's Methodology(1D & 3D & W & M)
Version 2.00
Created by TWA_TradeWithAmir(TWA_PriceActionTips)
Updated 10/29/2020
Based On Mark B. Fisher's ACD Methodology
* 1D Pivot Range, 3D Pivot Range, Weekly Pivot Range & Monthly Pivot Range

Equity Risk PremiumInspired by the article "2020's Best Performing Hedge Fund Warns Of 'Incredible Move' Around The Election" from ZeroHedge:
This script explores the relationship and attempts to find dislocation between equity risk (VIX) and high-yield corporate debt risk (VXHYG, The Cboe VXHYG Index is an estimate of the expected 30-day volatility of the return on iShares' High Yield Grade ETF (HYG). VXHYG is derived by applying the VIX algorithm to options on HYG).
The basic logic is (closing price of VIX / closing price of VXHYG) - 1. When equity risk is high and credit risk is low, the value of premium will be high, and vice-versa.
“'Equity volatility is almost inescapably high. Is that a good form of insurance? The payoff profiles are nothing like they were back in January. Whereas in credit, we’re almost back to where we were in January.
I find today the risk-reward profile of credit to be basically among the worst, relative to other things, I’ve seen in my career,' Weinstein said. 'A VIX at 20 used to be quite a feat. Here we are at 30, and the credit market hasn’t blinked.'
As a result of the gaping divergence between the VIX and credit spreads - the two had moved in tandem for years, but in August the two series blew out as the VIX started rising as spreads kept falling - Weinstein has pounced on the trade, betting on vol compression."
When equity risk premium is high, the market may be forming a local top.
When equity risk premium is low, the market may be forming a local bottom.
Make sure to select your current timeframe on the dropdown menu.

Presidential 2020 Candidate and Undecided Voter Poll StatsThis is just a simple indicator to show the election poll stats and include the value for undecided voters.

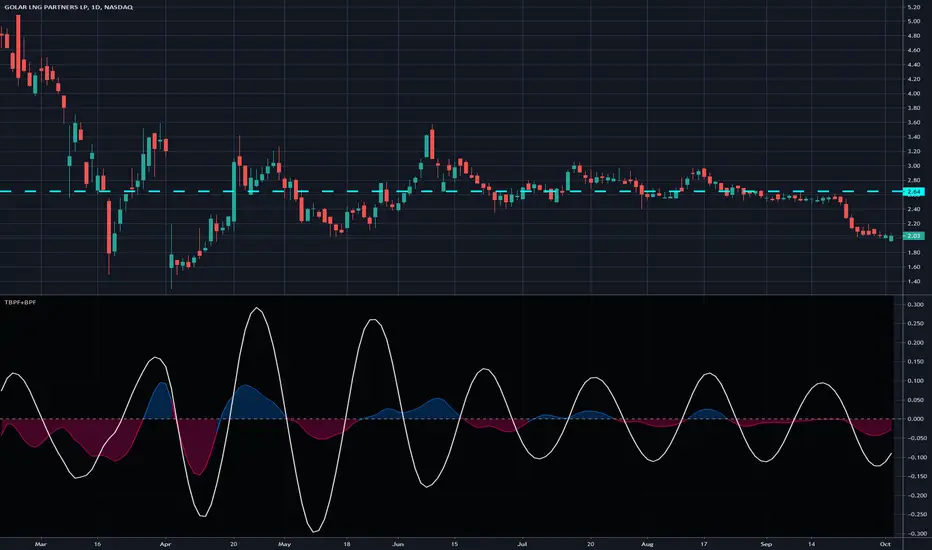
Truncated Bandpass Filter and Bandpass Filter - Dr. John EhlersWith the arrival of the blessed gifts of arrays from TV, I now present the REAL "Truncated Bandpass Filter" indicator employing PSv4.0 upon initial release, originally formulated by the magnificent mathemagician Dr. John Ehlers for TASC - July 2020 Traders Tips. Don't be bamboozled by the other incorrect truncated bandpass filters found on TV, those published with an erroneous haste that preceded Pine array availability. More information about these bandpass filters can be acquired with a simple search for this indicator's white paper, entitled "TRUNCATED INDICATORS by John F. Ehlers", on his site in the educational reference section.
This actually contains two indicators, one being the truncated bandpass, the other being a two pole bandpass which is also found in my Voss implementation. The two pole bandpass is primarily for comparison of both types, but as you can see, they share common code within both, one being truncated and the other not. I modified Ehlers' original truncation formulation by allowing the capability to alter the truncation period using two distinct methods. I will explain very briefly that the purpose of a truncated "infinite impulse response" filter is to dampen it's response. Truncation techniques aren't limited to only bandpass filters, "some" other IIR filters, but not all, may benefit from this as well.
Lastly this is a miniature starter lesson by example of how the new native Pine array functions may be used, along with other various methods such as `var` to improve computational efficiency on the cloud servers. Yep, native Pine arrays just doubled the "Power of Pine" by exponential magnitudes of power into the dimension of what I would now term as the "Immense Power of Pine" . The next generation capability of programming extremely advanced indicators has now successfully arrived on mothership Earth, right on TradingView's front lawn. Who would of known?? This is brought to you in part by the devoted voluntary efforts of the most skilled poetic programmers on TV, the likes of which most extraterrestrial alien programmers would fear. Ladies and Gents, YOU KNOW WHO YOU ARE. Wink, wink!
NOTICE: You have absolute freedom to use this source code any way you see fit within your new Pine projects. You don't have to ask for my permission to reuse these functions in your published scripts, simply because I have better things to do than answer requests for the reuse of the tbpf() and bpf() functions. Sufficient accreditation regarding this script and compliance with "TV's House Rules" regarding code reuse, is as easy as copying the functions in their entirety as is. Fair enough? Good!
Features List Includes:
Dark Background - Easily disabled in indicator Settings->Style for "Light" charts or with Pine commenting
AND a few more... Why list them, when you have the source code to explore!
When available time provides itself, I will consider your inquiries, thoughts, and concepts presented below in the comments section, should you have any questions or comments regarding this indicator. When my indicators achieve more prevalent use by TV members, I may implement more ideas when they present themselves as worthy additions. Have a profitable future everyone!
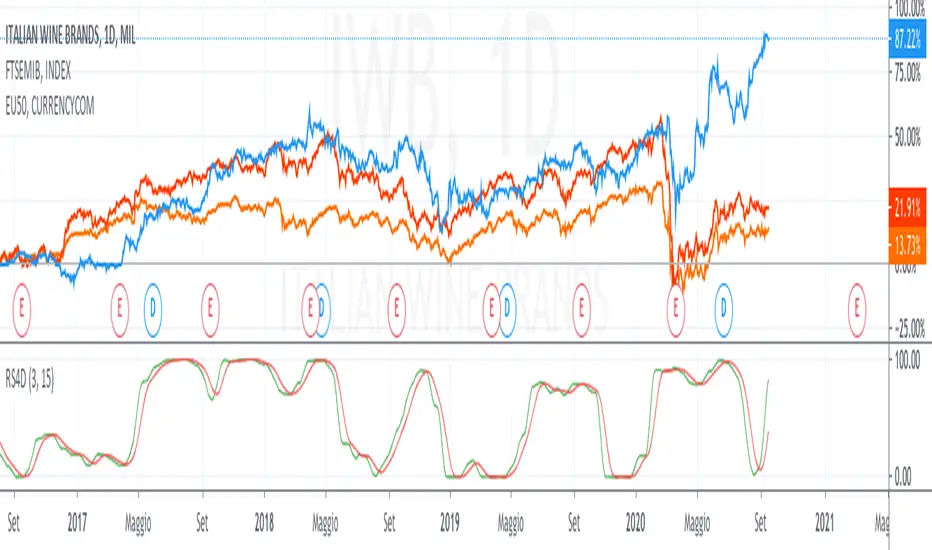
Relative Strength 4DimensionIn the S&C September 2020 article “Tracking Relative Strength In Four Dimensions”, James Garofallou presents a metric for evaluating a security’s strength relative to 11 major market sectors and over several time periods. All this information is squeezed into a single value. Maybe at cost of losing other important information? In this article we’ll look into how to program such a beast, and how it fares when we use it for rebalancing a stock portfolio.
This is a redesigned version for an european point of view.
I used 10 index for the comparison.
feel free to tip me ;-)
Ruckard TradingLatinoThis strategy tries to mimic TradingLatino strategy.
The current implementation is beta.
Si hablas castellano o espanyol por favor consulta MENSAJE EN CASTELLANO más abajo.
It's aimed at BTCUSDT pair and 4h timeframe.
STRATEGY DEFAULT SETTINGS EXPLANATION
max_bars_back=5000 : This is a random number of bars so that the strategy test lasts for one or two years
calc_on_order_fills=false : To wait for the 4h closing is too much. Try to check if it's worth entering a position after closing one. I finally decided not to recheck if it's worth entering after an order is closed. So it is false.
calc_on_every_tick=false
pyramiding=0 : We only want one entry allowed in the same direction. And we don't want the order to scale by error.
initial_capital=1000 : These are 1000 USDT. By using 1% maximum loss per trade and 7% as a default stop loss by using 1000 USDT at 12000 USDT per BTC price you would entry with around 142 USDT which are converted into: 0.010 BTC . The maximum number of decimal for contracts on this BTCUSDT market is 3 decimals. E.g. the minimum might be: 0.001 BTC . So, this minimal 1000 amount ensures us not to entry with less than 0.001 entries which might have happened when using 100 USDT as an initial capital.
slippage=1 : Binance BTCUSDT mintick is: 0.01. Binance slippage: 0.1 % (Let's assume). TV has an integer slippage. It does not have a percentage based slippage. If we assume a 1000 initial capital, the recommended equity is 142 which at 11996 USDT per BTC price means: 0.011 BTC. The 0.1% slippage of: 0.011 BTC would be: 0.000011 . This is way smaller than the mintick. So our slippage is going to be 1. E.g. 1 (slippage) * 0.01 (mintick)
commission_type=strategy.commission.percent and commission_value=0.1 : According to: binance . com / en / fee / schedule in VIP 0 level both maker and taker fees are: 0.1 %.
BACKGROUND
Jaime Merino is a well known Youtuber focused on crypto trading
His channel TradingLatino
features monday to friday videos where he explains his strategy.
JAIME MERINO STANCE ON BOTS
Jaime Merino stance on bots (taken from memory out of a 2020 June video from him):
'~
You know. They can program you a bot and it might work.
But, there are some special situations that the bot would not be able to handle.
And, I, as a human, I would handle it. And the bot wouldn't do it.
~'
My long term target with this strategy script is add as many
special situations as I can to the script
so that it can match Jaime Merino behaviour even in non normal circumstances.
My alternate target is learn Pine script
and enjoy programming with it.
WARNING
This script might be bigger than other TradingView scripts.
However, please, do not be confused because the current status is beta.
This script has not been tested with real money.
This is NOT an official strategy from Jaime Merino.
This is NOT an official strategy from TradingLatino . net .
HOW IT WORKS
It basically uses ADX slope and LazyBear's Squeeze Momentum Indicator
to make its buy and sell decisions.
Fast paced EMA being bigger than slow paced EMA
(on higher timeframe) advices going long.
Fast paced EMA being smaller than slow paced EMA
(on higher timeframe) advices going short.
It finally add many substrats that TradingLatino uses.
SETTINGS
__ SETTINGS - Basics
____ SETTINGS - Basics - ADX
(ADX) Smoothing {14}
(ADX) DI Length {14}
(ADX) key level {23}
____ SETTINGS - Basics - LazyBear Squeeze Momentum
(SQZMOM) BB Length {20}
(SQZMOM) BB MultFactor {2.0}
(SQZMOM) KC Length {20}
(SQZMOM) KC MultFactor {1.5}
(SQZMOM) Use TrueRange (KC) {True}
____ SETTINGS - Basics - EMAs
(EMAS) EMA10 - Length {10}
(EMAS) EMA10 - Source {close}
(EMAS) EMA55 - Length {55}
(EMAS) EMA55 - Source {close}
____ SETTINGS - Volume Profile
Lowest and highest VPoC from last three days
is used to know if an entry has a support
VPVR of last 100 4h bars
is also taken into account
(VP) Use number of bars (not VP timeframe): Uses 'Number of bars {100}' setting instead of 'Volume Profile timeframe' setting for calculating session VPoC
(VP) Show tick difference from current price {False}: BETA . Might be useful for actions some day.
(VP) Number of bars {100}: If 'Use number of bars (not VP timeframe)' is turned on this setting is used to calculate session VPoC.
(VP) Volume Profile timeframe {1 day}: If 'Use number of bars (not VP timeframe)' is turned off this setting is used to calculate session VPoC.
(VP) Row width multiplier {0.6}: Adjust how the extra Volume Profile bars are shown in the chart.
(VP) Resistances prices number of decimal digits : Round Volume Profile bars label numbers so that they don't have so many decimals.
(VP) Number of bars for bottom VPOC {18}: 18 bars equals 3 days in suggested timeframe of 4 hours. It's used to calculate lowest session VPoC from previous three days. It's also used as a top VPOC for sells.
(VP) Ignore VPOC bottom advice on long {False}: If turned on it ignores bottom VPOC (or top VPOC on sells) when evaluating if a buy entry is worth it.
(VP) Number of bars for VPVR VPOC {100}: Number of bars to calculate the VPVR VPoC. We use 100 as Jaime once used. When the price bounces back to the EMA55 it might just bounce to this VPVR VPoC if its price it's lower than the EMA55 (Sells have inverse algorithm).
____ SETTINGS - ADX Slope
ADX Slope
help us to understand if ADX
has a positive slope, negative slope
or it is rather still.
(ADXSLOPE) ADX cut {23}: If ADX value is greater than this cut (23) then ADX has strength
(ADXSLOPE) ADX minimum steepness entry {45}: ADX slope needs to be 45 degrees to be considered as a positive one.
(ADXSLOPE) ADX minimum steepness exit {45}: ADX slope needs to be -45 degrees to be considered as a negative one.
(ADXSLOPE) ADX steepness periods {3}: In order to avoid false detection the slope is calculated along 3 periods.
____ SETTINGS - Next to EMA55
(NEXTEMA55) EMA10 to EMA55 bounce back percentage {80}: EMA10 might bounce back to EMA55 or maybe to 80% of its complete way to EMA55
(NEXTEMA55) Next to EMA55 percentage {15}: How much next to the EMA55 you need to be to consider it's going to bounce back upwards again.
____ SETTINGS - Stop Loss and Take Profit
You can set a default stop loss or a default take profit.
(STOPTAKE) Stop Loss % {7.0}
(STOPTAKE) Take Profit % {2.0}
____ SETTINGS - Trailing Take Profit
You can customize the default trailing take profit values
(TRAILING) Trailing Take Profit (%) {1.0}: Trailing take profit offset in percentage
(TRAILING) Trailing Take Profit Trigger (%) {2.0}: When 2.0% of benefit is reached then activate the trailing take profit.
____ SETTINGS - MAIN TURN ON/OFF OPTIONS
(EMAS) Ignore advice based on emas {false}.
(EMAS) Ignore advice based on emas (On closing long signal) {False}: Ignore advice based on emas but only when deciding to close a buy entry.
(SQZMOM) Ignore advice based on SQZMOM {false}: Ignores advice based on SQZMOM indicator.
(ADXSLOPE) Ignore advice based on ADX positive slope {false}
(ADXSLOPE) Ignore advice based on ADX cut (23) {true}
(STOPTAKE) Take Profit? {false}: Enables simple Take Profit.
(STOPTAKE) Stop Loss? {True}: Enables simple Stop Loss.
(TRAILING) Enable Trailing Take Profit (%) {True}: Enables Trailing Take Profit.
____ SETTINGS - Strategy mode
(STRAT) Type Strategy: 'Long and Short', 'Long Only' or 'Short Only'. Default: 'Long and Short'.
____ SETTINGS - Risk Management
(RISKM) Risk Management Type: 'Safe', 'Somewhat safe compound' or 'Unsafe compound'. ' Safe ': Calculations are always done with the initial capital (1000) in mind. The maximum losses per trade/day/week/month are taken into account. ' Somewhat safe compound ': Calculations are done with initial capital (1000) or a higher capital if it increases. The maximum losses per trade/day/week/month are taken into account. ' Unsafe compound ': In each order all the current capital is gambled and only the default stop loss per order is taken into account. That means that the maximum losses per trade/day/week/month are not taken into account. Default : 'Somewhat safe compound'.
(RISKM) Maximum loss per trade % {1.0}.
(RISKM) Maximum loss per day % {6.0}.
(RISKM) Maximum loss per week % {8.0}.
(RISKM) Maximum loss per month % {10.0}.
____ SETTINGS - Decimals
(DECIMAL) Maximum number of decimal for contracts {3}: How small (3 decimals means 0.001) an entry position might be in your exchange.
EXTRA 1 - PRICE IS IN RANGE indicator
(PRANGE) Print price is in range {False}: Enable a bottom label that indicates if the price is in range or not.
(PRANGE) Price range periods {5}: How many previous periods are used to calculate the medians
(PRANGE) Price range maximum desviation (%) {0.6} ( > 0 ): Maximum positive desviation for range detection
(PRANGE) Price range minimum desviation (%) {0.6} ( > 0 ): Mininum negative desviation for range detection
EXTRA 2 - SQUEEZE MOMENTUM Desviation indicator
(SQZDIVER) Show degrees {False}: Show degrees of each Squeeze Momentum Divergence lines to the x-axis.
(SQZDIVER) Show desviation labels {False}: Whether to show or not desviation labels for the Squeeze Momentum Divergences.
(SQZDIVER) Show desviation lines {False}: Whether to show or not desviation lines for the Squeeze Momentum Divergences.
EXTRA 3 - VOLUME PROFILE indicator
WARNING: This indicator works not on current bar but on previous bar. So in the worst case it might be VP from 4 hours ago. Don't worry, inside the strategy calculus the correct values are used. It's just that I cannot show the most recent one in the chart.
(VP) Print recent profile {False}: Show Volume Profile indicator
(VP) Avoid label price overlaps {False}: Avoid label prices to overlap on the chart.
EXTRA 4 - ZIGNALY SUPPORT
(ZIG) Zignaly Alert Type {Email}: 'Email', 'Webhook'. ' Email ': Prepare alert_message variable content to be compatible with zignaly expected email content format. ' Webhook ': Prepare alert_message variable content to be compatible with zignaly expected json content format.
EXTRA 5 - DEBUG
(DEBUG) Enable debug on order comments {False}: If set to true it prepares the order message to match the alert_message variable. It makes easier to debug what would have been sent by email or webhook on each of the times an order is triggered.
HOW TO USE THIS STRATEGY
BOT MODE: This is the default setting.
PROPER VOLUME PROFILE VIEWING: Click on this strategy settings. Properties tab. Make sure Recalculate 'each time the order was run' is turned off.
NEWBIE USER: (Check PROPER VOLUME PROFILE VIEWING above!) You might want to turn on the 'Print recent profile {False}' setting. Alternatively you can use my alternate realtime study: 'Resistances and supports based on simplified Volume Profile' but, be aware, it might consume one indicator.
ADVANCED USER 1: Turn on the 'Print price is in range {False}' setting and help us to debug this subindicator. Also help us to figure out how to include this value in the strategy.
ADVANCED USER 2: Turn on the all the (SQZDIVER) settings and help us to figure out how to include this value in the strategy.
ADVANCED USER 3: (Check PROPER VOLUME PROFILE VIEWING above!) Turn on the 'Print recent profile {False}' setting and report any problem with it.
JAIME MERINO: Just use the indicator as it comes by default. It should only show BUY signals, SELL signals and their associated closing signals. From time to time you might want to check 'ADVANCED USER 2' instructions to check that there's actually a divergence. Check also 'ADVANCED USER 1' instructions for your amusement.
EXTRA ADVICE
It's advised that you use this strategy in addition to these two other indicators:
* Squeeze Momentum Indicator
* ADX
so that your chart matches as close as possible to TradingLatino chart.
ZIGNALY INTEGRATION
This strategy supports Zignaly email integration by default. It also supports Zignaly Webhook integration.
ZIGNALY INTEGRATION - Email integration example
What you would write in your alert message:
||{{strategy.order.alert_message}}||key=MYSECRETKEY||
ZIGNALY INTEGRATION - Webhook integration example
What you would write in your alert message:
{ {{strategy.order.alert_message}} , "key" : "MYSECRETKEY" }
CREDITS
I have reused and adapted some code from
'Directional Movement Index + ADX & Keylevel Support' study
which it's from TradingView console user.
I have reused and adapted some code from
'3ema' study
which it's from TradingView hunganhnguyen1193 user.
I have reused and adapted some code from
'Squeeze Momentum Indicator ' study
which it's from TradingView LazyBear user.
I have reused and adapted some code from
'Strategy Tester EMA-SMA-RSI-MACD' study
which it's from TradingView fikira user.
I have reused and adapted some code from
'Support Resistance MTF' study
which it's from TradingView LonesomeTheBlue user.
I have reused and adapted some code from
'TF Segmented Linear Regression' study
which it's from TradingView alexgrover user.
I have reused and adapted some code from
"Poor man's volume profile" study
which it's from TradingView IldarAkhmetgaleev user.
FEEDBACK
Please check the strategy source code for more detailed information
where, among others, I explain all of the substrats
and if they are implemented or not.
Q1. Did I understand wrong any of the Jaime substrats (which I have implemented)?
Q2. The strategy yields quite profit when we should long (EMA10 from 1d timeframe is higher than EMA55 from 1d timeframe.
Why the strategy yields much less profit when we should short (EMA10 from 1d timeframe is lower than EMA55 from 1d timeframe)?
Any idea if you need to do something else rather than just reverse what Jaime does when longing?
FREQUENTLY ASKED QUESTIONS
FAQ1. Why are you giving this strategy for free?
TradingLatino and his fellow enthusiasts taught me this strategy. Now I'm giving back to them.
FAQ2. Seriously! Why are you giving this strategy for free?
I'm confident his strategy might be improved a lot. By keeping it to myself I would avoid other people contributions to improve it.
Now that everyone can contribute this is a win-win.
FAQ3. How can I connect this strategy to my Exchange account?
It seems that you can attach alerts to strategies.
You might want to combine it with a paying account which enable Webhook URLs to work.
I don't know how all of this works right now so I cannot give you advice on it.
You will have to do your own research on this subject. But, be careful. Automating trades, if not done properly,
might end on you automating losses.
FAQ4. I have just found that this strategy by default gives more than 3.97% of 'maximum series of losses'. That's unacceptable according to my risk management policy.
You might want to reduce default stop loss setting from 7% to something like 5% till you are ok with the 'maximum series of losses'.
FAQ5. Where can I learn more about your work on this strategy?
Check the source code. You might find unused strategies. Either because there's not a substantial increases on earnings. Or maybe because they have not been implemented yet.
FAQ6. How much leverage is applied in this strategy?
No leverage.
FAQ7. Any difference with original Jaime Merino strategy?
Most of the times Jaime defines an stop loss at the price entry. That's not the case here. The default stop loss is 7% (but, don't be confused it only means losing 1% of your investment thanks to risk management). There's also a trailing take profit that triggers at 2% profit with a 1% trailing.
FAQ8. Why this strategy return is so small?
The strategy should be improved a lot. And, well, backtesting in this platform is not guaranteed to return theoric results comparable to real-life returns. That's why I'm personally forward testing this strategy to verify it.
MENSAJE EN CASTELLANO
En primer lugar se agradece feedback para mejorar la estrategia.
Si eres un usuario avanzado y quieres colaborar en mejorar el script no dudes en comentar abajo.
Ten en cuenta que aunque toda esta descripción tenga que estar en inglés no es obligatorio que el comentario esté en inglés.
CHISTE - CASTELLANO
¡Pero Jaime!
¡400.000!
¡Tu da mun!

PineScript v4 - Forex Pin-Bar Trading StrategyPineScript v4, forex trading robot based on the commonly used bullish / bearish pin-bar piercing the moving averages strategy.
I coded this robot to stress-test the PineScript v4 language to see how advanced it is, and whether I could port a forex trading strategy from MT4 to TradingView.
In my opinion, PineScript v4 is still not a professional coding language; for example you cannot use IF-statements to modify the contents of global variables; this makes complex robot behaviour difficult to implement. In addition, it is unclear if the programmer can use nested IF-ELSE, or nested FOR within IF.
The sequence of program execution is also unclear, and although complex order entry and exit appears to function properly, I am not completely comfortable with it.
Recommended Chart Settings:
Asset Class: Forex
Time Frame: H1
Long Entry Conditions:
a) Moving Average up trend, fast crosses above slow
b) Presence of a Bullish Pin Bar
c) Pin Bar pierces either Moving Average
d) Moving Averages must be sloping up, angle threshold (optional)
Short Entry Conditions:
a) Moving Average down trend, fast crosses below slow
b) Presence of a Bearish Pin Bar
c) Pin Bar pierces either Moving Average
d) Moving Averages must be sloping down, angle threshold (optional)
Exit Conditions:
a) Stoploss level is hit
b) Takeprofit level is hit
c) Moving Averages cross-back (optional)
Default Robot Settings:
Equity Risk (%): 3 //how much account balance to risk per trade
Stop Loss (x*ATR, Float): 2.1 //stoploss = x * ATR, you can change x
Risk : Reward (1 : x*SL, Float): 3.1 //takeprofit = x * stop_loss_distance, you can change x
Fast MA (Period): 20 //fast moving average period
Slow MA (Period): 50 //slow moving average period
ATR (Period): 14 //average true range period
Use MA Slope (Boolean): true //toggle the requirement of the moving average slope
Bull Slope Angle (Deg): 1 //angle above which, moving average is considered to be sloping up
Bear Slope Angle (Deg): -1 //angle below which, moving average is considered to be sloping down
Exit When MA Re-Cross (Boolean): true //toggle, close trade if moving average crosses back
Cancel Entry After X Bars (Period): 3 //cancel the order after x bars not triggered, you can change x
Backtest Results (2019 to 2020, H1, Default Settings):
EURJPY - 111% profit, 2.631 profit factor, 16.43% drawdown
EURUSD - 103% profit, 2.899 profit factor, 14.95% drawdown
EURAUD - 76.75% profit, 1.8 profit factor, 17.99% drawdown
NZDUSD - 64.62% profit, 1.727 profit factor, 19.14% drawdown
GBPUSD - 58.73% profit, 1.663 profit factor, 15.44% downdown
AUDJPY - 48.71% profit, 1.635 profit factor, 11.81% drawdown
USDCHF - 30.72% profit, 1.36 profit factor, 22.63% drawdown
AUDUSD - 8.54% profit, 1.092 profit factor, 19.86% drawdown
EURGBP - 0.03% profit, 1.0 profit factor, 29.66% drawdown
USDJPY - 1.96% loss, 0.972 profit factor, 28.37% drawdown
USDCAD - 6.36% loss, 0.891 profit factor, 21.14% drawdown
GBPJPY - 28.27% loss, 0.461 profit factor, 39.13% drawdown
To reduce the possibility of curve-fitting, this robot was backtested on 12 popular forex currencies, as shown above. The robot was profitable on 8 out of 12 currencies, breakeven on 1, and made a loss on 3.
The default robot settings could be over-fitting for the EUR, as we can see out-sized performance for the EUR pairs, with the exception of the EURGBP. We can see that GBPJPY made the largest loss, so these two pairs could be related.
Risk Warning:
This is a forex trading strategy that involves high risk of equity loss, and backtest performance will not equal future results. You agree to use this script at your own risk.

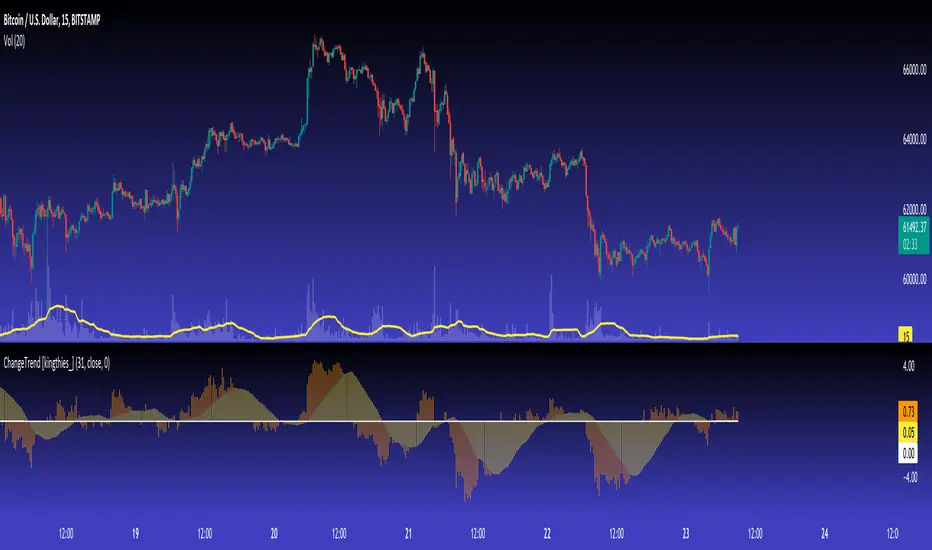
ChangeTrend [kingthies_]% X Change Over Y Amount of Time
AKA "ChangeTrend"
Published by user Eric Thies on 9/3/2020
Description
Relatively simple script that is measuring the performance of the input over the previous y # bars.
The EMA appears to make troughs and peaks easy to see coming / look at as they happen.
Interpretation:
Orange Histogram Represents the immediate % Change
Yellow Histogram represents the overall trend of such as an SMA of the same Y # of bars.
Cheers,
Price breaksThis indicator displays the High/Low/Close of the previous day/week/month as horizontal lines. Of course, everything is configurable but to keep it simple and non-intrusive it only displays:
month's H/L/C levels on D time frame (drawn as circles)
week's levels on 4h (as crosses)
day's levels on 1h (as line)
These levels act as support / resistance over and over again, see current (08/24/2020) BTCUSD chart, the previous month's close (blue circles) did act as support and held on 08/11, also prev month's high (red circles) was not broken on 08/21. Once these levels break we might see lower prices but so far both of them act as good support to consider.
